The Han River is the largest river in Korea, and because it is the main water resource for the capital metropolitan area (Seoul), protecting its water quality is of great concern. Water quality can be affected by many anthropogenic and natural factors, such as sewage discharge,changes in discharge, vegetation cover, agriculture, climate change, and air pollution, and etc. During the last two decades, many sewage treatment plants have been constructed in the Han River watershed to improve water quality (Jung et al. 2008). However, agricultural or nonpoint sources of suspended sediment, phosphorus,nitrogen, and humic substances have not been targeted in this effort, which can be factors for degrading water quality. In Korea, climate change resulting in an increase in rainfall intensity can be another factor increasing nonpoint source pollution (Lee et al. 2004, Kim et al. 2007,Yang 2007).
Water quality is monitored regularly at many sites in Korea by the Korean Ministry of Environment (KMOE).In addition, a Korean Long-Term Ecological Research(KLTER) program was launched to monitor ecological changes in various habitats including the Han River. It has been speculated that even after a large investment for sewage treatment plants, water quality in the Han River has not improved significantly, and that climate change might be exerting some effects on water quality. The summer monsoon climate in Korea, which cause extremely large seasonal variations, renders another source of uncertainty for assessing environmental changes. Many factors affect water quality, so it is far from simple to assess long-term changes in the aquatic ecosystem of a river. In this study, we compiled long-term water quality data, investigated temporal and spatial variations in the lower reach of the Han River, and discussed the environmental implications.
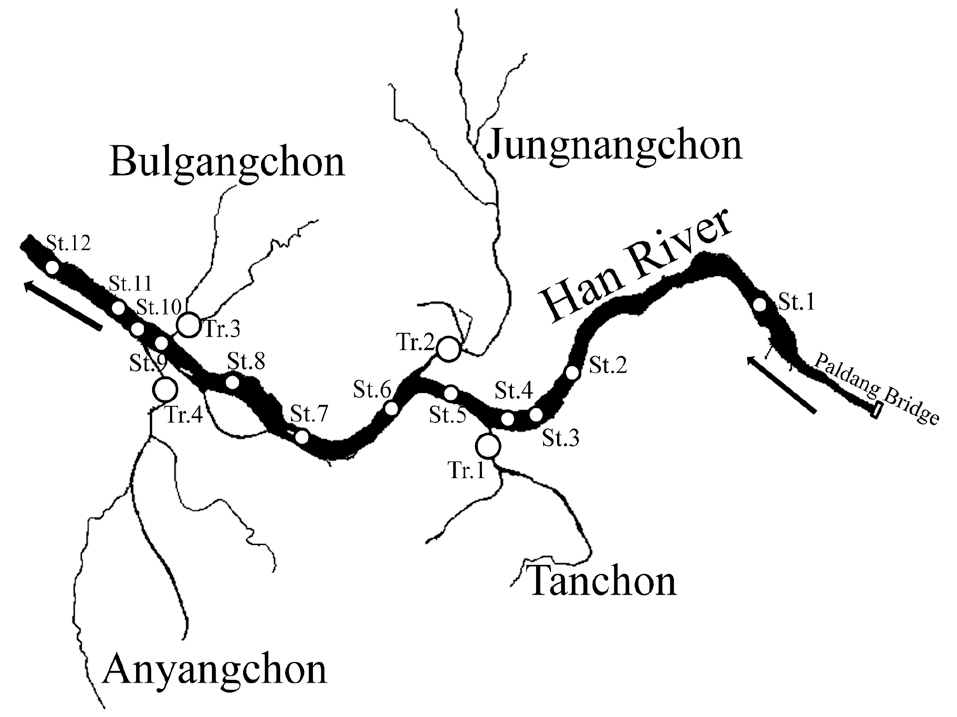
The study area was the lower reaches of the Han River between Paldang Dam and Haengju Bridge flowing through the center of the Seoul metropolitan area (Fig. 1). Two water dikes are present in the study area, which create stagnant reaches in the study area; one between stations 3 and 4 and the other just below station 12. Long-term water quality data were provided by KMOE at station 2 (St. Gui) and Lake Paldang from 1989 to 2006. Water quality parameters were also measured monthly from 2006 to 2010.
Longitudinal variations in biological oxygen demand (BOD), chemical oxygen demand (COD), total phosphorous (TP), and total nitrogen (TN) were measured at 12 sites along the lower Han River four times during the year (from May 2006 to February 2007), and nutrient concen-
trations were investigated in four tributaries (Fig. 1). Annual precipitation was calculated from Korea Meteorological Administration data.
Water quality parameters were measured using Standard Methods procedures (Eaton et al. 1992). Water samples for nutrients analysis were preserved by acidification with sulfuric acid to a pH < 2. TP was measured using the ascorbic acid method after decomposing the samples using the persulfate digestion method. TN was determined with an autoanalyzer (Skalar 5100; Skalar, Breda, The Netherlands) using the cadmium reduction method after digestion with persulfate. Aliquots of samples were filtered with Whatman GF/C glass fiber filters (Maidstone, England), and dried filters were used to measure the concentrations of suspended solids (SS) and volatile suspended solids (VSS). Filtrates were kept frozen until the dissolved inorganic phosphorus (DIP) and nitrate analyses.
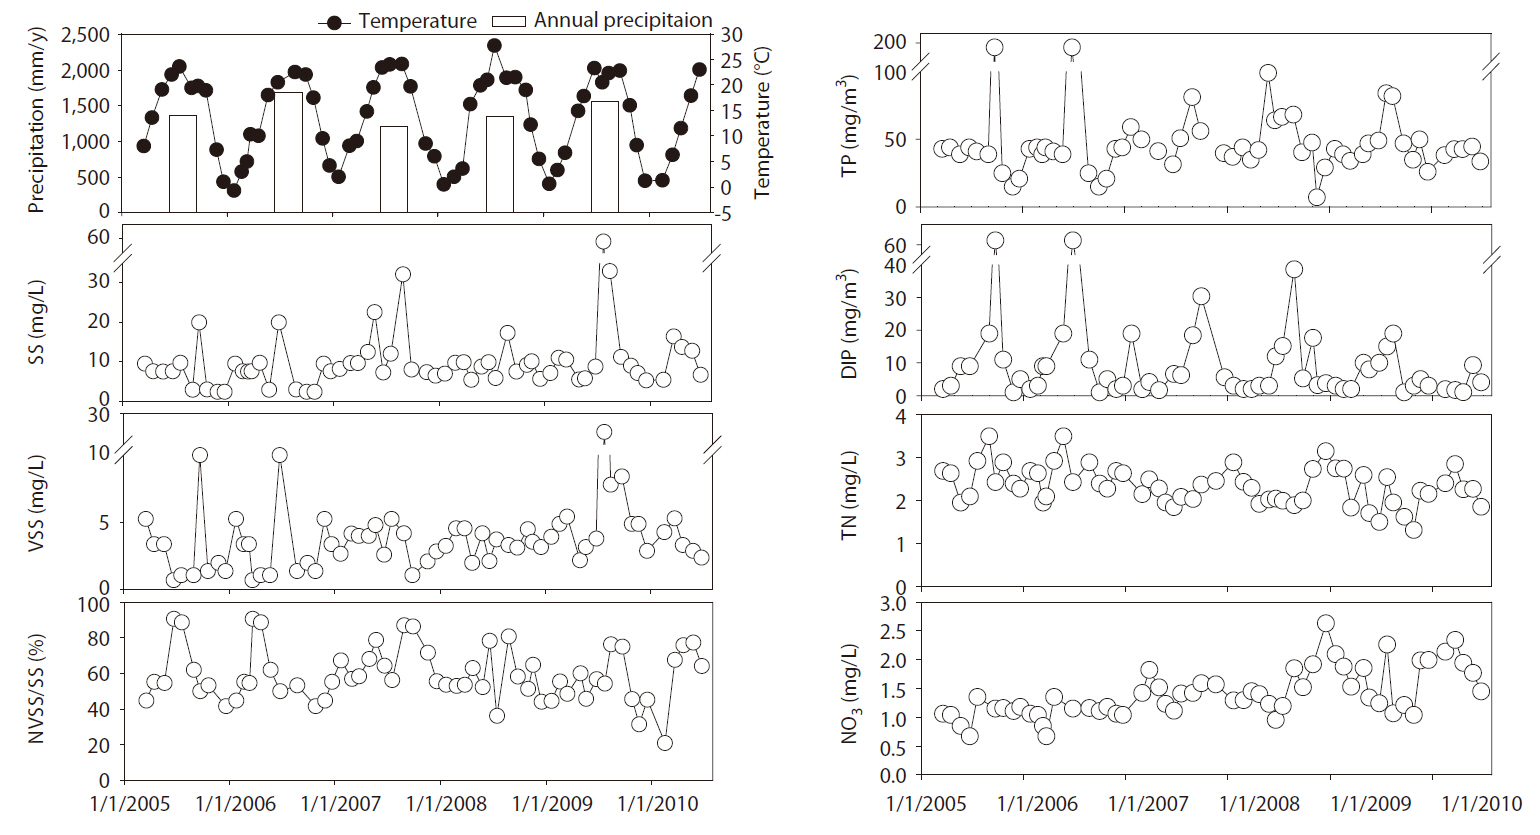
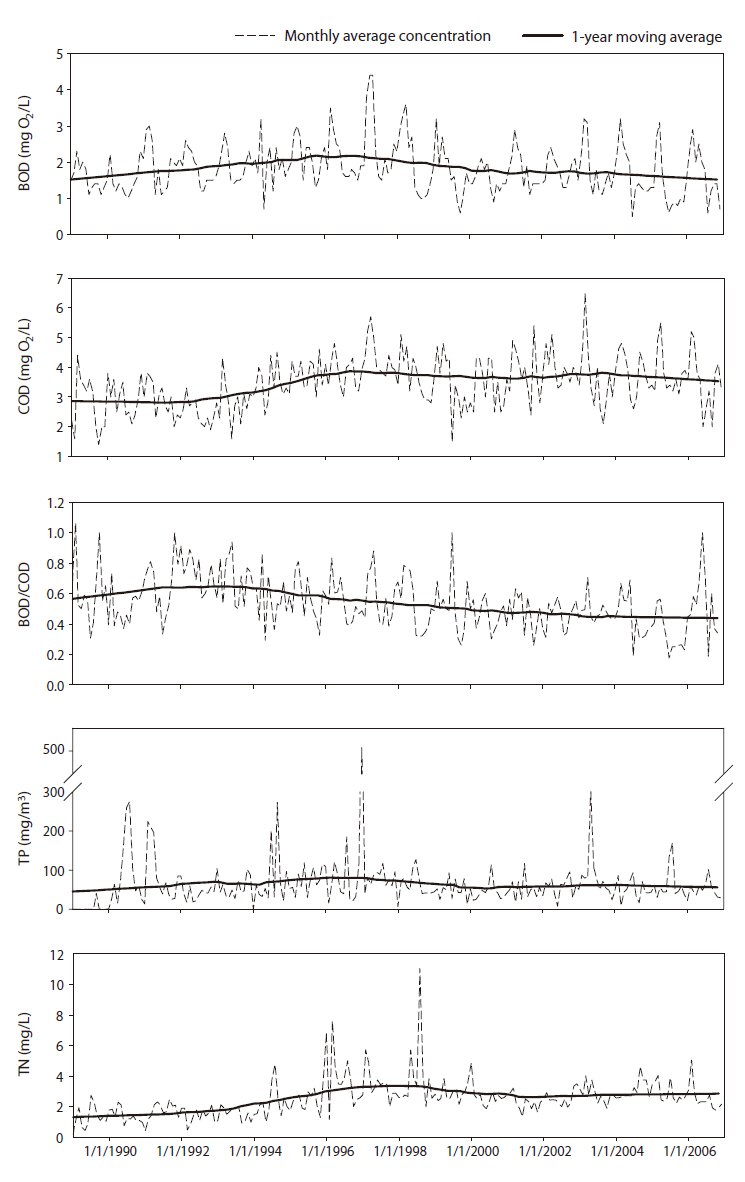
Variations in water discharge showed the typical seasonal pattern during the summer monsoon climate. From 1970 to 2009, the average annual precipitation was 1,387 mm/y. The minimal precipitation was 1,212 mm/y (2005), whereas the maximum was 1,682 mm/y (2006). High precipitation events were largely concentrated in summer and had a large impact on SS and TP in the river. Long-term variations in water quality data at KMOE station 2 are shown in Fig. 2 for 1989 to 2006. The seasonal variation in SS overwhelmed the year-to-year variation, so long-term trends in SS were not considered here. The average TP concentration was 63.3 ± 57.4 mg P/m3, indicating that the river was eutrophic. Concentrations of TP and DIP varied with flow rate and season, with the highest concentrations during the summer monsoon. TP concentration did not show a remarkable long-term trend. The average TN concentration was 2.34 ± 0.45 mg N/L, and TN decreased consistently from 1.3 mg N/L in 1989 to 2.92 mg N/L in 2005.
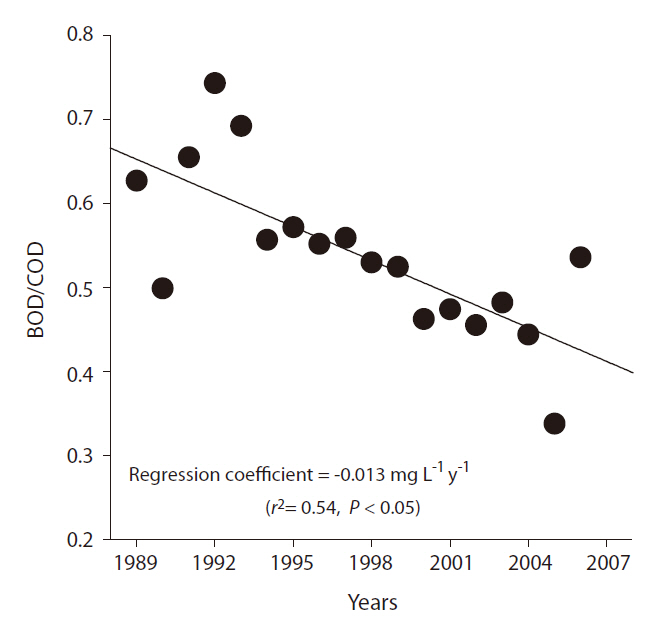
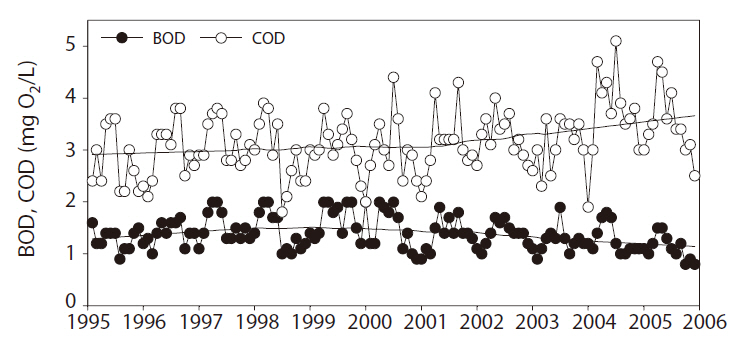
The average BOD was 1.82 ± 0.67 mg O2/L and COD was 3.46 ± 0.87 mg O2/L. BOD showed an increase before 1996 and then decreased after 1996. COD increased slightly after 1994 but has not varied much in recent years. Therefore, the BOD/COD ratio has decreased (Fig. 3).
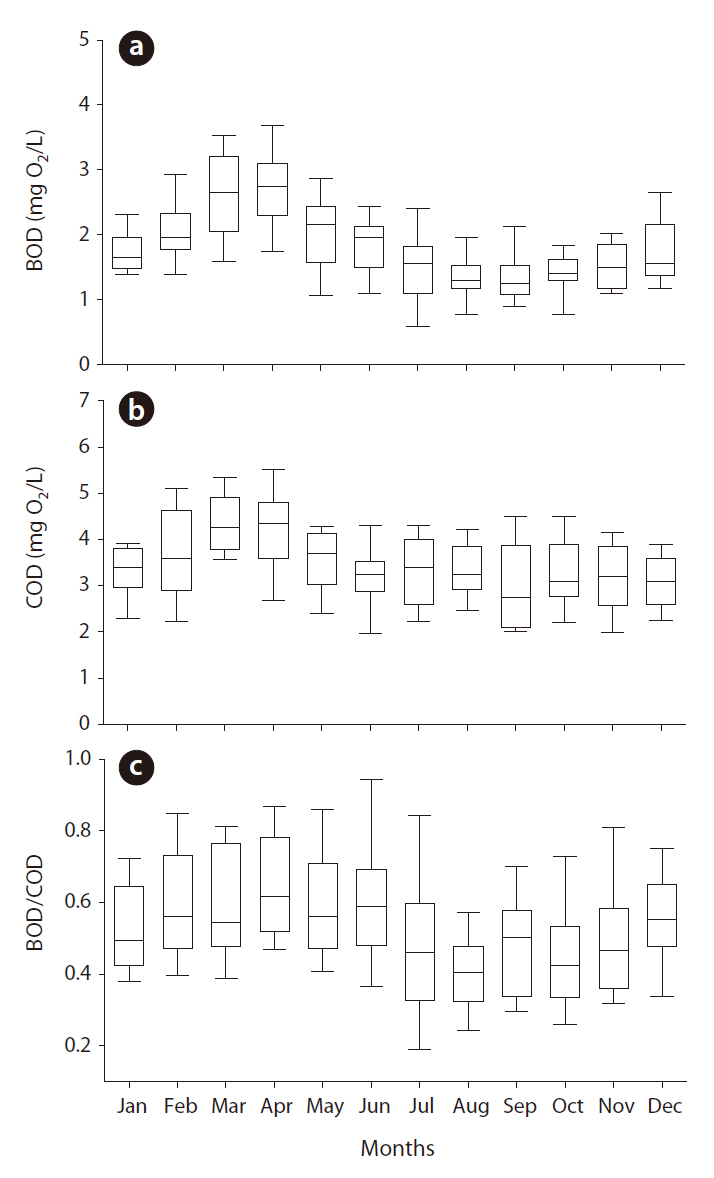
BOD, COD, and BOD/COD averages were calculated for each month for 18 years to analyze the seasonal variation pattern. BOD and COD were higher in the low-flow spring season than in the high-flow summer season (Fig.
4). Trends in BOD and COD at station 2 were compared with those at Lake Paldang located just upstream. BOD showed a slight decrease, whereas COD showed a slight increase, consequently, a decrease in BOD/COD was observed, which was similar to the trend at station 2 (Fig. 5).
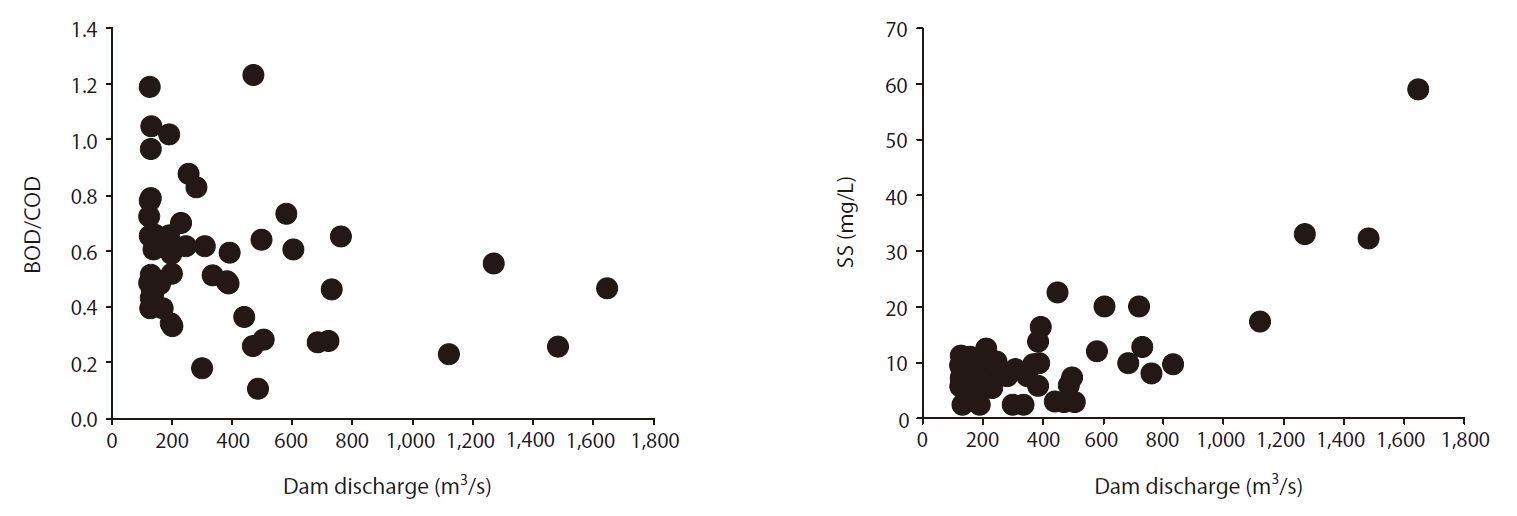
Therefore, the BOD/COD ratio at station 2 was affected by the discharge rate from the upstream reservoir, Lake Paldang (Fig. 6). Another remarkable effect of the upstream reservoir was the effect on SS at station 2.
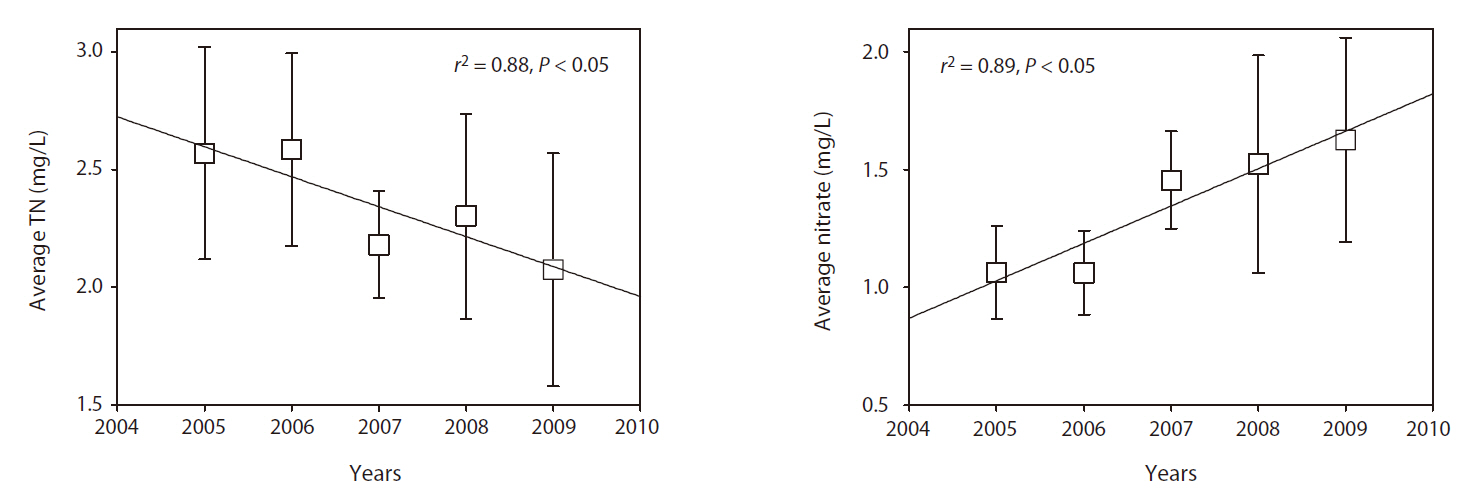
Water quality was measured monthly at station 2 from 2005 to 2010 (Fig. 7). The average SS was 10.2 ± 8.68 mg/L, and VSS was 3.96 ± 3.57 mg/L. VSS showed a smaller variation than SS. The average proportion of VSS in SS was 57 ± 17%, and it was higher in summer, particularly during rain events. P concentration showed large seasonal variations with a strong dependence on water discharge rate. phosphorus concentrations were high during high-flow seasons and low during low-flow seasons. DIP was depleted during low-flow seasons, which can be attributed to algal uptake. TN concentrations decreased during the study period, but nitrate concentrations increased (Fig. 8).
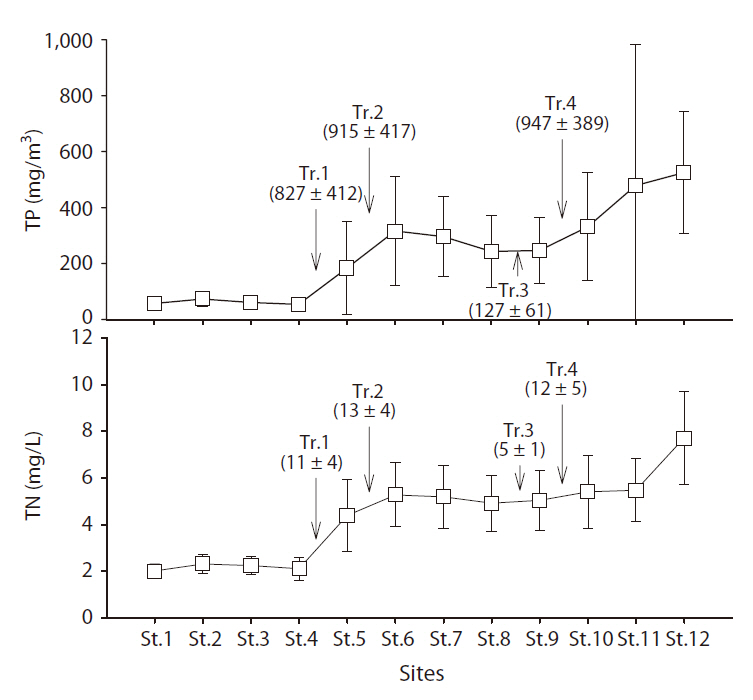
Longitudinal spatial variations in water quality were measured in the reach between Paldang Dam and Haengju Bridge (Fig. 9). Variations in TP and TN concentrations were most remarkable; both TP and TN increased significantly after convergence of the Wangsukchon
stream, the Tanchon stream (Tr. 1), and Jungnangchon stream (Tr. 2). TP concentration increased from <50 to 300-500 mg P/m3, indicating a hypereutrophic condition. TN concentrations increased from 2 to 6 mg N/L after convergence of Tr. 1 and Tr. 2, and TN concentrations were similar down to Haengju Bridge even though more tributaries converge along this reach of the Han River, suggesting that nutrient concentrations in the tributaries might be similar to concentrations in the main river.
BOD showed a decreasing trend, whereas COD did not show a decreasing trend in the last two decades in the lower Han River. BOD or biodegradable organic matter in a freshwater ecosystems originates from either sewage or phytoplankton primary production. Several cities produce sewage in the Han River watershed. However, sewage treatment facilities have been constructed, and about 87% of sewage sources are connected to sewer systems in Korea (Ministry of Environment 2009), which might explain the decrease in BOD.
Eutrophication can cause an increase in BOD, because algal cells are mostly biodegradable organic matter (Wetzel 2001). It was unclear whether phytoplankton biomass decreased during the study period in the Han River. Our data did not indicate a decrease in TP concentration, and we do not have any evidence for a decrease in phytoplankton biomass in the Han River. Enforced sewage treatment in the watershed is not thought to have effectively removed P, because sewage is treated using only biological treatment methods, which have low P removal efficiencies. In contrast, biological sewage treatment might have caused an increase in the algal growth potential in the receiving waters by converting particulate P into DIP with higher algal bioavailability.
The results did not show a decrease in COD and rather an increase in Lake Paldang. Consequently, the BOD/COD ratio decreased, which might be attributed to the decrease of BOD and consistent or slightly increasing COD. This result implies that the proportion of recalcitrant organic matter increased. The reason for the BOD decrease can be simply explained by sewage treatment, but the reason for the increase in recalcitrant organic matter is uncertain. In recent decades, an increase in recalcitrant organic matter or COD has been reported (Joo et al. 1997, Chang 2008, Lee and Choi 2009) and it was explained as an increase in natural organic matter discharge from forests and agricultural field. Forest cover in Korea has increased during the last five decades and organic farming using much organic compost has increased, which may have contributed to the accumulation of humic material in forest soils and its discharge from the watershed. Recalcitrant humic substances are major precursors of carcinogenic disinfection byproducts (DBPs) (Krasner et al. 1989, Reckhow et al. 1990, Nawrocki and Kalkowska 1995), and humic substances produce more DBPs than biodegradable organic material on a carbon basis (Reckhow et al. 1990, Owen et al. 1993, Krasner 1999). Therefore, the quality of drinking water sources can be better evaluated by recalcitrant organic matter than by biodegradable organic matter or BOD. The observation that recalcitrant organic matter has not decreased in the Han River indicates that water quality has not improved significantly even though BOD decreased slightly.
Phosphorus concentrations showed larger seasonal variation than the BOD, COD, and N concentrations, with the highest peaks during summer monsoon seasons with a high water velocity. Two major sources of P in the watershed of the Han River are sewage treatment plant effluent and agricultural sources (fertilizer, manure, and compost). The agricultural sources account for 87% (Kim et al. 2001). Fertilizer from agricultural fields is exported mostly during rain events, and floods are always associated with turbid runoff from nonpoint sources. Inorganic P can be easily adsorbed on the surface of clays, so P is discharged concomitantly when P-enriched top soil is eroded. However, a high TP concentration during the monsoon season does not result in algal blooms in the downstream reaches of the Han River because of the short hydraulic residence time during high discharge periods.
Instead, algal blooms occur during spring low water discharge in the Han River when hydraulic residence time is long enough to allow phytoplankton growth, and P concentrations are still adequate to support algal blooms. The TP concentration at station 2 was approximately 50 mg P/m3 during the dry seasons, which was at the eutrophic level compared with the threshold TP of 42 mg P/m3 suggested by Van Nieuwenhuyse and Jones (1996) and the 35 mg P/m3 suggested by the Organisation for Economic Co-operation and Development (1982). The main sources of P during the dry season are thought to be sewage treatment plants in large cities.
It is remarkable that TN concentrations have decreased and nitrate concentrations have increased in the Han River. This pattern implies that organic N concentrations have decreased. The decrease in organic N coincided with a trend for a decrease in BOD due to enhanced sewage treatment, but the reason for the nitrate increase requires further study. One plausible hypothesis is that sewage treatment plants usually discharge N in the form of ammonia, and ammonia is readily oxidized to nitrate in stream water. Consequently, enhanced sewage treatment resulted in an increase in inorganic N concentration. Effects of other N sources, such as fertilizer and nitrogen oxides from atmospheric input, deserve further study.
In our survey of longitudinal spatial variation, P concentrations increased to hypereutrophic levels below station 6 after convergence of the three tributaries. In the Seoul metropolitan area reaches of the Han River, TP was usually in the range of 300-600 mg P/m3 which is about ten times higher than the threshold level for eutrophication. Sewage treatment plant effluents in Korea normally have TP concentrations of 1.2 mg P/L (Kim et al. 2007), and tributaries discharged from the metropolitan area, often composed of a significant portion of sewage treatment plant effluent, can have higher TP concentrations. Although TP is very high in the downstream reaches of the Han River (stations 6 to 12), algal biomass does not coincide with what can be expected from the P concentration. Short hydraulic residence time is usually the limiting factor for algal growth in this area, and it seemed that phytoplankton could grow only up to 1/10 of what is expected from the relationship between TP and phytoplankton density for lentic habitats.