Micro eukaryotes such as small invertebrates, larvae and eggs, and plankton are very abundant in the environment and play important roles in supporting the ecosystem(Diez et al. 2001). However, they are often neglected in most biodiversity surveys due to difficulty of identification,a lack of specialists to identify such organisms,time-consuming soil screening processes, and a lack of taxonomic treatment of small organisms (Lefranc et al.2005). While most biota investigation has been generally performed using a taxonomic method based on morphological analysis, species identification systems using molecular analysis have been established for the identification of microbes, as a tool for microbial community biology, and for the classification of microbial population data from environmental samples (Olsen et al. 1986, Jahn et al. 2007, Zwolinski 2007).
Recently, DNA-based identification (DNA barcoding)has been started to the animal and plant kingdoms (Hebert et al. 2004, Barrett and Hebert 2005, Kress and Erickson 2007). Although vast sequence data for DNA barcoding regions in animals and plants have been deposited, DNA barcoding is mainly limited to the identification of a single sample. While molecular species identification has been popularly adopted to microbial community analysis for environmental samples (Sogin et al. 2006, Huber et al. 2007), it has been seldom applied to the identification of eukaryotes from environmental samples (Creer et al. 2010). Several researchers have studied the biodiversity of micro eukaryotes in extreme environments such as Antarctic soil and tropical lakes using small subunit ribosomal DNA (SSU rDNA) (Lawley et al. 2004, Lefranc et al. 2005, Fell et al. 2006).
In the present study, we describe a molecular survey of organisms from soil samples taken from the Upo wetland in Korea using two genes, cytochome oxidase I (COI) and SSU rDNA. As the COI gene is a mitochondrial gene, it has a universal primer for amplification and a better phylogenetic signal than other mitochondrial genes in most animal phyla (Folmer et al. 1994). For these reasons, COI is utilized as a DNA barcode for the discrimination of species (Hebert et al. 2003). However, since the molecular community estimation of environmental samples has been performed using 18S SSU rDNA (Savin et al. 2004, Behnke et al. 2006, Medinger et al. 2010), we also analyzed SSU rDNA for comparison with the COI results. Moreover, SSU rDNA is widely applied in phylogenetic analyses, constituting a vast portion of all available sequences and covering diverse taxa. Thus, we expected that SSU rDNA could compensate for the limitation of COI, which has been less studied compared to other taxa except metazoan animals. Through this study, we identified numerically dominant groups in the study area as well as the possible existence of previously unknown organisms.
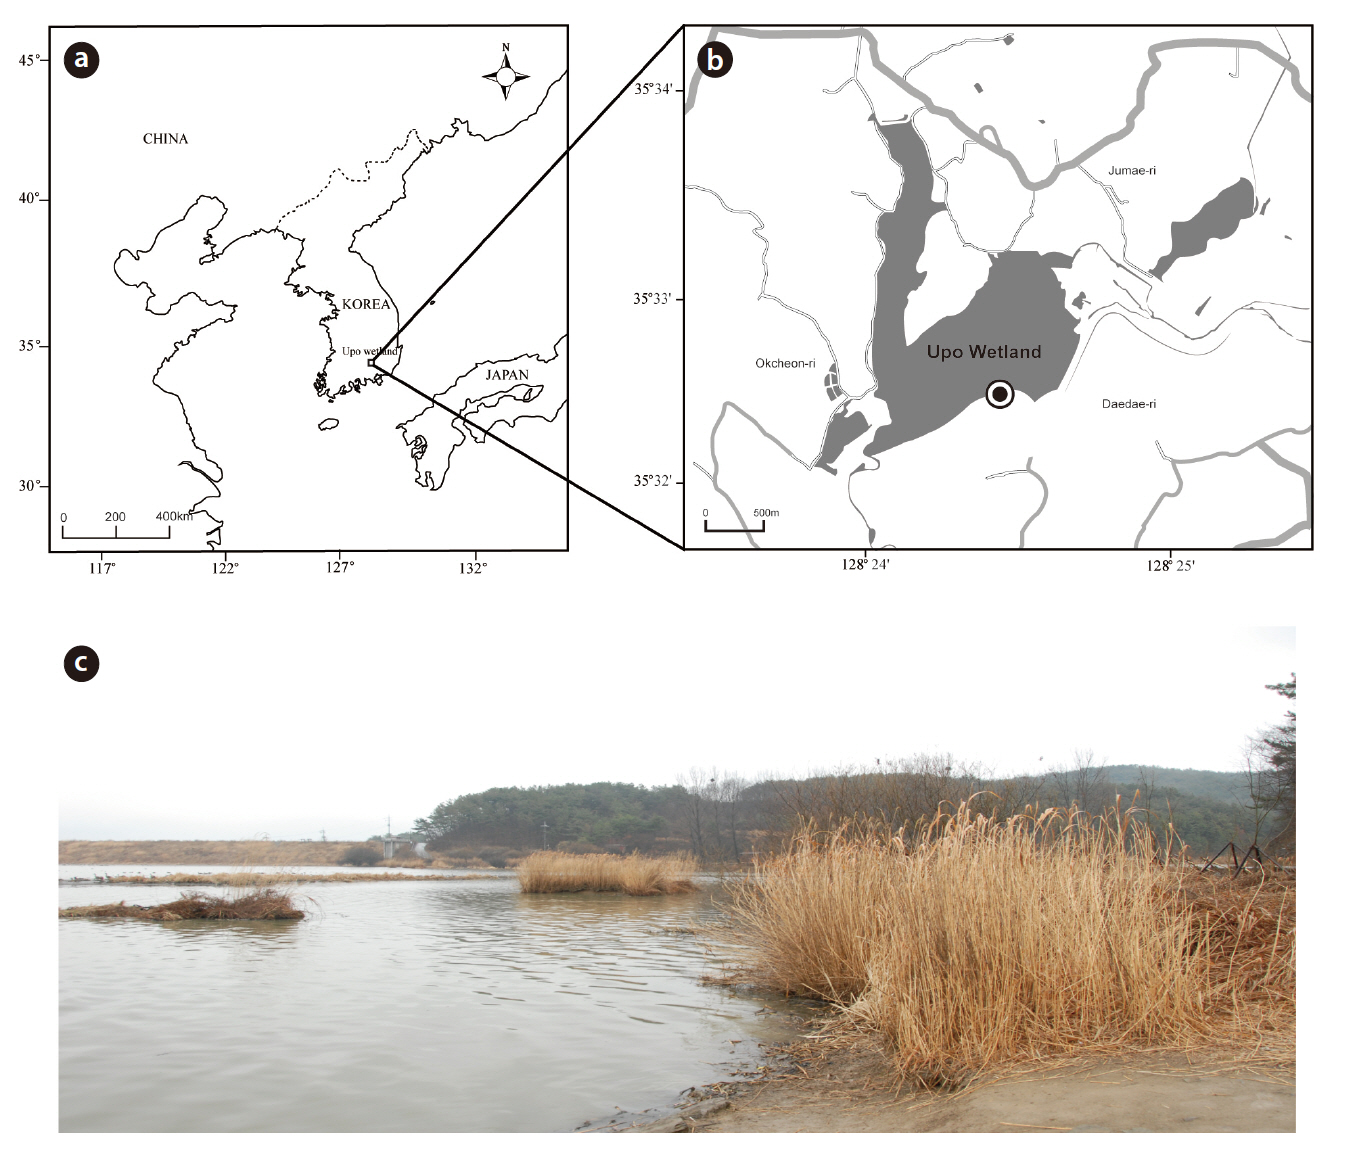
The Upo wetland is the largest natural lowland swamp in Korea and was formed from ground subsidence around 140 million years ago (Fig. 1). The Upo wetland was designated as an ecological conservation area by the Ministry of Environment in 1997 and registered as a Ramsar wetland. It has an average water depth of 1 m (Baek 1988) and has maintained an average temperature of 13°C for 30 years. The annual rainfall measures 1,233 mm and mainly occurs during the summer period (Kim et al. 2004). Water comes from the Topyeong stream but is directly influenced by a flood from the adjacent Nakdong River (Do et al. 2007). The biota of the Upo region has been investigated by several research groups who have focused on macro invertebrates, which are diverse aquatic plant and vertebrates (amphibian and fish). However, micro eukaryotes have been rarely studied, except for phytoplankton (Kim 2001, Bae et al. 2004, Nakdong River Basin Environmental Office 2006).
Soil samples were collected on 2 March in 2009 (35°32?49.51˝ N, 128°24?40.01˝ E) (Fig. 1). The collecting site was submerged under water, and it contained many suspended plant particles. Using a shovel at a depth of 10 cm near the water’s edge, around 2 kg of soil from the top layer, including the surface layer, suspended particles, and water, was collected into a plastic bag. The sample was transferred to the laboratory and kept fresh in an ice box. Three 50 mL aliquots of the soil samples were then placed into sterile Falcon tubes using sterile spatulas and stored at -70°C in a deep freezer before genomic DNA extraction.
>
DNA extraction and sequencing
Genomic DNA from each of the three aliquots was isolated using the PowerMax™ Soil DNA Isolation Kit (Mo Bio, West Carlsbad, CA, USA) according to the manufacturer’s instructions. PCR amplification was performed using a premix taq of Top-Taq™ PreMix (2×) (Takara, Tokyo, Japan) with 10 ng of genomic DNA and 0.2 μM primers in a final volume of 50 μL. The COI region was amplified with LCO1490 (5′-GGTCAACAAATCATAAAGATATTGG-3) and HCO2198 (5′-TAAACTTCAGGGTGACCAAAAAATCA-3) (Former et al. 1994), whereas the SSU rDNA region was amplified with EukA (5′-AACCTGGTTGATCCTGCCAGT-3) and EukB (5-TGATCCTTCTGCAGGTTCACCTAC-3) (Jeong et al. 2005). PCR were composed of the following steps: pre?denaturation (10 min at 94°C), 35 cycles of denaturation (1 min at 94°C), annealing for 2 min at 51°C for both COI and SSU rDNA, and extension (2 min at 72°C) and final extension for 7 min at 72°C using a Mastercycler (Eppendorf, Hamburg, Germany). PCR products were visualized on 1% agarose gel and purified with a Core-One™ PCR purification kit (CoreBio, Seoul, Korea). TA cloning was performed using the pGEM-T easy vector system (Promega, Madison, WI, USA) by Macrogen Inc. (Seoul, Korea). The forty eight clones for each marker were sequenced with forward
(SP6) and reverse (T7) primers using an ABI 3730XL SEQUENCER (Applied Biosystems, Foster City, CA, USA).
After sequence editing with SEQUENCHER ver. 4.8, sequence alignment was initially performed using Clustal X 1.81 (Thompson et al. 1997). To obtain species information for each operational taxonomic unit (OTU), BLAST search was performed using the blastn program against the NCBI database to retrieve the taxonomic classification of the best hit. In the case of low quality hits with query coverage < 90%, identity < 75% for COI and query coverage < 90%, identity < 87% for SSU rDNA, the sequences were discarded. As a neighbor-joining tree was constructed using MEGA ver. 4.0 from the aligned sequences and the sequences of the best hit (Saitou and Nei, 1987, Tamura et al. 2007), phylogeny groups for each sequence were assigned, referred from the taxonomic information of the best hits. The obtained OTUs were compared with the biota reports on the Upo wetland (Bae et al. 2004, Nakdong River Basin Environmental Office 2006), the list of animals in Korea (The Korean Society of Systematic Zoology 1997), and the check list of insects from Korea (The Entomological Society of Korea and Korean Society of Applied Entomology 1994).
Forty-seven and 44 sequences for COI and SSU rDNA, respectively, were identified. All obtained sequences were deposited in NCBI (GU070858-GU070938). The sizes of COI and SSU rDNA were about 700 and 1,700 base pairs (bp), respectively. After four COI and six SSU rDNA sequences were removed from the data matrix according to the cut-off, a total of 38 closest relatives in 20 genera (7 groups) were identified using blast search (Table 1). Interestingly, only five genera among the 22 total genera have been previously found in the Upo wetland.
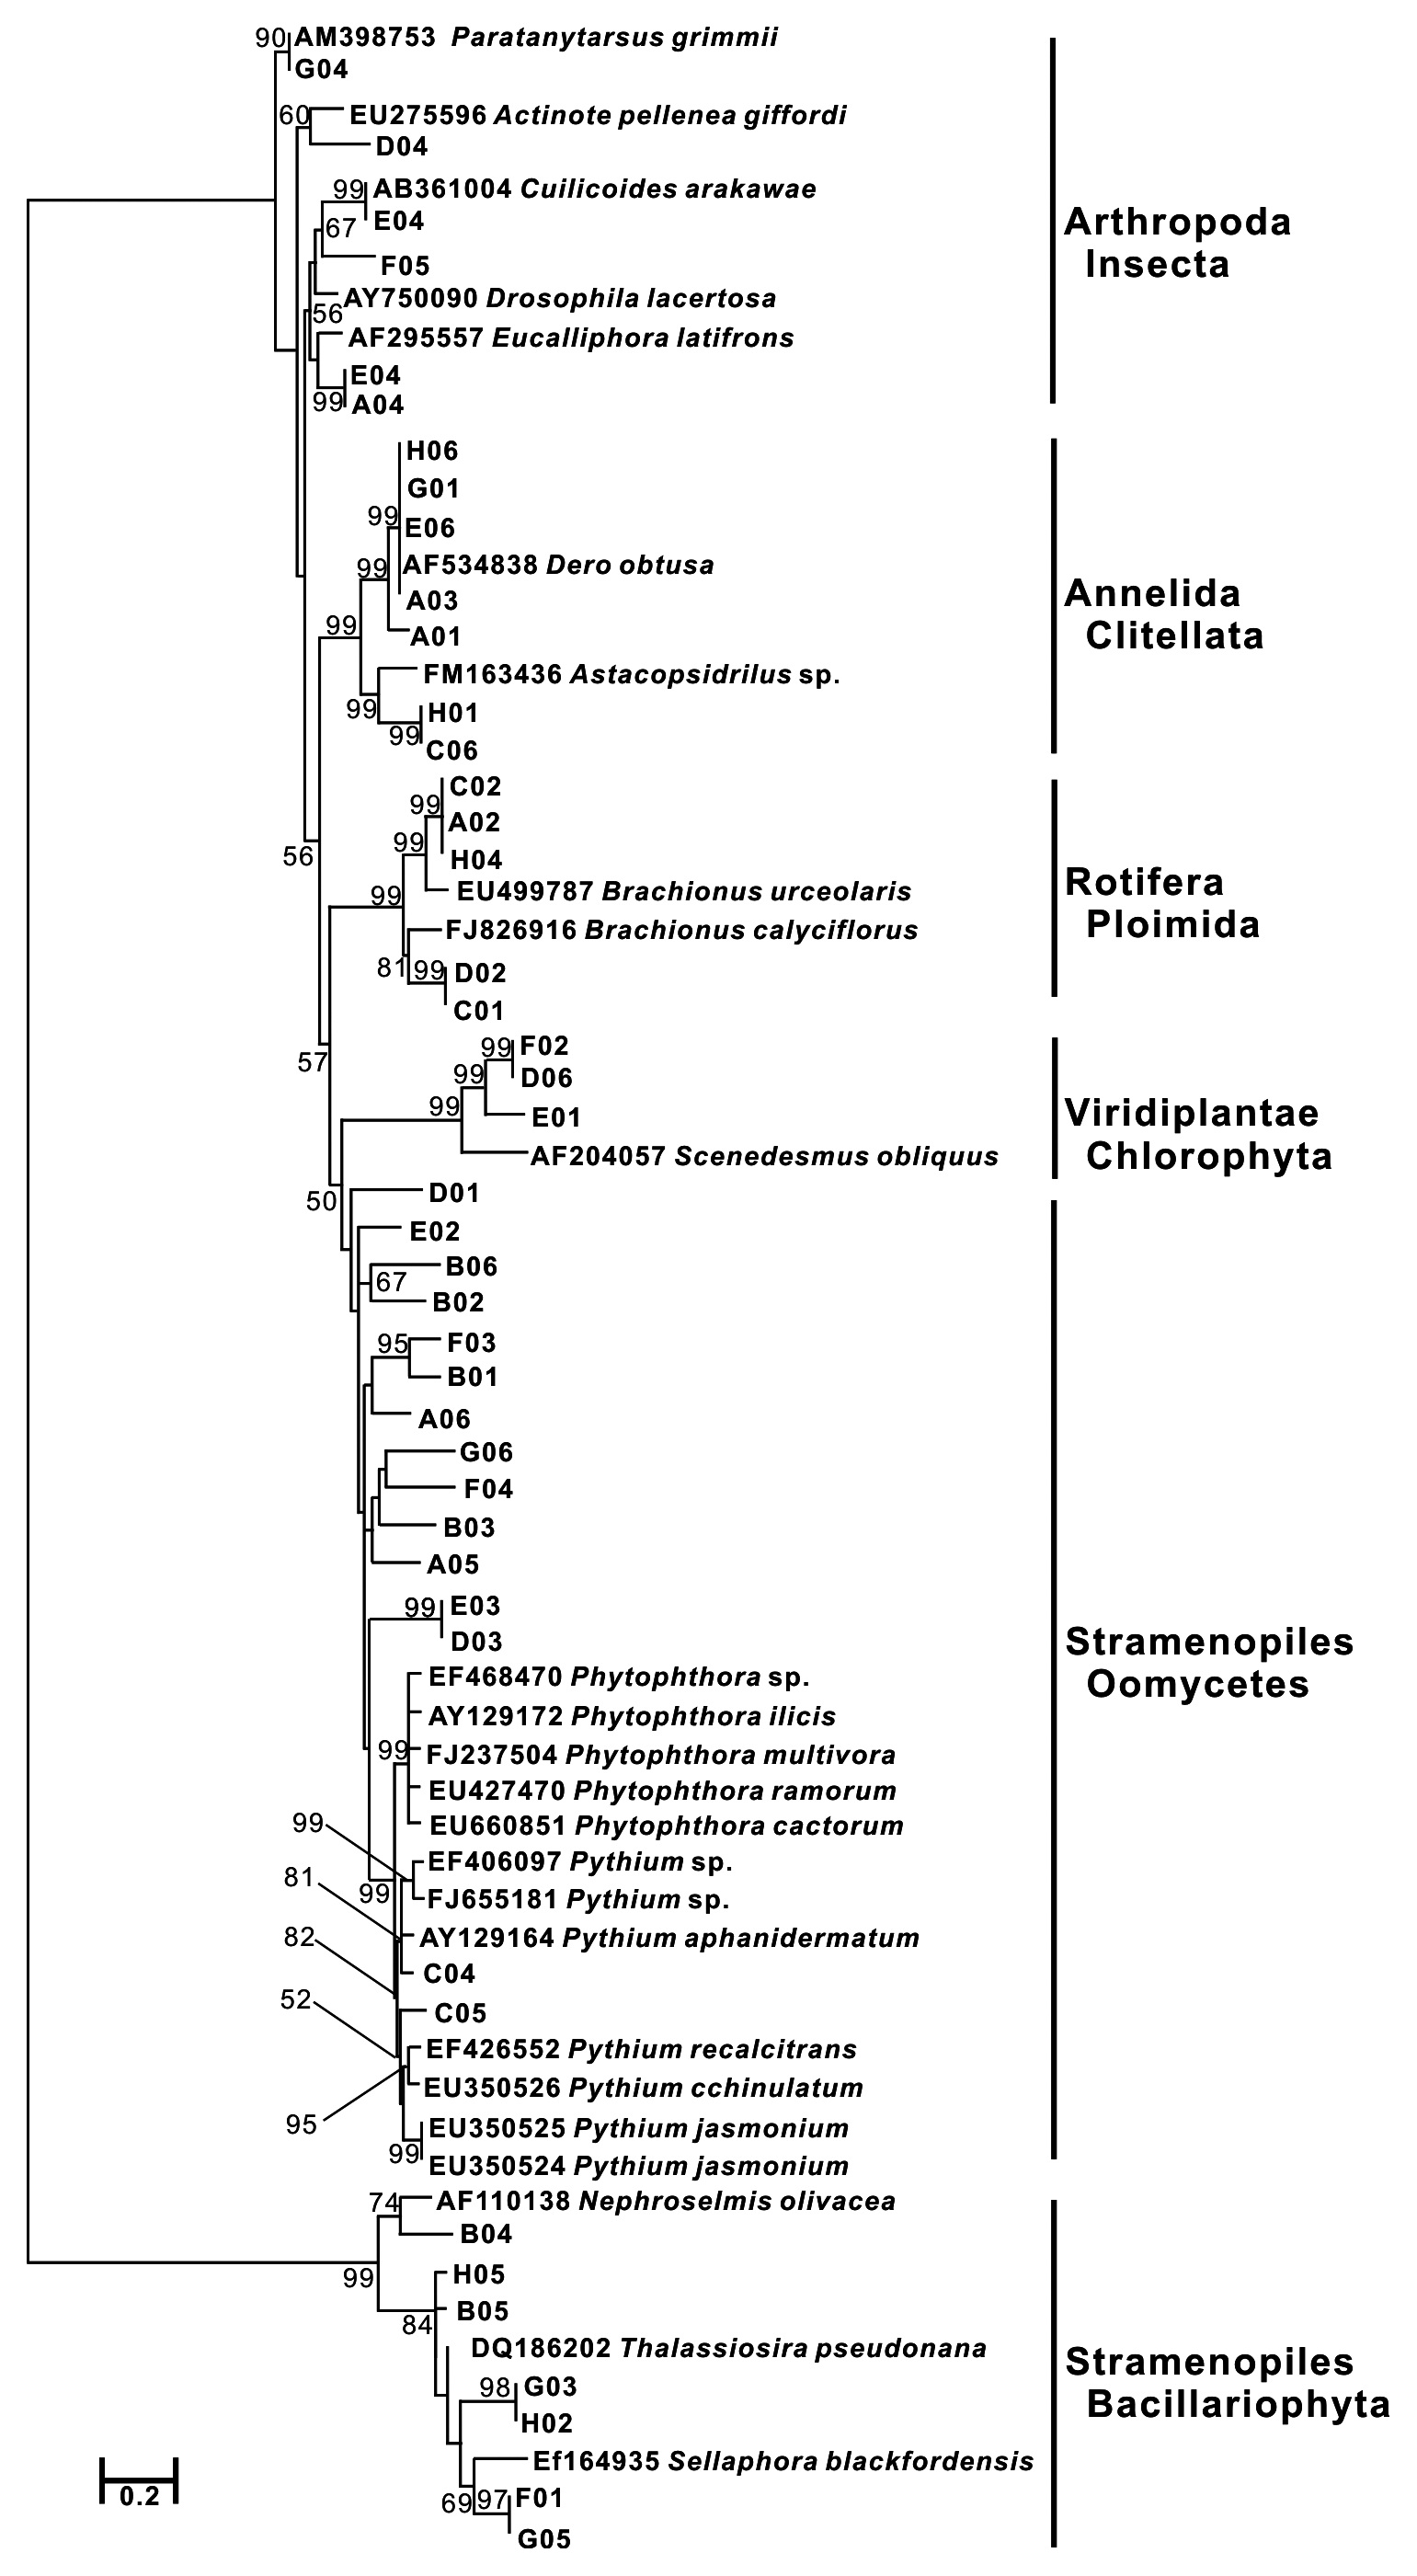
Forty-three COI sequences had high similarity with nine species in three animal phyla (Annelida, Arthropoda, and Rotifera), 11 species in a stramenopiles group, and two species in one green algae group (Viridiplantae: Chlorophyta). Especially, stramenopiles groups (Oomycetes and Bacillariophyta) were widely represented compared to the animal groups in the phylogenetic tree (Fig. 2a). Bacillariophyta (Diatom) is known to be common in freshwater systems. In the Upo wetland area, 36 diatom taxa have been previously reported (Nakdong River Basin Environmental Office 2006). The other Stamenopiles group is Oomycetes, known as water mold, and is usually pathogenic to plants. Since the Upo wetland is surrounded by a rice paddy and crop field and contains various wetland plants, it is not surprising that Oomycetes OTUs were dominantly amplified. However, the biodiversity of this group has not been investigated in the Upo wetland, and blast results did not show high similarity between obtained OTUs and their best hit sequences (below 90%) (Table 1), suggesting that further analysis is required to examine the distribution of oomycetes in Upo.
COI sequences from the genus
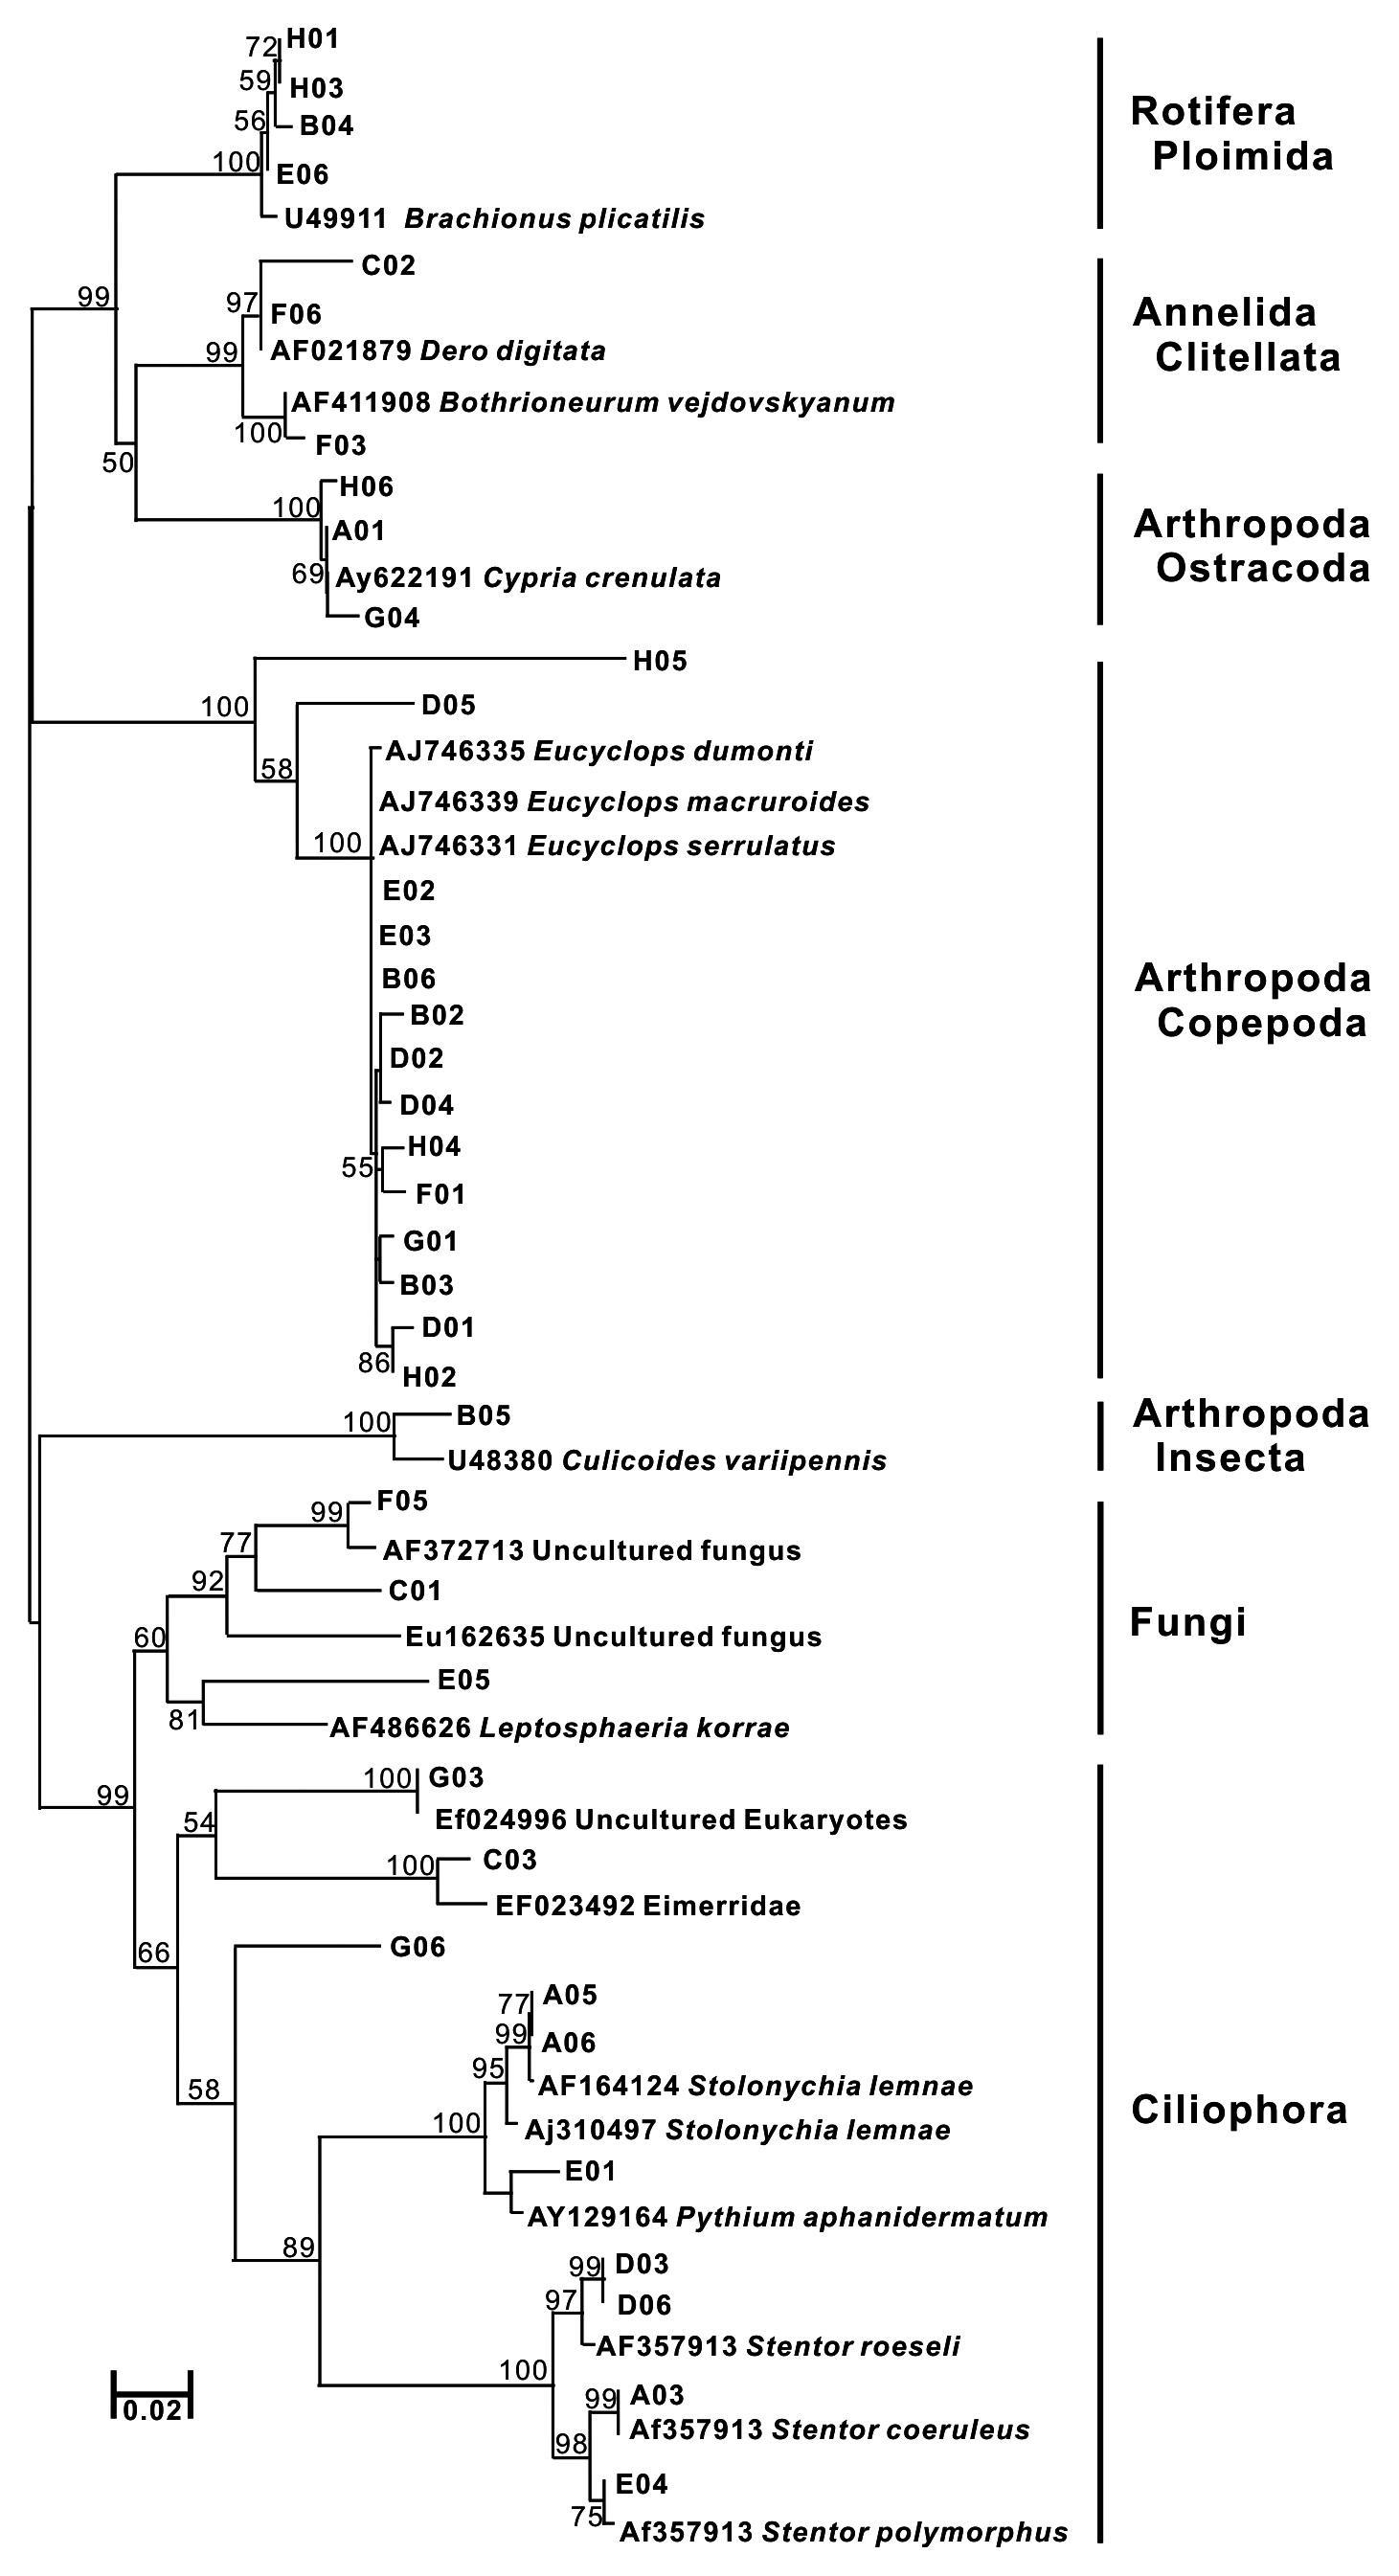
Thirty-eight SSU rDNA sequences were identified; eight from three animal phyla (Annelida, Arthropoda, and Rotifera), five species in Ciliophora, one Apicomplexa, one Ascomycota, and three unidentified eukaryote sequences. Using SSU rDNA primers, sequences closely related to Copepoda and Arthropoda were frequently obtained (37%) (Fig. 2b). Further, various genera of Ciliophora were obtained using SSU rDNA primers. In a molecular survey of the fresh-water system, Ciliophora were shown to be the dominant taxa using SSU rDNA primers (Behnke et al. 2006, Medlinger et al. 2010).
Biodiversity assessment is the first step to understanding the characteristics of ecosystems in a study area. However, a lack of experts and the difficulty of specimen isolation hinder the detection of small eukaryotes by biodiversity survey. Thus, we examined alternative molecular methods for screening biodiversity at a study site. In this study, we showed that approximately three fourths of all genera in the Upo area were previously unreported (Table 1), suggesting a large number of species that have been ignored in biodiversity screenings. Especially, COI sequences, which match genus
Hebert et al. (2003) reported the identification of COI sequences with a good resolution in seven major animal phyla: Platyhelminthes, Nematoda, Mollusca, Annelida, Echinodermata, Chordata, and Arthropod. Based on this, a huge number of COI sequences from animals were deposited to develop Barcode of Life Data Systems (BOLD, http://www.barcodinglife.org) as well as the NCBI genbank database. Our results also show that the COI region was applicable to the identification of organisms in the phyla Arthropoda and Annelida from environmental samples. However, COI alone could not contribute to the identification of all organisms due to a lack of sequence information in certain taxa and the absence of target genes in some eukaryotes (Scicluna et al. 2006). Protist groups like stramenopiles have been identified using ribosomal DNAs such as SSU rDNA and LSU rDNA rather than COI (Diez et al. 2001, Fell et al. 2006, Scicluna et al. 2006).
A total of 15 species including fungi groups were searched with 38 SSU rDNA sequences (Table 1). The same animal phyla as a COI tree have been identified, and alveolate groups, a major line of protest, were found in SSU rDNA sequences (Fig. 2). In the amplification using SSU rDNA primers, the Stamenopile and Viridiplantae groups were not identified. Although the genera
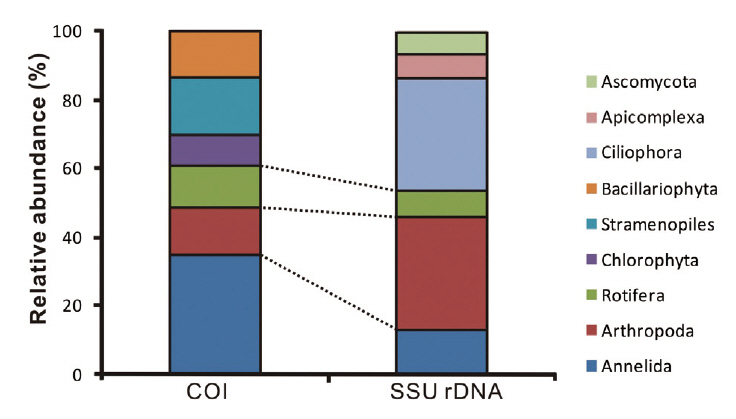
The animal phyla Annelida, Arthropoda, and Rotifera were identified at similar proportions with both markers, whereas Chlorophyta, Stamenopiles, Bacillariophyta were only amplified with COI marker and Ciliophora,
[Table 1.] List of taxa identified in this study compared with those reported in the Upo wetland
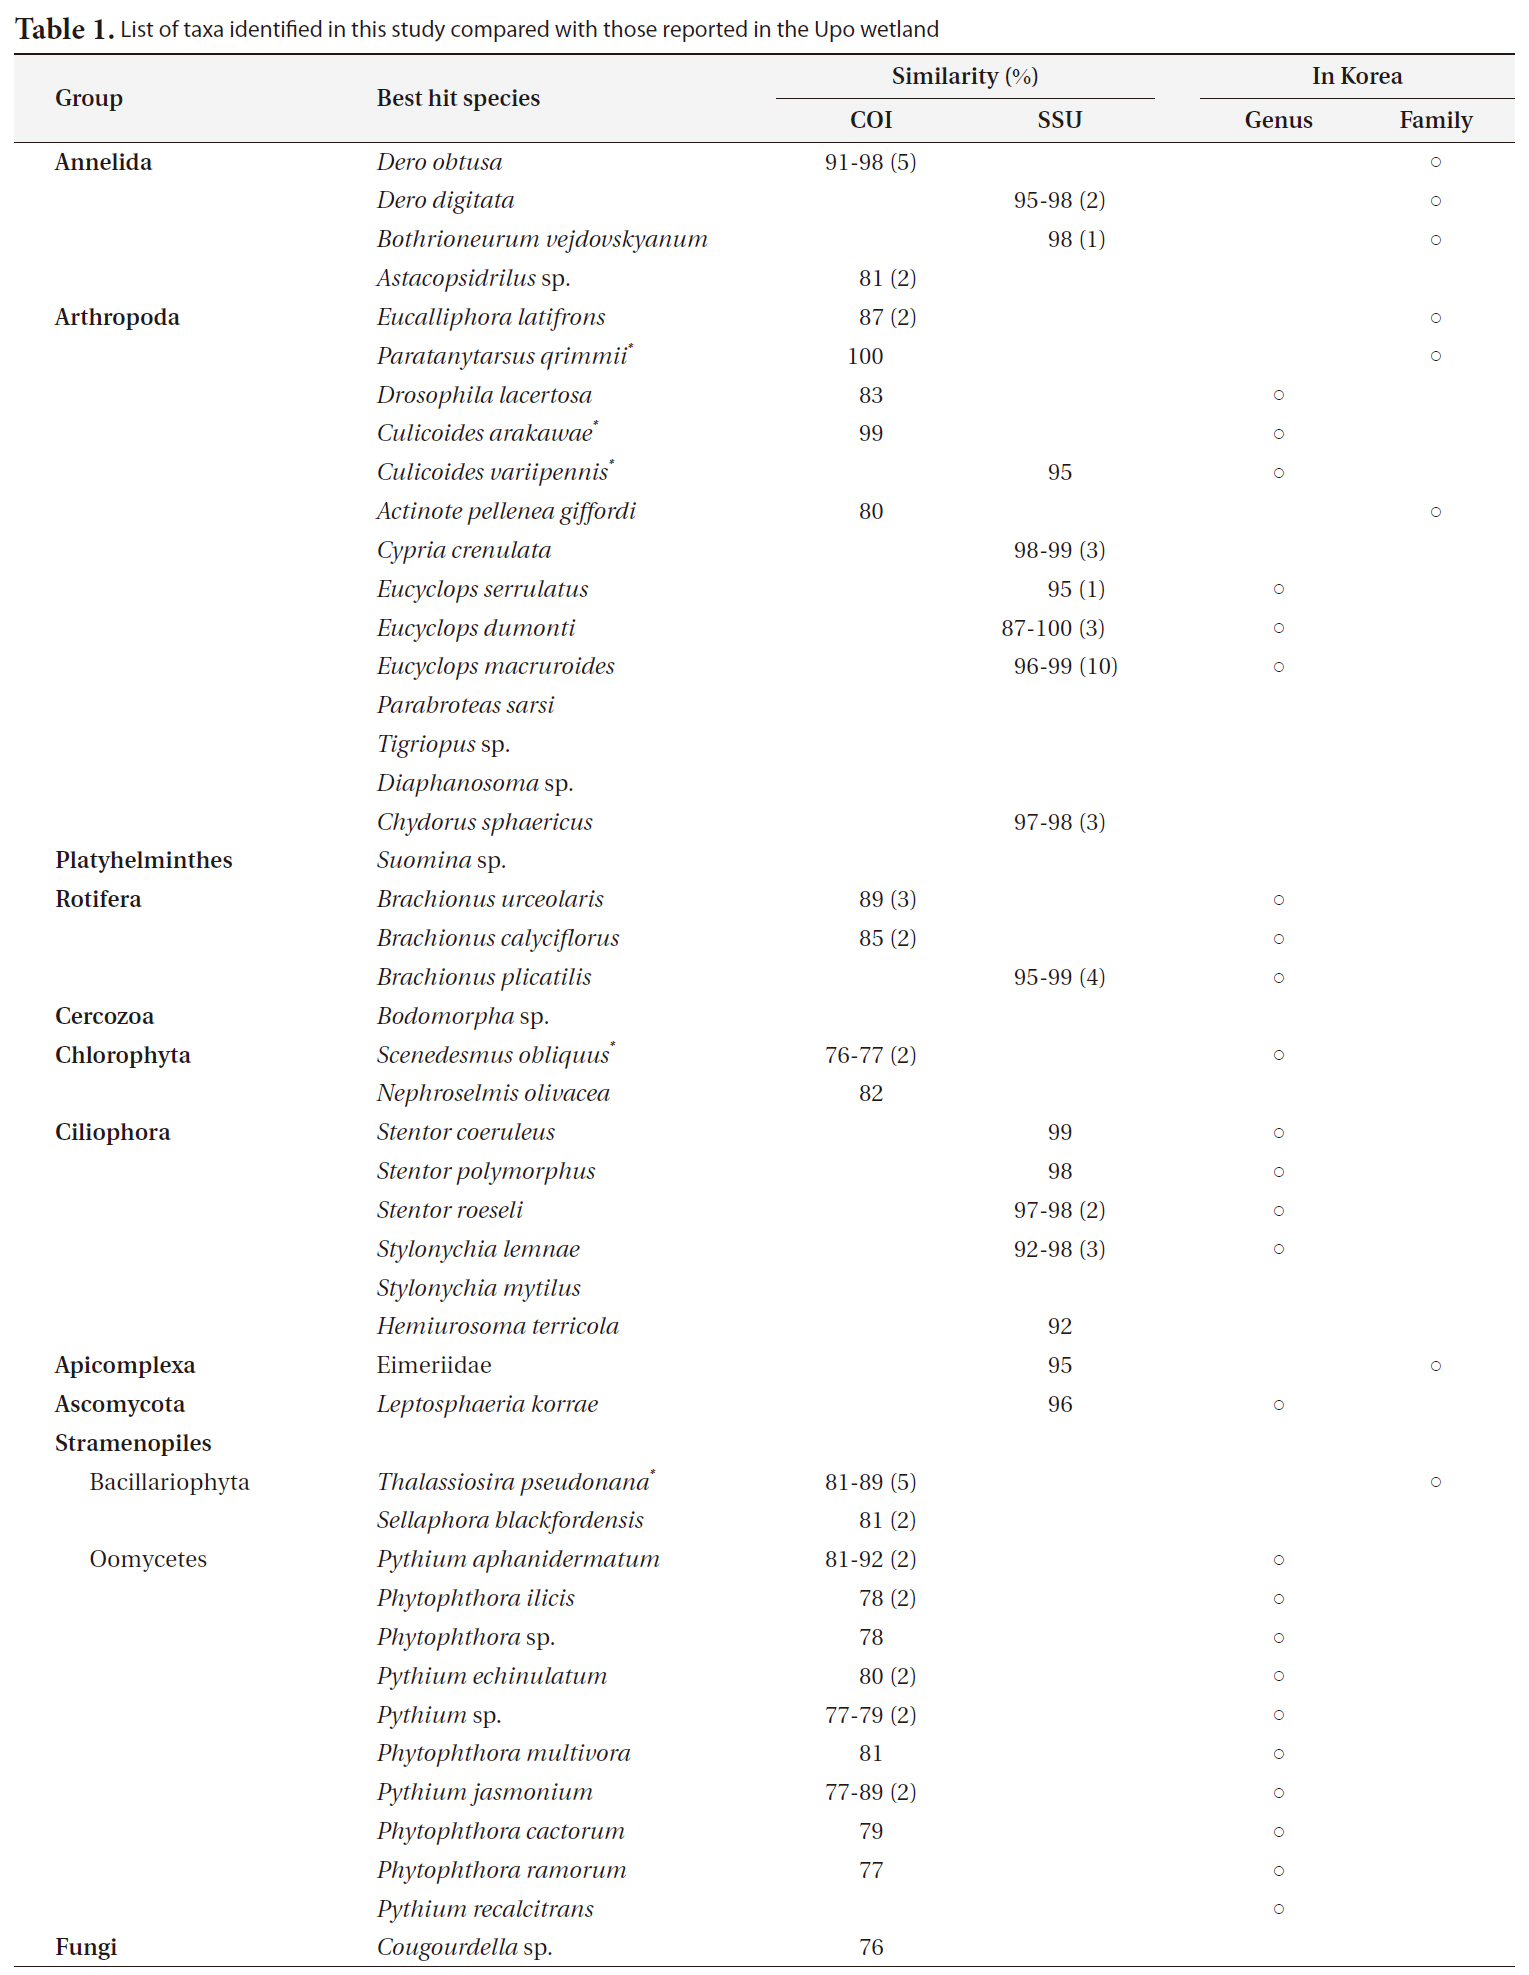
List of taxa identified in this study compared with those reported in the Upo wetland
Apicomplexa, Ascomycota with SSU rDNA marker (Fig. 3). However, we could not determine whether or not the proportions of obtained sequences reflect the number of species/taxa at the study site. Firstly, the total volume of genomic DNA varies according to the species since the number of cells can differ from single cell organisms such as protest to relatively larger multicellular organisms. Moreover, copies of especially ribosomal DNA vary among taxonomic groups. Thus, larger species with more cells and with higher copy numbers of genes would be more frequently detected compared to others (Potvin and Lovejoy 2009). Lastly, the number of final amplified sequence copies is dependent on PCR reaction efficiency, which is mainly affected by primer affinity. Unfortunately, there is no perfect primer to amplify specific target regions from eukaryotic taxa. This means that diversity may be easily underestimated. However, this molecular estimation method would be more efficient than traditional groups in terms of covering diverse taxonomic groups, since it is impossible to gather experts to cover all taxonomic groups in many cases.
This study therefore demonstrates the possibility of molecular barcoding systems to survey biodiversity in a specific environment, especially for identifying micro flora and fauna. To effectively apply this method for biodiversity surveying as well as biodiversity monitoring, the following questions should be considered. Firstly, amplified multiple sequences were separated by cloning steps before sequencing. However, due to the high expense of the cloning step, it would be somewhat difficult to represent all of the species of a region with a limited number of sequences. When performing a new DNA sequencing method such as pyrosequencing to compensate for these drawbacks, a quantitative approach based on the number of DNA sequences should be implemented (Valentini et al. 2008). Secondly, we totally depended on the Genbank database using the blastn program to identify species (GenBank, http://www.ncbi.nlm.nih.gov). Although more sequence data have been deposited in a public database, the quality of sequence data is not entirely reliable due to imperfections such as misidentification and taxonomic problems (Harris 2003, Valentini et al. 2008). Thus, it is important to complete the reliable reference database for DNA barcoding such as BOLD and the Ribosomal Database Project (RDP, http://rdp.cme.msu.edu). Moreover, if more gene regions such as internal transcribed spacer and large subunit ribosomal DNA are analyzed in parallel, more abundant and diverse species will be found.