Pigments are used in various industrial products such as paints, inks, rubbers, textiles, papers, fabrics, and cosmetics.The wastewater from the pigment industry contains various organic matters which are difficult to treat. This wastewater is almost insoluble in most solvents and non biodegradable [1, 2].The biologically treated effluent often fails to meet discharge regulations as it contains molecules of highly structured polymers[3, 4].
The use of an sequential batch reactor (SBR) is a relatively new technique when considering anaerobic?aerobic sequential treatment for colour removal [5]. The wastewater from the fibre and dye industries was treated using an SBR as a modified activated sludge process. The main advantages of this system are a low operating cost, high flexibility and the efficient use of space when compared to other systems [6]. Disadvantages of this system are high excess sludge production and a high sludge volume index [7, 8].
Decolourization of wastewater using ozone is more efficient than other advanced oxidation processes (AOPs) [9-12]. The AOPs using H2O2 and/or UV increase capital and operational costs. Although biological processes are effective in decolourization,in some cases they fail due to the presence of non-biodegradable organics [13, 14]. Ozonation is one of the most effective as well as most favoured treatment methods due to its high removal efficiency and its enhancement of the biodegradability of the wastewater [15-17].
The application of dissolved ozone flotation (DOF) and pressurized ozone oxidation (PO2) is an effective and economically viable technology for municipal and industrial wastewater treatment[18]. Ozone is an unstable gas with half life of around 30 min. The main limitation of the ozonation system is the low mass transfer rate from the gas phase to the liquid phase [19?22].The rate of ozone mass transfer depends on the mixing characteristics of the gas liquid contractor used, the kinetics of ozone decay in water and the number and size of the bubbles produced[23, 24]. The effectiveness of ozone as either an oxidant or a disinfectant can be increased by creating a higher surface area to volume ratio through the generation of smaller bubbles in DOF techniques [25, 26]. A number of different bubble generators are currently used in water and wastewater systems, including submersible orifices, sintered metal or glass plates, sprinklers and rubber membranes [23]. In combination with these bubble generation techniques, devices providing mechanical agitation are sometimes used to increase contact between the phases. Such devices include impellers and other types of mixers that provide kinetic energy to the bulk fluid. These devices waste a significant amount of energy through dissipation into the liquid and create undesirable back mixing conditions. As a result of the shortcomings of the bubble generation devices currently utilized, DOF techniques have been developed with a view to enhancing the mass transfer rate, increasing energy efficiency and creating more suitable mixing conditions.
The objectives of the present study were to investigate the process efficiency of an SBR alone or by combination with the DOF-PO2 process. After the SBR treatment, the effluent was further treated with DOF-PO2, elevating the water quality of the final effluent to meet safe effluent discharge criteria. Such a combined SBR and DOF-PO2 treatment was found to be highly efficient and may offer an attractive alternative in dealing with the high variability of pollutant content in the pigment wastewater.
The wastewater used in these experiments was taken from a pigment chemical company located in a nearby industrial complex in Ulsan Metropolitan City, South Korea. The process
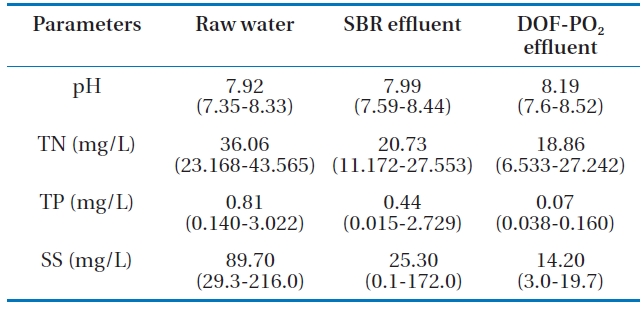
[Table 1.] Characteristics of pigment wastewater
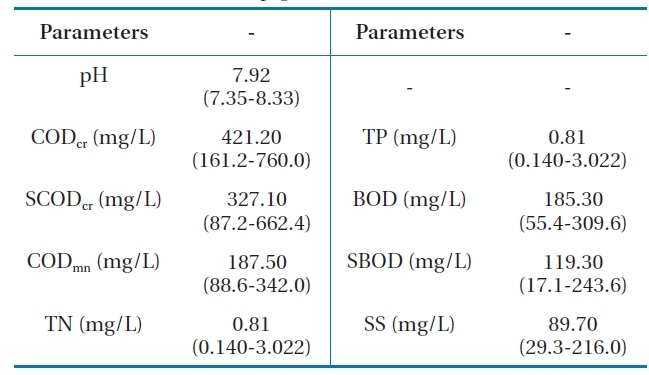
Characteristics of pigment wastewater
was manufacturing azo lake, azo insoluble, phthalo cyanine and synthetic pigments. All of the water quality parameters were measured according to procedures as described in the Standard Methods [27], pH and dissolved oxygen (DO) were measured with a digital meter (Model YK 2001PH; Mumbai, Taiwan). The characteristics (concentration range and average value) of the pigment wastewater used in this study are shown in Table 1.
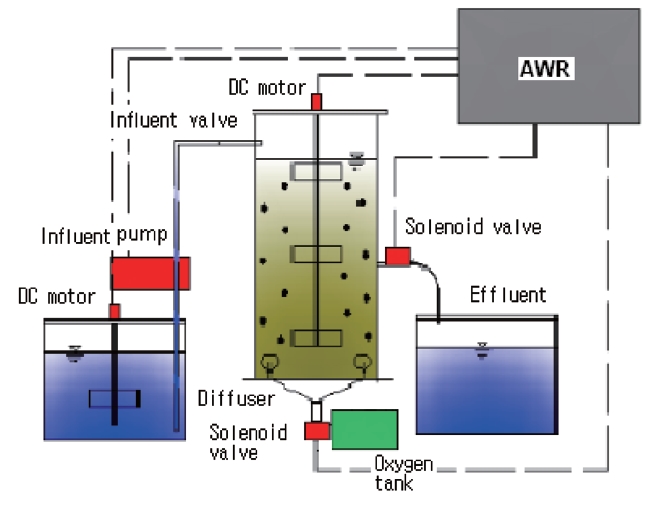
A 10 L batch reactor made from a transparent plate as shown in Fig. 1 was used in this study. The size of the reactor was 15 x 15 x 44 cm with an effective capacity of 8 L. Microbial sludge for seeding was taken from a nearby wastewater treatment plant,with an adjustment period of around 30 days being used. The reactor was run using a sludge retention time (SRT) of 30 days and a hydraulic retention time (HRT) of 6 hr. The MLSS and room temperature were maintained at 4,000-8,000 mg/L and 20 ± 2?C respectively.
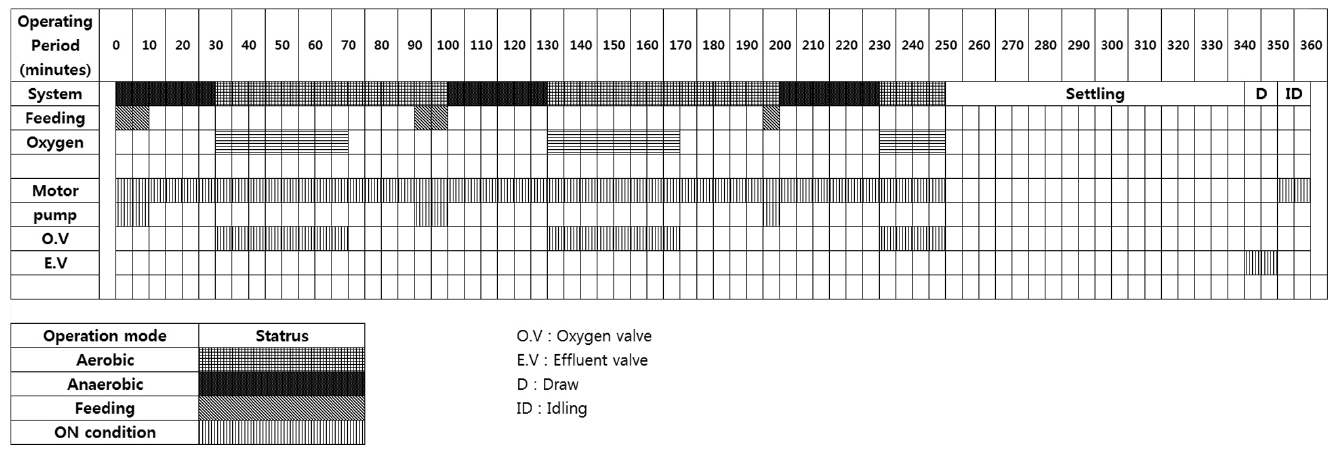
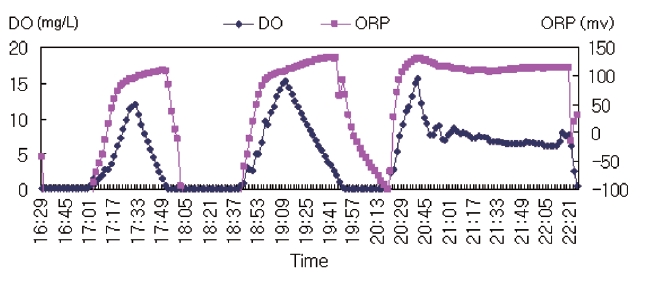
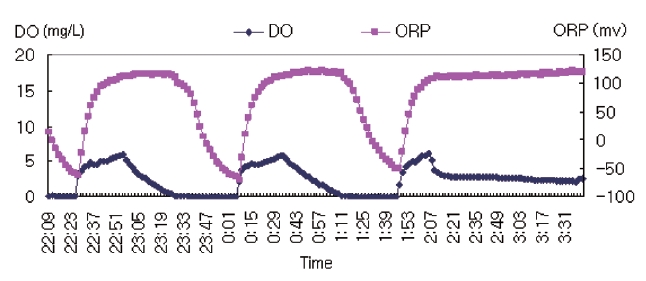
The system was run automatically by an AVR control panel which was programmed using the C programming language.Each process period was coded into the AVR control panel. To check the system condition, a DO meter and an oxidation and reduction potential (ORP) meter were used. A Code Vision AVR was used for the automatic control program. Each 6 hr cycle was broken into the following phases, Anaerobic phase 1 ? Oxic 1 ?Anoxic 1 ? Anaerobic 2 ? Oxic 2 ? Anoxic 2 ? Anaerobic 3 ? Oxic 3 ? Settle ? Draw ? Idle, this was then repeated. The system was run for 1 yr and its operation is presented in Fig. 2.
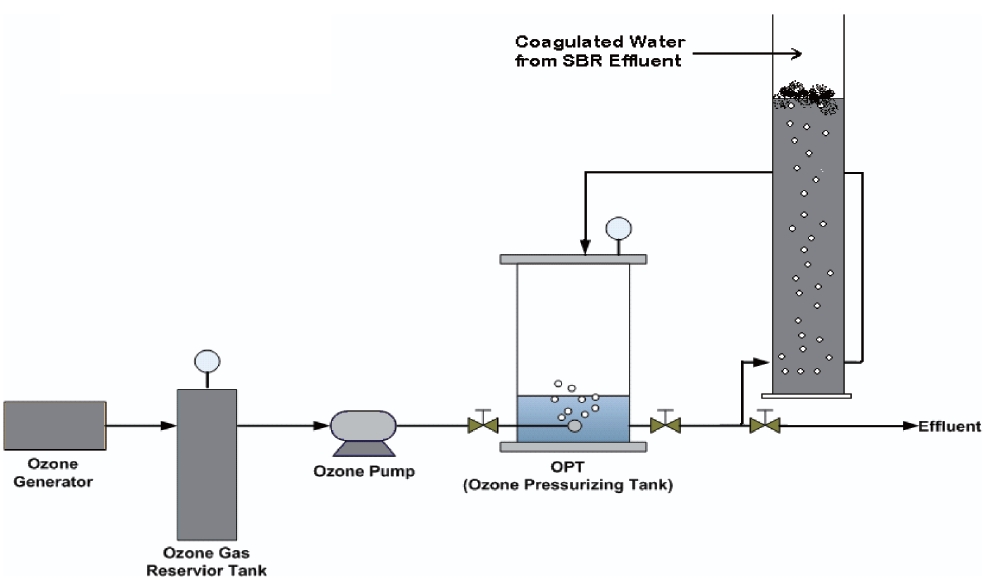
The system consists of an oxygen tank, an ozone generator,an ozone pump, an ozone dissolving tank and a flotation column.Coagulation and flocculation were created by a jar tester to apply the lab scale of the DOF-PO2 system. The ozone dissolving tank has an inner diameter of 10.7 cm and a height of 26.3 cm giving an effective capacity of 2.4 L. The ozone dissolving tank also has pressure gauge and relief valve on the top of the tank. Ozone was generated at a rate of 154.83 mg/min from the ozone generator (Ozonia, Duebendorf, Switzerland). The input and output ozone gas concentration was analyzed using the KI method [28]. This ozone gas was compressed into the dissolving tank (or ozone pressurizing tank) to obtain the required concentrations.Basic information about the ozone concentration is presented in Table 2. A schematic diagram of the DOF-PO2 system is shown in Fig. 3.
3.1. Effect of Oxygen and Air on the Removal of CODcr,BOD, and TN in the SBR Process
The removal efficiencies for the water quality parameters were compared for SBR systems which use either pure oxygen or air. It can be seen from Table 3 that the removal efficiencies of the major water quality parameters were similar for both methods,using pure oxygen or air. Even though the removal rates of BOD5 were over 90% in both systems, those of CODcr were under 50% because the pigment wastewater contains a high fraction of non-biodegradable organic material. To remove the CODcr
in the wastewater, further treatment processes are required.The TN concentration in the effluent from the SBR satisfied the discharge standard such that no further experiment proceeded regarding TN removal. TP was expected to be removed to a very low level in the DOF system such that no further investigation
[Table 2.] Supplied and dissolved ozone concentrations in a dissolvingtank with different pressures
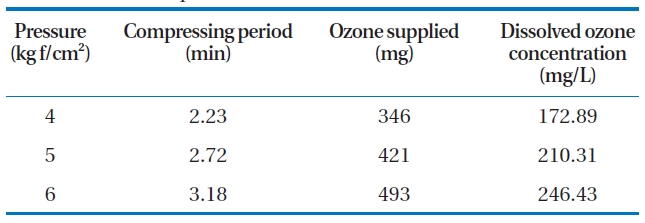
Supplied and dissolved ozone concentrations in a dissolvingtank with different pressures
has been performed regarding TP removal.
There is a large difference between the volumes of the two different gasses. During the experiment, the ORP of the biological system was maintained in a very close band in the 150~-100 mv range as shown in Figs. 4 and 5. In order to keep the ORP in such a close range it was required that four times the volume of air was used. When pure oxygen was used, the gas volume needed was 100 mL/min, whilst with air 400 mL/min was needed. This is similar to the partial pressure ratio of the two gasses in air. It may be observed from the figures that the oxygen concentration in the system increased and decreased sharply when pure oxygen was used, whilst changes of the oxygen concentration were slow when the air was used. The removal efficiencies of the major water quality parameters were not greatly enhanced even when the oxygen concentration was raised to around 15 mg/L using pure oxygen. Rather they may be affected by the ORP exerted on the biological system.
[Table 3.] Treatability comparison of pigment wastewater using pure oxygen and air in an SBR
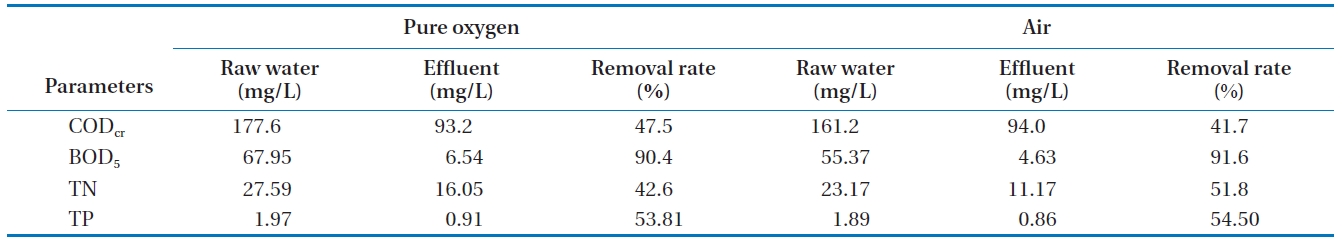
Treatability comparison of pigment wastewater using pure oxygen and air in an SBR
3.2. Removal of Major Water Quality Parameters Depending upon Recycle Rates in the DOF System
Even though pigment wastewater may be treated effectively through the use of an SBR, the quality of the SBR effluent could not meet the discharge standards, such that further treatment of the SBR effluent is required. In this investigation, DOF-PO2 technology was employed to achieve these standards.
Experiments were carried out with different ozone concentrations in order to obtain an optimum recycle rate. The concentration effects were also investigated for their impact on the removal of the water quality parameters.
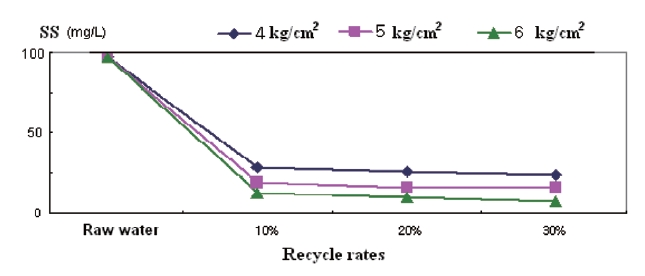
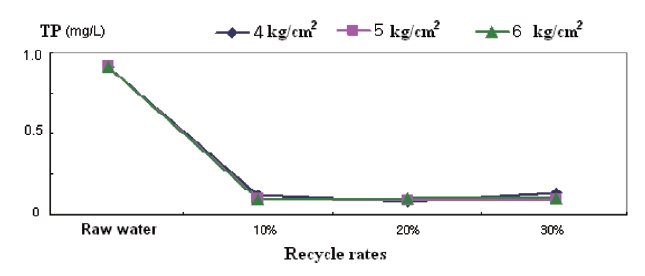
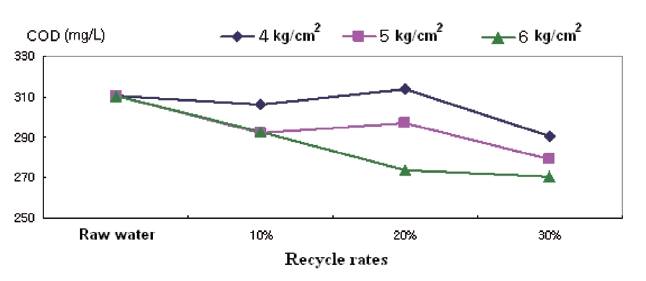
As shown in Fig. 6, the removal of CODcr was significantly affected by changing the recycle rate and it is assumed that an increased recycle rate increases ozone contact time. As illustrated in Fig. 7, the removal of SS was slightly enhanced as the increased recycle rate causes an increase in the bubble volume for floating SS. However, TP had already dropped to its lowest point at a recycle rate of 10% as shown in Fig. 8.
The pressure in the ozone dissolving tank also affects the removal efficiency of the water quality parameters. CODcr is the most affected by the pressure change as shown in Fig. 6. As the pressure increased in the dissolving tank, the dissolved ozone concentration also increased as can be seen in Table 2. The reduction rate of the CODcr increased as the pressure increased.This effect may be due to the fact that compressed water at a higher pressure provides a higher ozone concentration and a higher ozone gas volume in the contact column. The higher pressure in the contact column increases the chemical oxidation potential and the micro-bubble volume. SS removal was also slightly increased at a higher pressure, which may have been caused by an increase in the micro-bubble volume and enhanced coagulation during the contact period. TP was readily removed by coagulation and flotation rather than by the pressure or high recycle rate.
For the highest removal rates, the optimum recycle rate was decided to be 30%, with a pressure of 6 kg/cm2 being used during this experiment.
3.3. Removal of Water Quality Parameters by the Combined System of an SBR and DOF-PO2
The required water quality could not be obtained only
[Table 4.] Removal of water quality parameters during SBR and DOFPO2processes
Removal of water quality parameters during SBR and DOFPO2processes
through the use of biological methods. Thus, the following DOFPO2 process was employed. The treated water quality from the SBR and DOF-PO2 used in series is presented in Table 4 and Figs.9-11. Non-biodegradable pigment wastewater could be made to satisfy water quality standards for all parameters with a recycle rate of 30% and ozone concentration of 246.4 mg/L. This high ozone concentration was contacted instantaneously using a pressure of 6 kg/cm2.
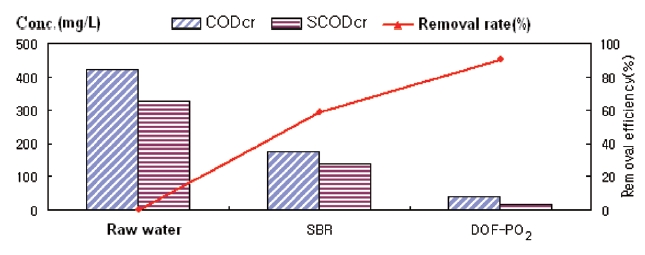
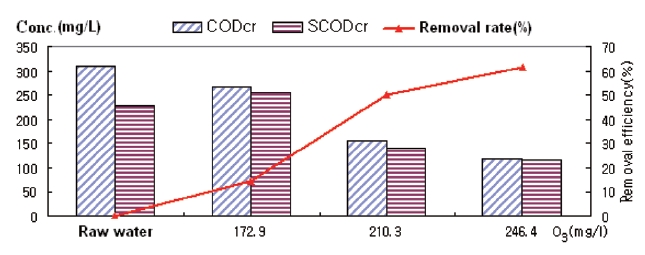
The pigment wastewater could not be treated to the extent required by either an SBR or ozone oxidation with the given concentration. Raw water was put into contact with various concentrations of ozone in high pressure environments, with the results presented in Fig. 9. The dissolved CODcr (SCODcr) was increased through contact with 173 mg/L of ozone while CODcr decreased. Analysis shows that the ozone degraded the high molecular weight parts of CODcr into lower molecular weights of CODcr, which is SCODcr. Through the increase of the ozone dose into even higher concentrations, total CODcr (CODcr and SCODcr)was decreased further, which indicate that part of the organic material was oxidized completely into water and carbon dioxide.However, CODcr was over 100 mg/L in the effluent, which does not satisfy water quality standards. It was found that even though ozone is effective in removing CODcr, it is not efficient by itself when only the SBR process was employed.
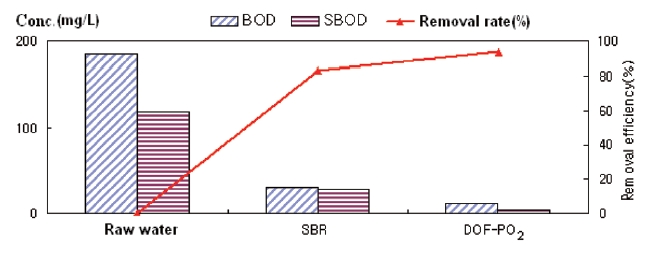
The average CODcr of pigment wastewater could be lowered down to 174 mg/L from 421 mg/L in the raw water by the SBR process as shown in Fig. 10. This concentration could be further lowered to 41 mg/L through ozone contacting in the DOF-PO2 process. The overall removal rate was over 90%. The BOD of 185.3 mg/L in the pigment wastewater could be lowered to 31.5 mg/L by the SBR process. This effluent of the SBR process was further lowered to a BOD of 12.2 mg/L, which satisfies the water quality standard of 20.0 mg/L (Fig. 11). It can be seen from Table 4 that the removal of other water quality parameters such as TN,TP, and SS were reduced to 18.86 mg/L from 36.06 mg/L, 0.074 mg/L from 0.81 mg/L and 14.2 mg/L from 89.7 mg/L, respectively by a combined process of the SBR and DOF-PO2.
It was found that SBR and DOF-PO2 processes in series were effective technologies to treat pigment wastewater, which is a highly non-biodegradable wastewater.
Pigment wastewater contains highly non-biodegradable organic material which is not removed well by conventional treatment technology such as activated sludge treatment. To discharge the effluent of pigment wastewater into the environment directly, the SBR and DOF-PO2 technologies were employed.Neither the SBR nor DOF-PO2 process alone could make the effluent water quality satisfy the discharge standards. The SBR and DOF-PO2 processes in series could produce pigment wastewater of a suitable quality for discharge into the environment directly.
Use of the SBR process and ozone contact by the DOF-PO2 system could treat the pigment wastewater as follows: 421 mg/L of CODcr could be lowered down to 41 mg/L by the SBR and DOFPO2 processes. Other water quality parameters such as BOD, TN,TP, and SS could also be removed down to 12.2 mg/L from 185.3 mg/L, 18.86 mg/L from 36.06 mg/L, 0.07 mg/L from 0.81 mg/L and 14.2 mg/L from 89.7 mg/L, respectively, all of which satisfy water quality standards.
The removal rate of TN might be enhanced by adjusting the retention period of anaerobic, oxic and aeration time. However,because the main target parameters were COD and BOD in this investigation, further experimentation has not been conducted to enhance the nitrogen removal.


![Removals rates of CODcr and SCODcr by the sequential batchreactor (SBR) and ozone (dissolved ozone flotation-pressurizedozone oxidation treatement [DOF-PO2]) in series from pigmentwastewater.](http://oak.go.kr/repository/journal/10602/E1HGBK_2011_v16n2_97_f010.jpg)
![Removals rates of BOD and SBOD by the sequential batchreactor (SBR) and ozone (dissolved ozone flotation-pressurizedozone oxidation treatement [DOF-PO2]) in series from pigmentwastewater.](http://oak.go.kr/repository/journal/10602/E1HGBK_2011_v16n2_97_f011.jpg)