Unsteady flow around aircraft, vehicles or vessels results in performance degradation and instability. Studying the flow around a blunt object serves as a basis for better understanding actual flow phenomena around the real transportation. In particular, aero-acoustic noise created by high speed vehicles presents challenges among engineering disciplines, giving rise to research fervor on this issue. Many different types of flow exist, such as boundary layer flow,flow separation, laminar and turbulent flow, vortex and vortex shedding; such flow is especially observed around circular cylinders. Flow characteristics can be analyzed according to the Reynolds number (Dalton, 2000). The wake flow generated around the circular cylinder develops a symmetrical steady state flow at the upper and lower sides of the object at very low Reynolds numbers, and creates a two-dimensional Karman vortex from the critical Reynolds number (Re?47) until the Reynolds number increases to Re=190. When the Reynolds number becomes greater than 190, the wake flow generated around the circular cylinder becomes a three-dimensional flow structure.
Williamson (1988, 1992, 1996a, b) experimentally demonstrated that the discontinuity characteristics of the Strouhal number according to the Reynolds number appears when the Reynolds number is within a range of 180 to 260. The discontinuity is a three-dimensional transition process experienced by the wake flow. A-mode instability appears in the three-dimensional vortex structure when the wake’s Reynolds number is within the range of 180 to 230. The main characteristic of A-mode flow is that the spanwise wavelength of the secondary vortex forms four times larger than the cylinder diameter. At or above Re=230~260, the wavelength of the secondary vortex forms almost the same size as the cylinder diameter, which is known as B-mode instability.The Strouhal number variation according to the Reynolds number during the A-mode significantly differs from that of the B-mode. The Strouhal number increases when the two-dimensional flow structure changes to the A-mode as the Reynolds number increases. During the B-mode, the Strouhal number sharply and discontinuously decreases then increases as the Reynolds number increases.
Zhang et al. (1995) and Thompson et al. (1996) conducted numerical analyses for the three-dimensional transition range. Furthermore, Persillon and Braza (1998) and Labbe and Wilson (2007) numerically verified that the A-mode,B-mode and the vortex transition exist, phenomena which were previously discovered by Williamson (1992). Norberg(2003) studied the relationships between the Reynolds number and the Strouhal number as well as between the critical Reynolds number and the spanwise wavelength.However, the aforementioned studies exhibit several inconsistencies between the experiments and numerical analyses in regards to the exact generation mechanism of each mode, and the lift and drag variation according to the Reynolds number.
In this paper, the three-dimensional unsteady compressible reynolds-averaged navier-stokes (RANS) equation was used as the governing equation. A numerical analysis was conducted using an optimized high-order compact (OHOC)scheme (Kim and Lee, 1996) and a 4th-order Runge-Kutta Scheme for space and time discritization, respectively.In order to diminish the nonlinear discontinuity causing the numerical instability, adaptive nonlinear artificial dissipation (ANAD) was used as an artificial diminution model, suggested by Kim and Lee (2000) for two dimensional acoustic analyses. The boundary conditions that were applied were the freestream of the velocity and the extrapolation of the pressure in order to suppress the acoustic reflection as inlet boundary condition, and the extrapolation of the velocity and freestream of the pressure as outlet boundary condition. In order to suppress the reflection wave from the boundary surface, a wide numerical zone was set and a coarse grid was used for the numerical dissipation effect at the far field area. For high resolution numerical calculation requiring a great amount of computation time as well as a large memory, a parallel processing method known as the OpenMP method was used.
For the range of Reynolds numbers within which the three-dimensional B-mode instability of the circular cylinder wake flow appears, a numerical analysis was conducted for spanwise lengths of π
2. Governing Equation and Numerical Method
The non-dimensional unsteady compressible RANS equation is written as follows:
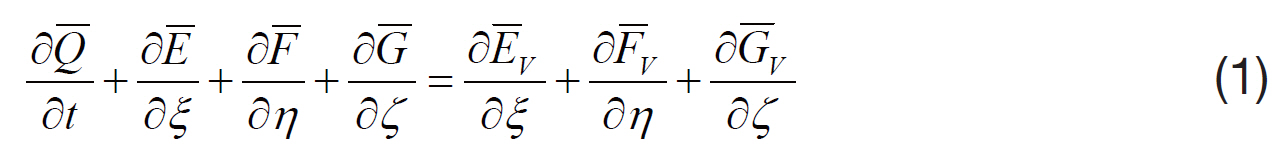
where

is non-dimensional conservative flux vector


are inviscid flux vectors and
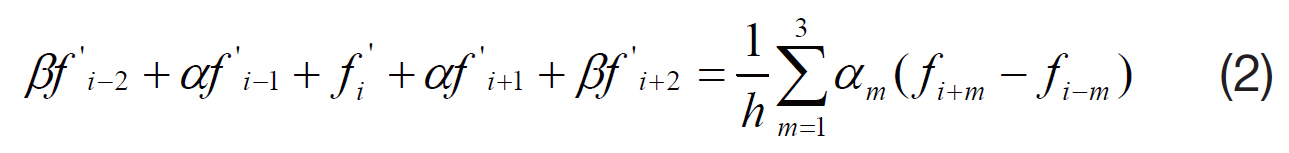
are viscid flux vectors for each direction. As a space discretization, the OHOC scheme, employed by Kim and Lee (1996) for two dimensional flows. The OHOC scheme uses 7 node points with the exception of the boundary nodes and the neighboring nodes of the boundary, as shown in Eq.(2). The coefficients of Eq. (2) were referred to Kim and Lee(1996). For the boundary nodes and the Boundary's neighboring nodes, the optimum coefficients were determined indicating that the scheme is fourth order except for the second order of the boundary nodes.
For time discretization, an explicit 4th order Runge-Kutta method was used to maintain a high order and high resolution (Hoffmann and Chiang, 1993). The OHOC scheme provides very high resolution for the space but has a central differentiation feature; thus, it is not able to precisely
describe the propagation characteristics of the wave,producing diffusion errors that significantly affect numerical stability. In order to suppress these errors and instability,the ANAD model, suggested by Kim and Lee (2000), was applied to three-dimensional flow. However, the amount of artificial dissipation must be determined through numerical experimentation in order to control the numerical stability.
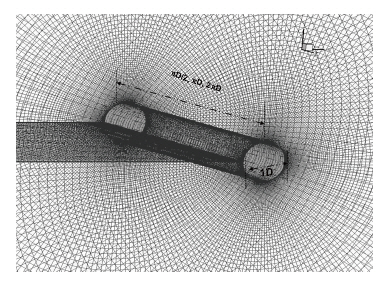
An O-type grid system was used, as shown in Fig. 1. The computational range in the radial direction was extended to 400 times the diameter
In most compressible flow studies, the reflection wave at the boundary is suppressed using non-reflection characteristic conditions. However, even with the use of a non-reflection condition, the wave reflection is not sufficiently suppressed in when employing a high resolution method. Thus, a wide area near the boundary can be established as a buffer zone to suppress the wave reflection by the numerical dissipation.Rather than using non-reflection characteristic conditions,this paper applies simple boundary conditions with coarse grids corresponding to a buffer zone that suppresses the wave reflection by numerical dissipation. The freestream condition of the pressure and convective boundary conditions were used at the outlet, and the freestream condition and the extrapolation of the pressure were used as the inlet condition.A periodic condition was used for the axial direction of the cylinder. Three-dimensional computation using a high order scheme requires a huge grid system and a great amount of computational time. Thus, a parallelized code was found to be more effective. Because the differentiation for the flow variables was implicitly obtained, the MPI method was and inefficient means of data communication. An OpenMp method, which is a shared memory programming model based on the thread, was used because of its ability to reduce the communication traffics among the nodes.
The Strouhal number indicates vortex shedding characteristics. The Strouhal numbers obtained during this study were compared to that of previous studies. The Strouhal number (
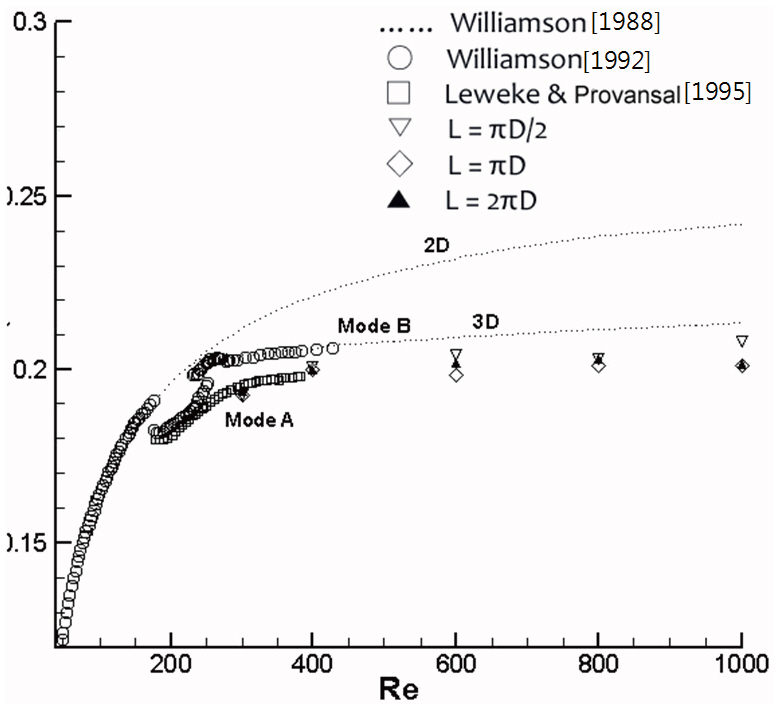
Reynolds number and the spanwise length variation were compared to experimental results acquired by Williamson(1988). In Williamson’s study, a three dimensional B-mode instability appeared when the Reynolds number was within a range of 180 to 260. The Strouhal number changed discontinuously from the range of A-mode Reynolds numbers to the B-mode range. However, experimental results obtained by Leweke and Provalsal (1995) indicate that the Strouhal number increases continuously. Subsequent research established that the divergence between the experimental results obtained by Williamson (1988) and Leweke and Provalsal (1995) was a result of differing boundary conditions on the wall. Figure 2 illustrates a comparison between our results and the results obtained in previous studies. Our results were 96% consistent with Williamson’s results over an entire range, and 99% consistent with the results obtained by Leweke and Provalsal (1995) in which Re=300 and with a spanwise length of 2π
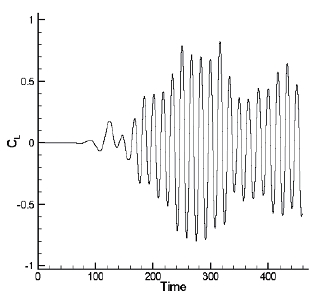
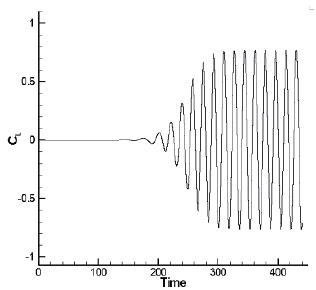
3.2 Lift and drag coefficients
Figure 3(a) shows that the lift coefficient maintained a constant amplitude at Re=300 and
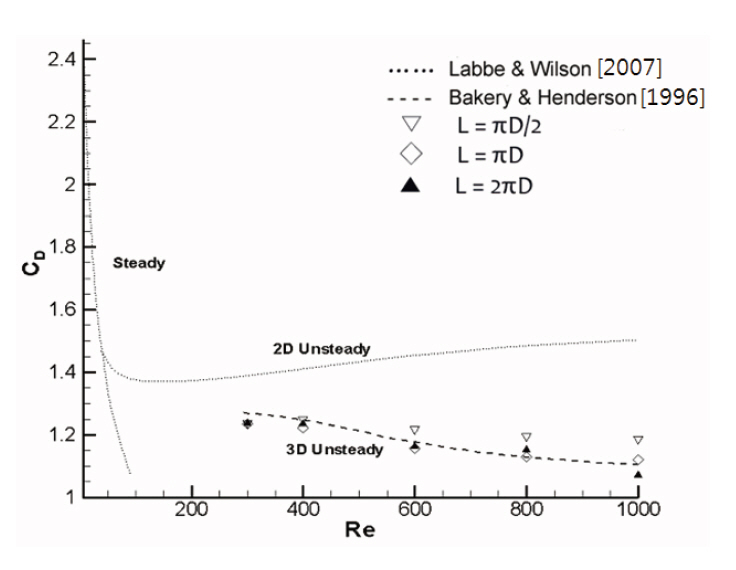
number increases, and the reducing rate of the CD becomes smaller after Re=600. As the spanwise length increases the drag coefficients become more consistent with the results of Labbe and Wilson (2007).
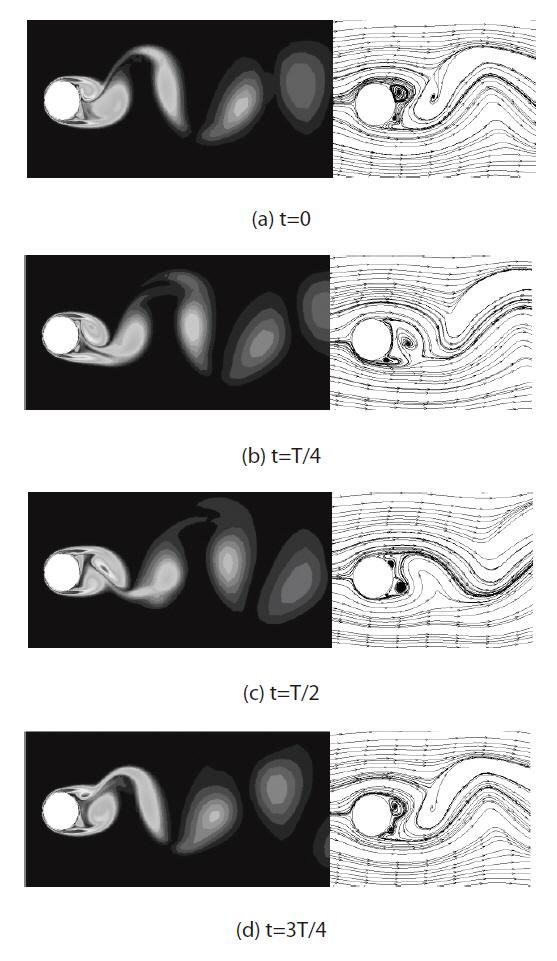
Figure 5 shows iso-voticity contours and streamlines at the center cross section of the z-axis, indicating physical phenomenon around the circular cylinder such as the generating process of the vortex shedding and the downstream movement. The sampling was conducted 4 times within a period of the lift fluctuation. Two vortexes were produced within a period of the fluctuation. When time was zero, a strong vortex was generated on the wall of the circular cylinder in the upper zone and the leading edge of the vortex moved toward the lower zone. The lift coefficient at this point was zero and the drag coefficient reduced to its
minimum. When time was equivalent to T/4, the leading edge of the vortex generated in the upper zone moved toward the lower zone and the vortex formed a circular shape.Additionally, another vortex started to form. At this stage,the lift and drag coefficient increased to maximum values.When the time was equivalent to T/2, as shown in Fig. 5(c),the leading edge of the vortex generated in the upper zone started to separate from the cylinder and another vortex started to develop in the lower zone. During this stage, the lift coefficient gradually reduced to a minimum and the drag coefficient increased to its maximum. When the time was equivalent to 3T/4, indicated in Fig. 5(d), the velocity of the leading edge of the first vortex generated in the upper zone slowed down and the vortex developed into an oval shape.The vortex that developed in the lower zone moved toward the upper zone and formed a circular shape. At this moment,the lift coefficient gradually reduced to its minimum and the drag coefficient increased to its maximum.
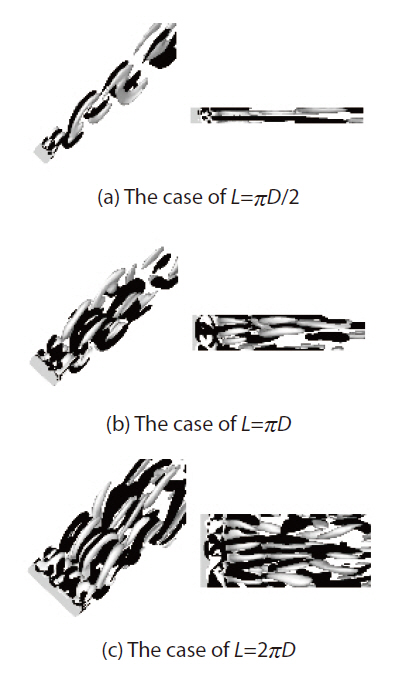
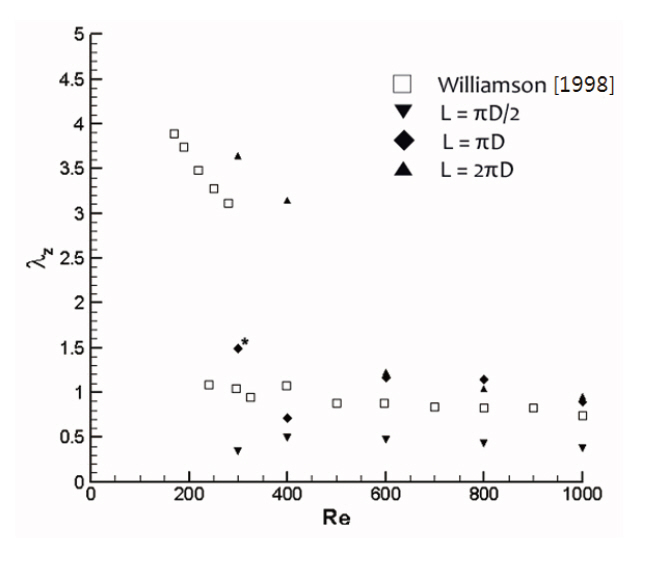
The secondary vortex feature was analyzed within the B-mode range of the Reynolds number, facilitating our comprehension of the instability observed during threedimensional flow around a circular cylinder. We reviewed the influence of the spanwise length of the cylinder to the feature and compared the secondary vortex wave length(λZ) to results obtained by Williamson and Brown (1998).Williamson and Brown showed that the secondary vortex structure generated at the rear surface of the cylinder changed according to the Reynolds number and the spanwise length,the secondary vortices of ωx exist at the B-mode range of Re=200~1,200 at which the three-dimensional instability of the vortex structure are observed, and the wave length (λZ) of the secondary vortex remained the same size as the diameter of the cylinder.
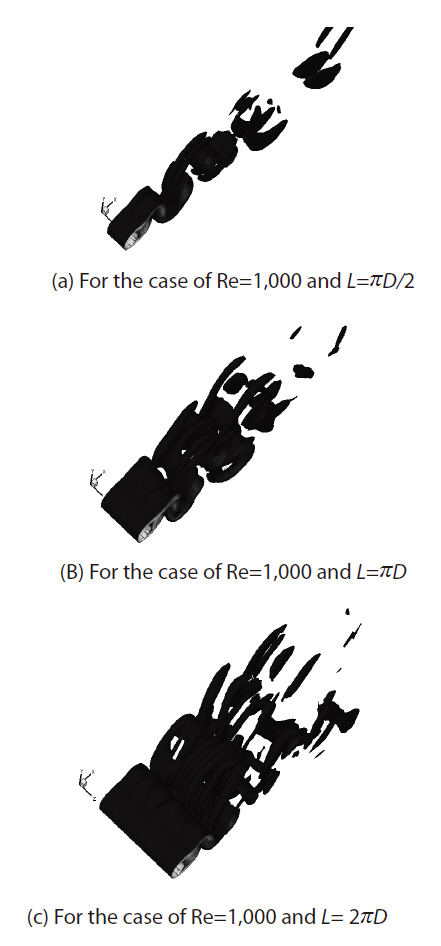
Figures 6(a-c) show the secondary vortices according to the variation of the spanwise length at Re=1,000, respectively.The secondary vortices flowed downstream with a uniform shape when the spanwise length was
Figure 7 shows the wavelength distribution of the vortex according to the Reynolds number and the spanwise length. The wavelength was about half of the experimental valued used by Williamson and Brown (1998)for a spanwise length was πD/2. When the Reynolds number was greater than 600 and the spanwise length was greater thanπD, the wavelength was about 1D, which is consistent with Williamson and Brown (1998). Thus it can be expected that the least spanwise length to analyze the three-dimensional
vortex structure is about πD, and when the spanwise length is πD with Re=400 or below, the wavelength is not precisely simulated. This may be caused by an artificial dissipation term or the boundary condition of z -direction.
The strength of the secondary vortex was relatively lower than the strength of Karman vortex generated in the main flow. Figures 8(a-c) show the vortices generated according to the spanwise length at Re=1,000. Figure 8(a) shows the Karman vortex flowing toward the x-direction with a certain size and without any interaction with the secondary vortex when the spanwise length is πD/2. Figures 8(b) and (c) are the cases for the spanwise length πD and 2 πD, respectively.The secondary vortices clearly affected the Karman vortex,which created very complicate phenomena while flowing downstream.
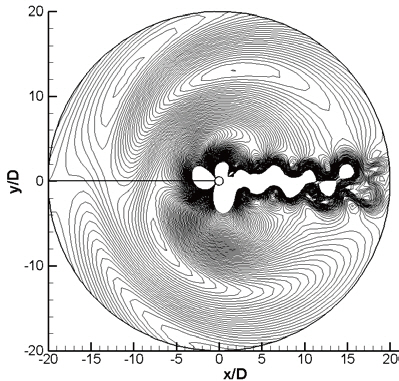
The acoustic field, caused from the unsteady flow around the circular cylinder, was analyzed at Re=1,000. Figure 9 shows the pressure contours at the center cross section of z-axis indentifying the propagation characteristics of the aero-acoustic waves within the computational zone. The figure shows that the pressure fluctuation caused by the periodical wake flow propagates downstream and toward all directions. Figure 10 shows the aero-acoustic field radiating relatively faster than the pressure field of the Karman vortex in one period.
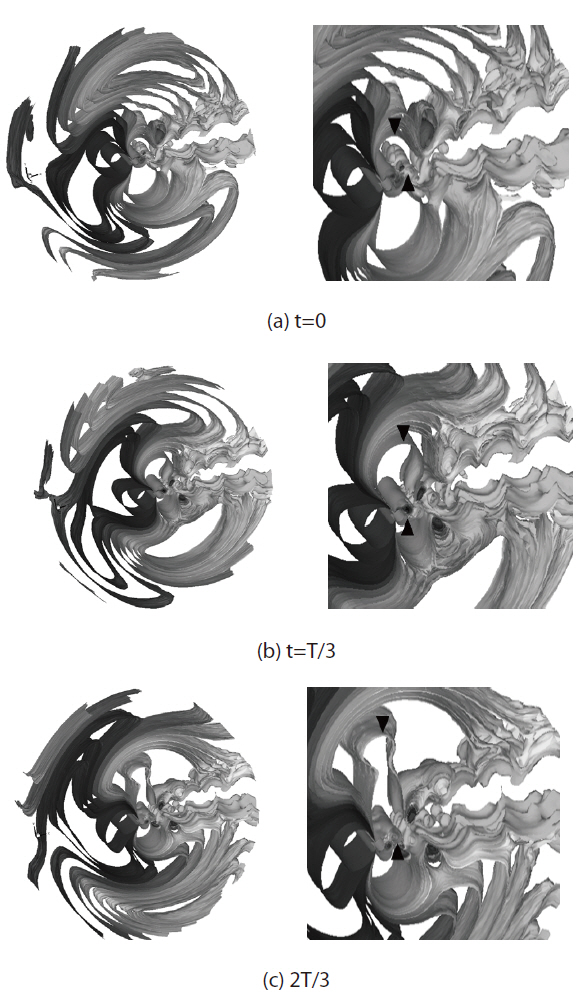
(a): ▲ indicates a vortex generated on the upper surface and acoustic wave generated from this vortex.
(b): The vortex is moving toward the -y direction and the acoustic wave is moving toward the +y direction faster than the movement of the vortex.
(c): At this time the first vortex separates from the cylinder, and the acoustic -x direction.
The three-dimensional wake flow around a circular cylinder was analyzed using an unsteady compressible three-dimensional RANS equation with an OHOC scheme and a 4th-order Runge-Kutta scheme. In order to resolve the numerical instability resulting from the non-linear discontinuous wave, ANAD was used. A simple boundary condition was used to suppress the reflection wave with the coarse grid system.
Computation was completed for Reynolds numbers within the B-mode range at which the three dimensional instability characteristics were typically observed. The Strauhal number, lift and drag coefficients were compared to experimental results obtained in previous studies. The Stouhal number variation according to the Reynolds number was almost consistent with past experimental results, and the Stouhal number variation maintained an almost constant value regardless of the spanwise length. The lift and drag coefficients variation according to the Reynolds number were affected by the spanwise length, and exhibited similar result to past experimental results when the spanwise length was at or above πD
The analysis of the secondary vortex structure indicated that the structure sustained a size that was approximately the same size as the diameter of the cylinder, which is a main characteristic of the three-dimensional wake of the circular cylinder when the Reynolds number is in the B-mode range.The secondary vortex was affected by the spanwise length;the minimum value of the spanwise length that allowed the proper simulation of the secondary vortex was πD or greater.At or below Re=400 the wavelength of the secondary vortex was measured to be three times larger than the cylinder diameter when the spanwise length was 2 πD, which is supposed to be affected by an excessive dissipation. This secondary vortex interacted with the wake and significantly affected the behavior of the Karman vortex.
With qualitative analysis for the acoustic field, the pressure field moved relatively faster than the movement of the flow field and exhibited instability caused by the secondary vortex. From the acoustic analysis for the acoustic source,the result showed that the field radiated from the upper and lower sides of the cylinder by turns, a feature signifying a bipole source.