The sharp increase of atmospheric carbon dioxide(CO2) concentration in anthropogenic greenhouse gases has been reported to be responsible for the present climate warming (Canadell et al. 2007). Forest ecosystems,as a major reservoir of terrestrial carbon, play a critical role in the global carbon cycle, and they can provide long-term capacity for carbon sequestration and storage(Houghton et al. 2001, Gower 2003). A better understanding of the carbon balance in forest ecosystems is required to predict future climate changes, because accelerations in climate warming may result in enormous CO2 release,due to positive feedback of carbon cycling between the atmosphere and forest ecosystems (Cox et al. 2000, Prentice et al. 2001). Therefore, it is necessary to quantify the carbon budget of forest ecosystems, and to determine whether forests function as sinks or sources of atmospheric CO2. In particular, a great deal of attention has focused on temperate and boreal forests, as these regions comprise almost 50% of the forests around the world, and may function as major sinks in the global carbon cycle (Larcher 1995, Curtis et al. 2002). Several reports have indicated that in the middle and high latitudes of the Northern Hemisphere, the remaining 1 to 2 GtC (billon tons of carbon)/y of ‘missing carbon’ is supposed to be assimilated by temperate and boreal forests (Wofsy et al. 1993, Denning et al. 1995, Baldocchi et al. 1996, Myneni et al. 2001). However, in temperate and boreal regions, the role of forest ecosystems responsible for the residual carbon sink remains uncertain.
Measurements of CO2 flux between the atmosphere and forest ecosystems have been widely conducted using micrometeorological methods, such as the eddy-covariance technique in various forests, including boreal and temperate forests in Europe, North America, and East Asia (Falge et al. 2002, Saigusa et al. 2002). Recently, combinations of the eddy-covariance technique and flux tall towers for estimating the carbon budgets of forest ecosystems have been commonly adopted and proliferated, in spite of the difficulty of maintenance of the relevant instruments. These studies have demonstrated variations in net ecosystem exchange (NEE), and provided quantitative information on net photosynthesis and ecosystem respiration (Baldocchi et al. 2001, Falge et al. 2002, Shibata et al. 2005). However, in order to assess CO2 flux and sequestration within forest ecosystems, the application of eddy-covariance techniques is limited by the difficulties associated with the complicated components of ecological and biological processes.
In the carbon cycling of forest ecosystems, the large magnitude of soil surface CO2 efflux makes this one of the major flux pathways via changes in plant and soil. This CO2 efflux has been estimated to account for 60-90% of total ecosystem respiration in temperate forests (Valentini et al. 2000, Law et al. 2001). In particular, cool-temperate deciduous forests are broadly distributed throughout East Asia. Several studies have quantitatively evaluated CO2 efflux and carbon dynamics in the cool-temperate regions, according to the type of forest, the age of trees and management practices (e.g., Jia et al. 2003, Mo et al. 2005). In the case of Korea, the forest area occupies 6.3 × 10⁶ ha, approximately 65% of the total land area. Deciduous and mixed forests take up 1.7 × 10⁶ ha and 1.9 × 10⁶ ha, respectively, and they account for about 57% of all Korean forests (Son et al. 2004). The
The Namsan Ecological Tower Site (NSETS) was established to conduct long-term ecological research and monitoring of CO2 flux in a cool-temperate deciduous,broad-leaved forest (
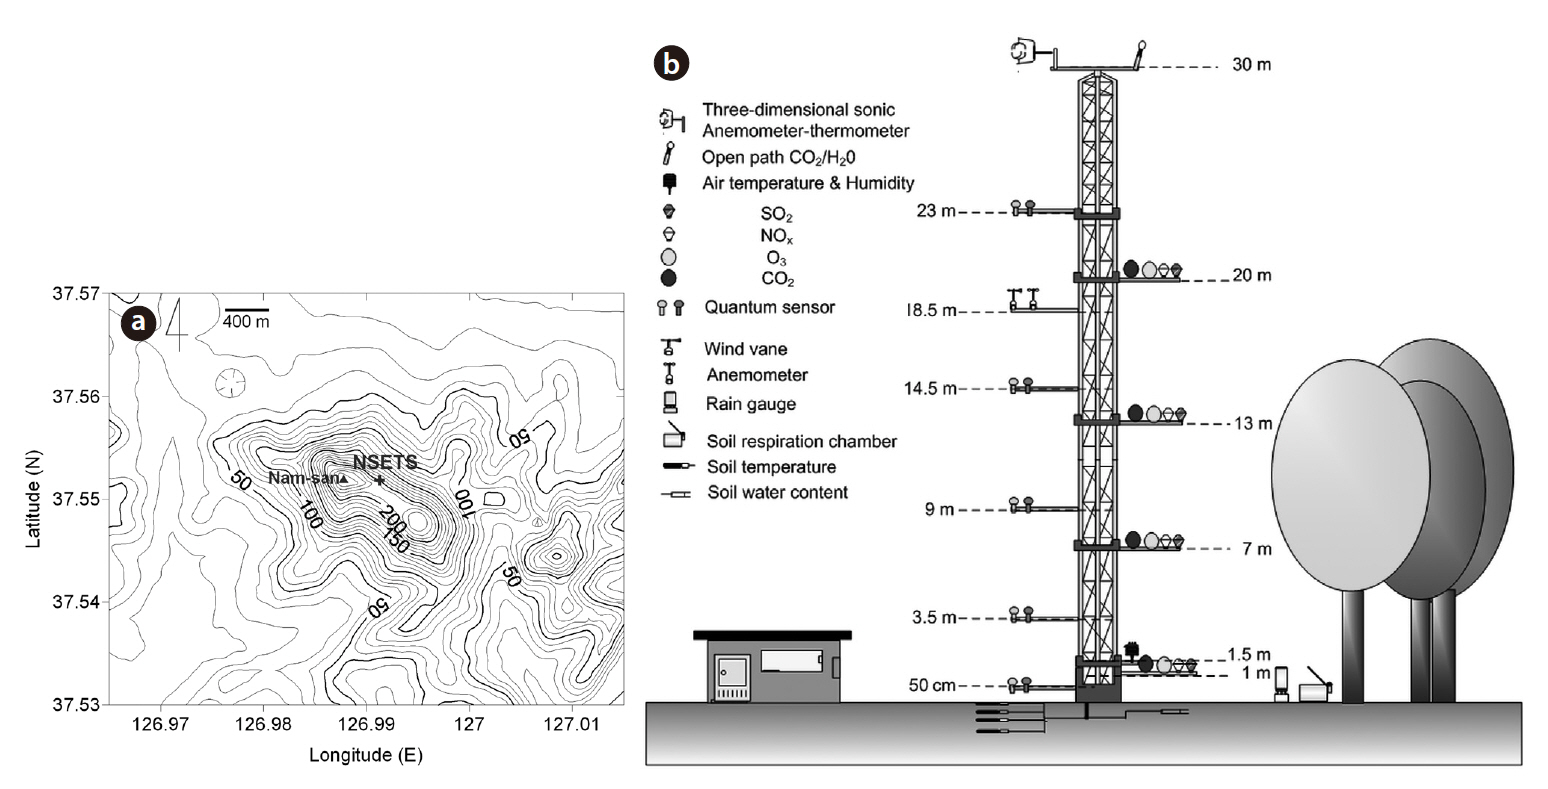
The NSETS (37o33' N, 126o59' E, 220 m a.s.l.) (Fig. 1) is located in a urban forest with a floor area of approximately 2.9 km2, managed by the Korea National Long-Term Ecological Research (KNLTER) program, on the northeastern slope of Mt. Nam in the center of metropolitan Seoul, in the west-central part of the Korean Peninsula (Fig. 1a). This region has a cool-temperate zone under the influence of the Asian monsoon climate. According to the database of the Korea Meteorological Administration from the Seoul Weather Station, the annual mean air temperature and precipitation are 11.8°C (minimum of -3.4°C in January and maximum of 25.4°C in August) and 1,369.8 mm, respectively. The vegetation at the site is classified as an approximately 49-55 year old deciduous broad-leaved forest, composed mainly of
The continuous NEE observation tower was established in a cool-temperate deciduous forest ecosystem in early spring 2008, 42 m away from the peak land of Mt. Nam. CO2 fluxes between the atmosphere and forest canopy were measured from May 2008, via the eddy covariance technique. The mean height of the forest stand around the tower was approximately 15 m. Instruments
[Table 1.] Characteristics of the forest stand at NSETS
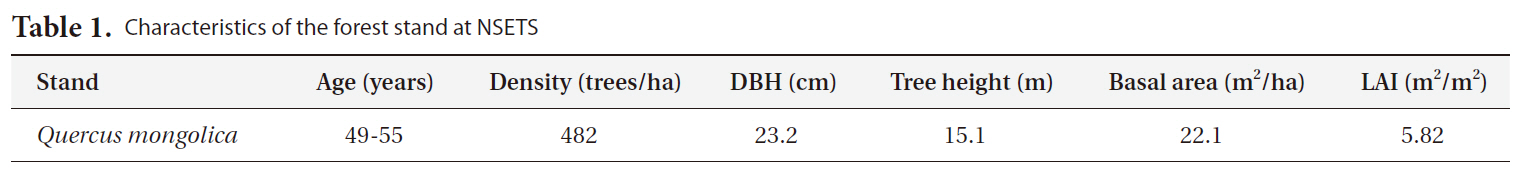
Characteristics of the forest stand at NSETS
of the flux and micrometeorological measurements based on the tall tower were installed on a triangular cross section with a maximum edge length of 0.6 m, at a location 30 m above the soil surface and approximately 15 m above the forest canopy (Fig. 1b). Fluctuations in wind velocity and virtual temperature are measured using a three-dimensional ultra sonic anemometer (CSAT3; Campbell Scientific Inc., North Logan, UT, USA). Vapor pressure and CO2 fluctuations were measured using an open-path CO2/H2O gas analyzer (LI7500; LI-COR, Lincoln,NE, USA). These fast-response instruments, situated on the north facing side of the tower, are operated at a sampling rate of 8.3 Hz using a data-measurement and control system (CR1000; Campbell Scientific Inc.). The CO2/H2O gas analyzer (LI7500; LI-COR, Nebraska, USA) was calibrated by using CO2 zero gas and standard span gases, and potable dew point generator (LI-610; LI-COR, Nebraska, USA) at least once every 6 months. The calibration was performed via the windows interface software. Downward radiation components are measured with pyranometers (LI-200SA; LI-COR) at 0.5, 3.5,
5.9, 14.5, 18.5, and 23 m above the soil surface. Photosynthetic photon flux densities are measured at 0.5, 3.5, 5.9, 14.5, 18.5, and 23 m above the soil surface, respectively, using quantum sensors (LI-190SA; LI-COR). Wind direction and velocity at 18.5 m above the canopy are measured with an anemometer (A301P; Weather Tec., Seoul, Korea) and wind vane (V10KA; Weather Tec.). Air temperature and relative humidity are observed at a height of 1.5 m using a temperature and humidity probe (HMP45C; Vaisala, Helsinki, Finland). The soil water contents and soil temperatures are measured at 0.05, 0.1, and 0.3 m below the soil surface, respectively using profile probes (CS616; Campbell Scientific Inc.) and hand-made T-type thermocouples. The underground data are collected at a point 1.5 m from the tower.
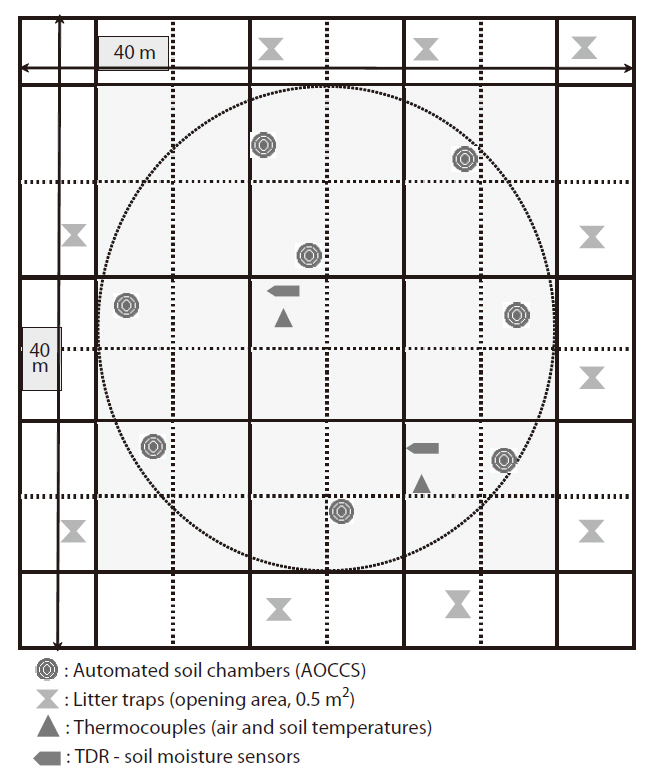
The Automatic Opening/Closing Chamber (AOCCs) system using the closed dynamic method was employed for the continuous monitoring of soil surface CO2 efflux at multiple points. This system features 8 automated chambers, an 8-channel gas sampler, an IRGA (LI-820; LI-COR), and a datalogger (CR1000; Campbell Scientific Inc.). The automated chambers (cylinder shape, inside diameter: 30 cm, height: 20 cm, thick: 0.5 cm) had a wall made from transparent acrylic, and a lid hinged at the side wall. The chamber lid can be closed and opened automatically by a 12-V DC motor. To ensure a gastight seal between the cylindrical chamber and the closed lid, a soft rubber gasket attached to the top edge of the chamber. When the chamber was closed, a mixing fan (KMFH-12; Nihon Blower, Tokyo, Japan) inside each chamber maintained air movement with a wind speed of approximately 0.1 m/s. The measurement plot was established on the forest floor beneath a flux tower (Fig. 2). The 8 chambers were placed randomly on the forest floor within a 1,600 m2 area on October 2009, and were inserted 3 cm below the top of the litter layer. All the vegetation inside the chambers was removed. During the measurement period,the section of the chamber lid was raised to allow rainfall and leaf litter to reach the enclosed soil surface. The length of the Teflon tubing used to sample air from each chamber was 20 m. The chamber air was withdrawn continuously from all 8 chambers, but only the air from the closed chamber was supplied to the multichannel gas sampler system by an air sampling pump (CM-15 with a maximum flow rate of 5 l min-1, EMP, Tokyo, Japan). Flow rates of chamber air were monitored and balanced by mass flow controllers (SEF-21A; STEC, Kyoto, Japan). The airstream of 5 l min-1 from the chamber outlet was divided by two mass flow meters, of which 0.8 l min-1 went to the IRGA to measure the CO2 concentration, and the other bypassed the IRGA (4.2 l min-1). The air exhausted from the IRGA went to a bypass tube, and the total remaining air continuously flowed into the inlet of the chamber. In order to avoid any increase or decrease in pressure, the same amount of air supplied to the chamber inlet was simultaneously withdrawn by an air pump from the chamber outlet. Over the course of a half-hour, the chambers were closed sequentially by the 8-channel relay driver controlled by the datalogger. We set sampling period for each chamber to 225 s. The datalogger acquired output from the IRGA at 1 s intervals, and averaged and recorded it every 10 s. The raw CO2 signals from the IRGA were employed Eq. (I) to calculate the soil surface CO2 efflux. The data collected were averaged from the 8 chambers over each 30 min cycle. The IRGA (LI-820; LI-COR, Lincoln, NE USA) was calibrated with CO2 zero gas (pure nitrogen) and two span gases with different CO2 concentrations at least once every 3 months.
The air temperature, soil temperature and soil water content (SWC, %) were measured at the same time as the soil CO2 efflux rate. The air temperature at a height of 1.5 m above the ground and the soil temperature at depths of 0, 5, 10 cm were measured with thermocouples. The volumetric SWC (%) was measured using a TDR soil moisture sensor (CS616; Campbell Scientific Inc.) at a depth of 15 cm. These data were recorded once every 10 s by a datalogger (CR1000; Campbell Scientific Inc.).
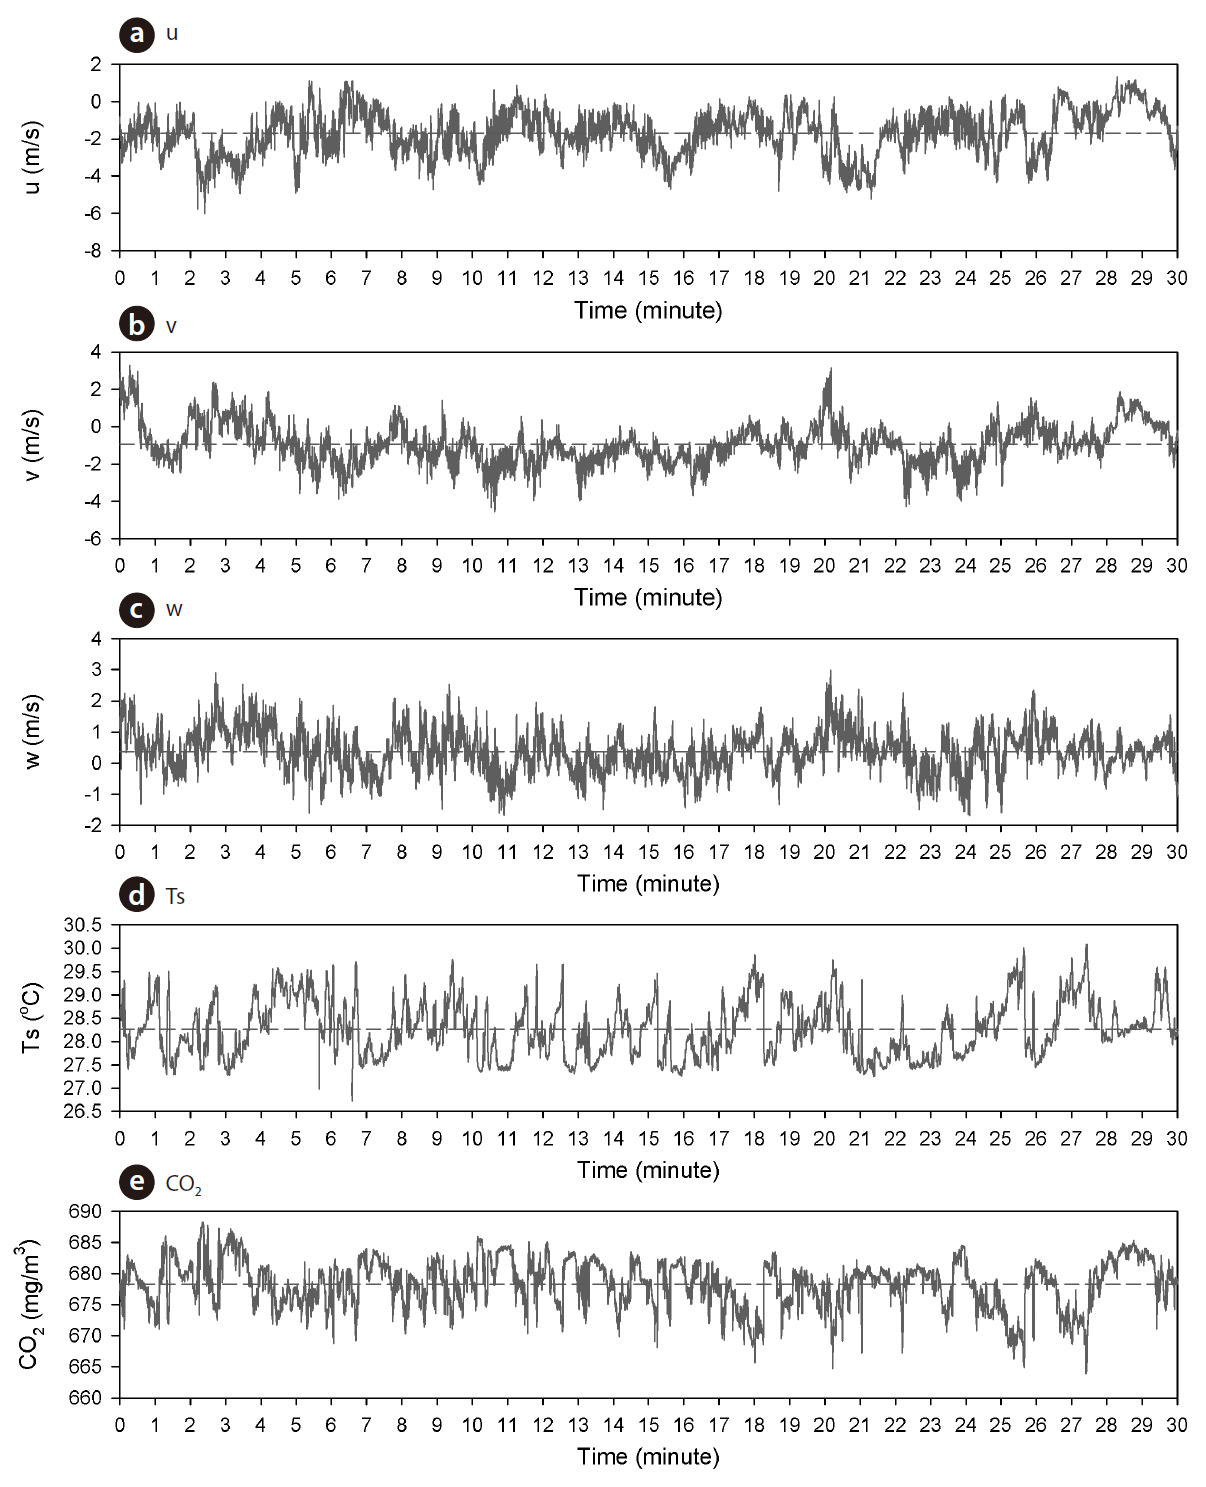
The u, v, w component of wind speed and CO2 concentration were sampled at 8.3 Hz from the sonic anemometer and open-path CO2/H2O gas analyzer, respectively (Fig.3 ). Sonic temperature Ts was calculated from the sonic wind velocity (Fig.3 d). Then, soft spikes, which
are large short-lived departures from the period mean, were identified and removed from the raw data. The u-component of wind speed was directed to the mean wind speed direction, the v-component of wind speed to the lateral, and w-component to the vertical (Park and Park 2006). Turbulent components (u', v', w', T', C') were extracted from the raw data removed by the linear trend. The flux of CO2 concentration above the forest canopy is calculated using the eddy covariance method

The Webb corrections were applied to take into account the effects of density fluctuations on CO2 flux (Webb et al. 1980, Fuehrer and Friehe 2002).
Soil CO2 efflux (
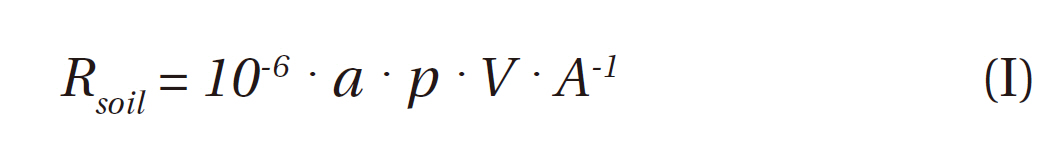
where
Below is the exponential function used to describe the temperature sensitivity of
where coefficient
where Q10 is the relative increase in
Regression analysis was used to examine the relationships between the
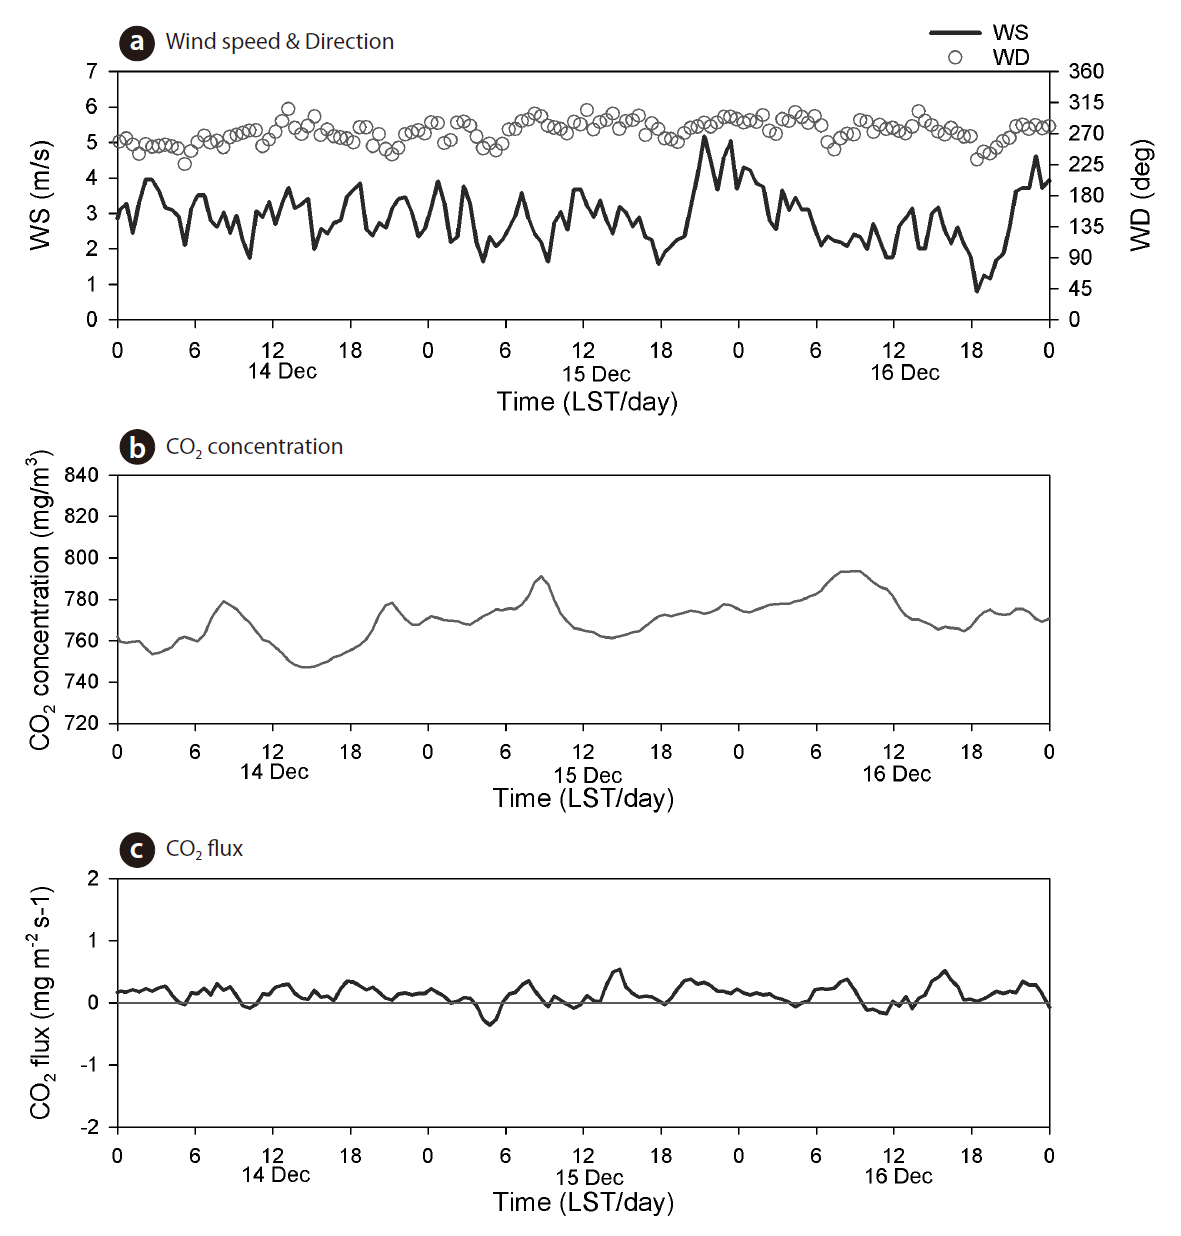
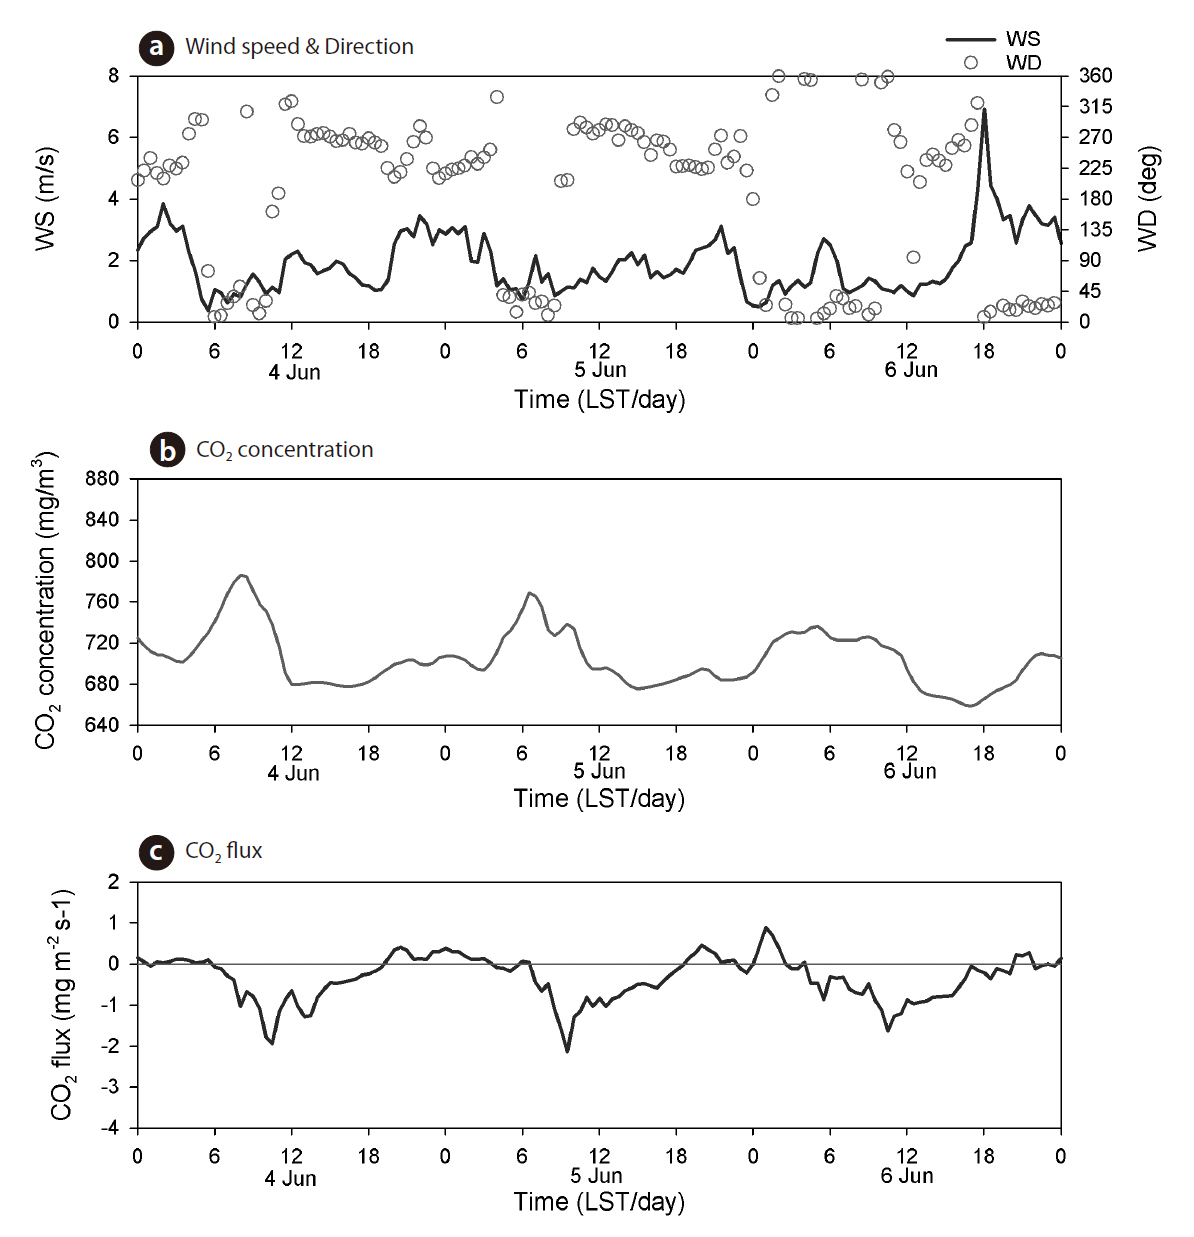
We presented the amplitude and variation in CO2 concentration and flux for 3 days each during the summer and winter seasons. Fig. 4 shows the time series of wind speed and direction, CO2 concentration and flux during the winter period of 14-16 December, 2009. Wind speed ranged from 1-5 m/s, and the wind direction was nearly north-easterly. The concentrations of atmospheric CO2 varied from 740 to 780 mg/m3 (377-397 ppm), with a daily maximum at 0900 LST and a daily minimum at 1500 LST. The mean amplitude of CO2 concentration was 33 mg/m3. The daily maximum value of CO2 concentration was thought to be related to the heating of houses and buildings in the Seoul metropolitan area, and the daily minimum value due to the low vegetation growth of the surface boundary layer in the winter. The mean CO2 concentration was 770 mg/m3 throughout this experimental period. The flux of CO2 did not show any special diurnal variation during the winter period, during which the net CO2 flux was 0.14 mg CO2 m-2 s-1. Fig. 5 shows the time series of wind speed and direction, CO2 concentration, and flux during the summer period of 4-6 June 2010. Wind speed ranged from 0.2 to 7 m/s and the wind direction was north-easterly (valley wind) during the daytime,southerly (mountain wind), or northerly during the nighttime. The CO2 concentration varied from 660 to 780 mg/m3 (336-397 ppm), with mean values (705 mg/m3) smaller than those during the winter season. However, its mean amplitude (104 mg/m3) was larger than that in the winter period (33 mg/m3). The daily maximum and minimum values in atmospheric CO2 concentrations occurred at 0600-0800 LST and at 0600-0800 LST, respectively.Indeed, the reductions in CO2 concentration during the daytime were related to the photosynthesis underlying tree and vegetation. The patterns of CO2 flux showed diurnal variations with positive (upward) values during the nighttime, whereas during the daytime, they had negative (downward) values. The daily negative extreme of CO2 flux was the mean value of -1.9 mg CO2 m-2 s-1 at 0900-1100 LST, whereas the daily positive extreme was the mean value of 0.58 mg CO2 m-2 s-1 in the nighttime. During the summer period, the net CO2 flux was -0.34 mg CO2 m-2 s-1. According to a previous study of Falge et al. (2002) based on AmeriFlux (23 sites) and EUROFLUX (16 sites) measurements, the estimated value of total carbon uptake in temperate deciduous forest ecosystems accounts for approximately -5 g C m-2 day-1, although these regions showed periods of unbalanced respiratory and assimilatory processes. In comparison with the potential estimation value of Kim et al. (2008)
by applying the eddy-covariance technique over the cool-temperate
cool-temperate deciduous forests may have a substantial effect as carbon sinks on the global carbon cycle of the terrestrial ecosystem (Baldocchi et al. 1996, IGBP Terrestrial Carbon Working Group 1998, Saigusa et al. 2002).
In order to assess long-term continuous measurements of soil CO2 efflux, the AOCCs system was implemented on the soil surfaces of a
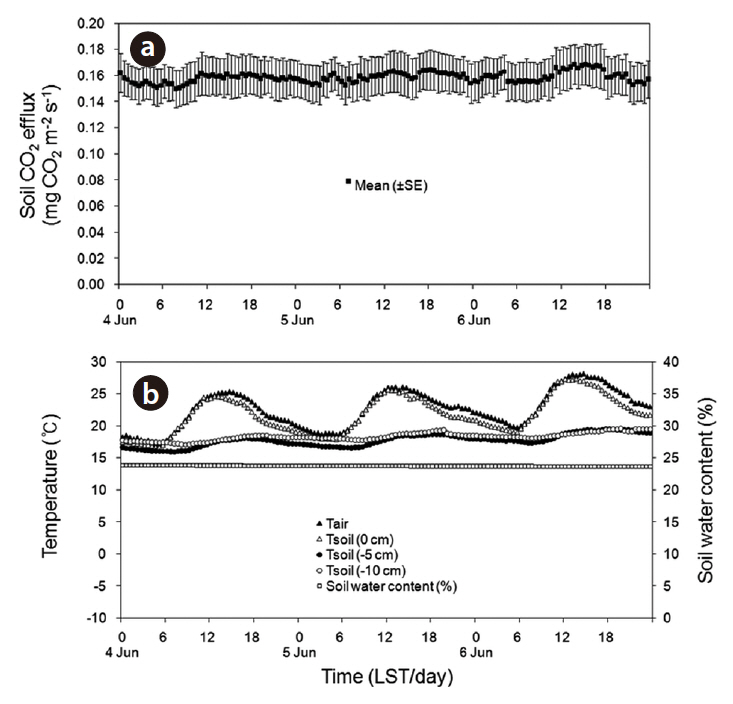
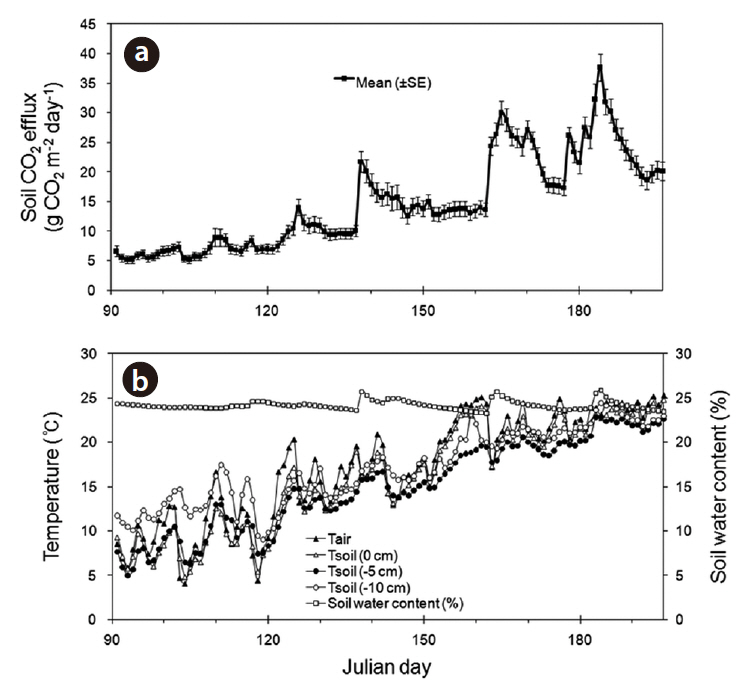
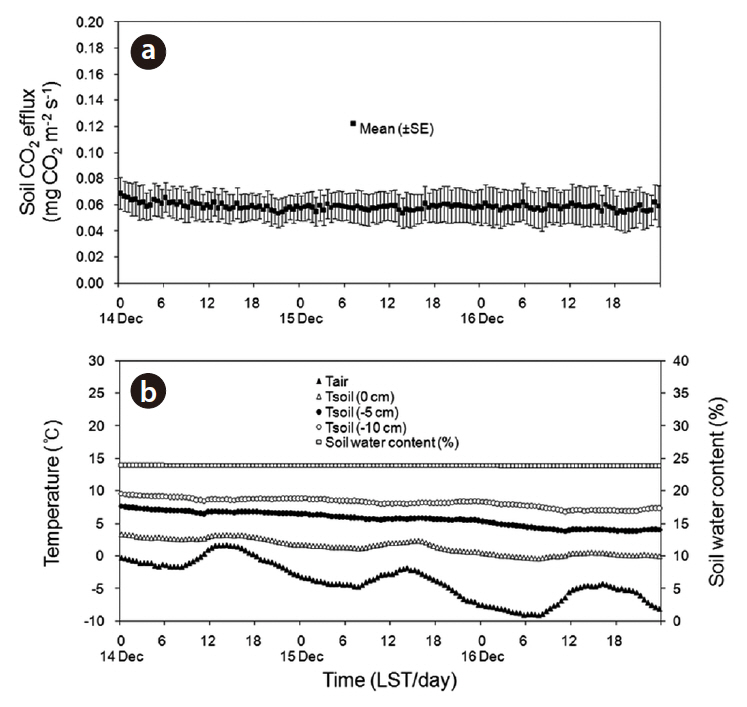
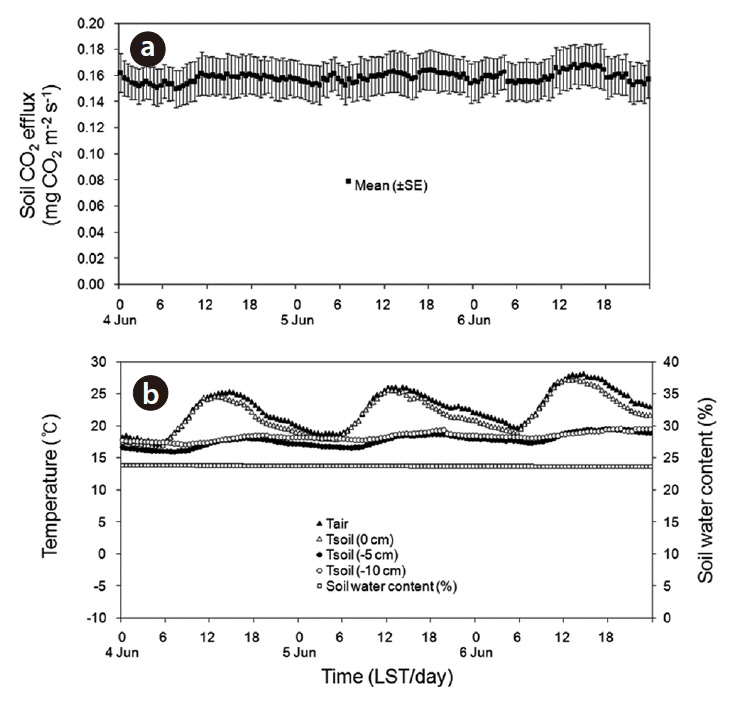
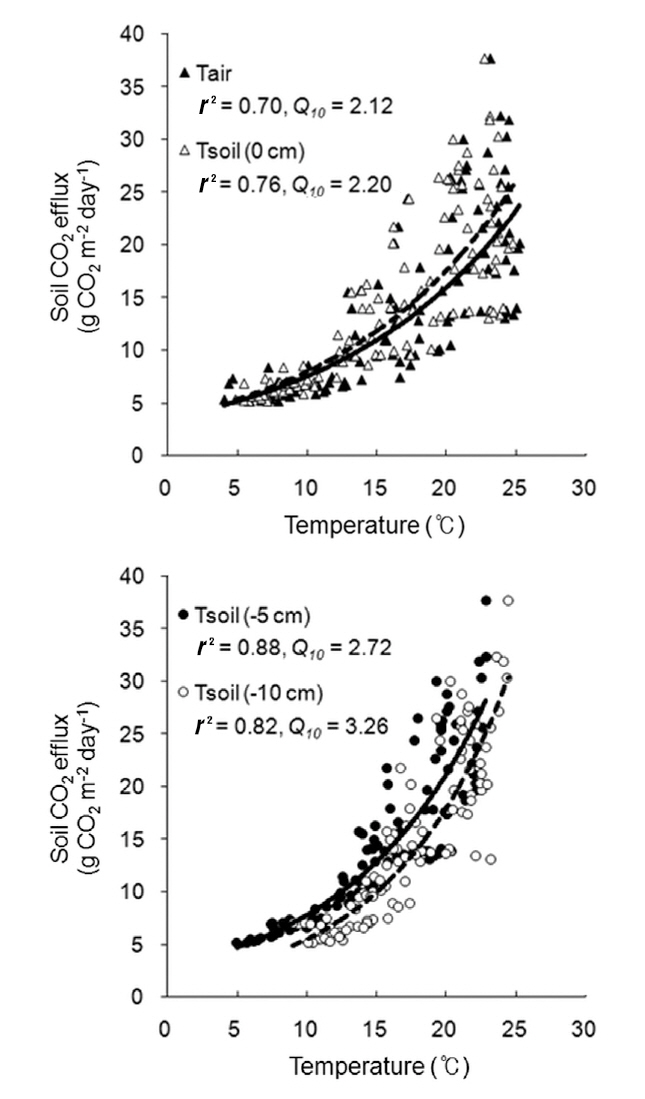
opy of forest was closed, the diurnal variation in the rate of soil CO2 efflux was minimal, and followed the small daily changes in soil temperature. Liang et al. (2004) also showed that the range of diurnal variation in the soil CO2 efflux, photosynthetic active radiation, and soil temperature was greater on sunny days than on cloudy days. The soil CO2 efflux and environmental factors (air and soil temperatures, and soil moisture content) were measured continuously during the experimental period from April to July of 2010 (Fig. 8). The daily mean values in soil CO2 efflux and soil temperature increased profoundly from spring to summer. The seasonal pattern in the rate of soil CO2 efflux strongly followed the seasonal pattern in soil temperatures. The daily mean values in the rate of soil CO2 efflux increased moderately in the spring (range, 5.2 to 9.0 g CO2 m-2 day-1 in April), and increased sharply in summer (range, 18.6 to 37.7 g CO2 m-2 day-1 in July). The relation of soil CO2 efflux to the temperatures was described well by an exponential function (Fig. 9). In the experimental periods, the temperature functions derived from the daily mean soil temperature at different depths accounted for approximately 76-88% of the soil respiration variability, and the daily mean rate of soil CO2 efflux was most strongly related to soil temperature at 5 cm depth. The Q10 values for soil CO2 efflux varied in range from 2.12 to 3.26, and increased with increasing the soil depth. In the study site, the values of SWC (%) at 15 cm depth had no discernible seasonal trends (range, 17 to 25%), and there were no exponential relationships between soil CO2 efflux and SWC (data not shown). Similarly,Liang et al. (2004) and Mo et al. (2005) determined that the relation of soil CO2 efflux to soil moisture was neither clear nor significant in cool-temperate regions, despite being an important environmental factor for the prediction of annual soil respiration rates. However, the continuous results obtained in our study site showed that the higher diurnal variations in soil CO2 efflux and SWC actually occurred on days with rainfall. Additionally, Inglima et al. (2009) demonstrated that the precipitation pluses in soil CO2 efflux can enhance heterotrophic respiratory activities during the drought period, reflecting the rapid decomposition of organic materials accumulated in the drying soils.
In this study, atmospheric CO2 was highly sequestered by the
lar canopy surface and the drainage flow of CO2 across the stream valley in the forest ecosystem (Feigenwinter et al. 2008). Moreover, it may underestimate respiration at night in calm winds (Baldocchi et al. 2001). Additionally,Shibata et al. (1998) demonstrated that the effects of nitrogen deposition on carbon sequestration must be investigated more clearly to confirm whether the input of nitrogen from the atmosphere enhances carbon uptake in the forest. As for our study site, the forest ecosystem of
We found that the AOCCS is a useful tool for both short-term and long-term measurements of soil CO2 efflux on the forest floor, and can provide high quality data regarding the diurnal and seasonal variations in soil CO2 efflux with a high temporal resolution and the capturing environmental variables. In further studies, the CO2 flux values measured continuously and steadily for a long-term at the NSETS can provide us with a greater understanding of net CO2 exchanges in the forest ecosystem. Consequently, it has become possible to evaluate the seasonal and annual variations in carbon budgets in the