Carbon materials such as graphite and graphene are versatile, environmentally friendly, and exhibit high electrical conductivity [1]. Graphite is comprised of about three millions layers in one millimeter thickness and an individual layer of graphite is considered as graphene. Although, graphene layers are held together by weak bonds that allow the layers to slide over each other, the large numbers of bonds hold the material together as a solid [2]. Graphene is important for fundamental studies and technological applications due to its unique structure and wide range of unusual properties [3-6]. The electronic properties of graphene are strongly dependent upon their structures in such a way that the variation in the number of graphene layer may result in a striking change in their electronic properties [7]. Accordingly, it is important to explore the large scale production of graphene with varying number of layers for their fundamental and extensive applications in many demanding sectors.
The evaluation of carbon materials by the assessment of the pressure/ volume relation with electrical conductivity is not new. Different studies have been conducted for the measurement of electrical conductivity of different carbon materials with respect to pressure, volume, void ratio, density, etc. [8-12]. However, the study on the electrical conductivity measurements of graphene powders under compression has not been reported yet.
In the present work, natural and synthetic graphene powders were synthesized from graphite oxide using modified Hummer’s method [13,14] followed by reduction of graphite oxide by hydrazine hydrate [15]. Here, we describe and compare in detail the electrical conductivities of differently synthesized graphenes and other carbon materials under compression from 0.3 to 60 MPa. This is an important step in quantifying the electrical properties of graphene under compression which will help develop graphene-based pressure dependent electronic devices.
Synthetic graphite TC 303 (typical size=20 micron, surface area 6 m2 g-1), natural graphite (typical size=44× 325 mesh, surface area 7.89 m2 g-1), expanded graphite (expansion ratio=290, sulfur content=3.508%) were kindly supplied by Asbury Graphite Mills, Inc. and multi walled nanotubes (MWNTs, DOBONG) were provided by Korea University.Other chemicals such as K2S2O8, P2O5, and KMnO4 were purchased from Aldrich.
2.2.1. Synthesis of synthetic and natural graphene
Graphite oxide was prepared by using a modified method described by Hummers [13,14]. Synthetic or natural graphite powder (12 g) was treated at 80℃ with the solution of H2SO4 (150 mL), K2S2O8 (10 g), and P2O5 (10 g). The resulting dark blue mixtures was thermally isolated and allowed to cool to room temperature and carefully diluted with deionized water (2 L) followed by drying overnight in air at ambient temperature. The oxidized graphite powder (12 g) was put into H2SO4 (0℃, 460 mL). KMnO4 (60 g) was added gradually with stirring and cooling (temp. not more than 20℃). Then the reaction was continued at 35℃ for 2 h. After 2 h, distilled water (920 mL) was added. Termination was done by distilled water (2.8 L) and 30% H2O2 (50 mL). The resulting mixture was filtered and washed with 1:10 HCl solution (5 L) to remove metal ions. The filtrate was tested with BaCl2 for the presence of sulphate ions. HCl washing was repeated until test result was negative. GO was then washed repeatedly with deionized water until pH of the filtrate becomes neutral. The GO slurry was freeze-dried and stored in vacuum oven.
Exfoliation of graphite oxide was achieved by ultrasonication (Heilscher) of the dispersion (0.1%) at 500 W and 50% amplitude for 30 min. The obtained brown dispersion was then subjected to 30 min of centrifugation at 3,000 rpm to remove any unexfoliated graphite oxide.
Reduction of graphene oxide (GO) was done according to the procedure reported by Stankovich et al. [15]. In a typical procedure for chemical conversion of GO to reduced graphene, the resulting homogeneous dispersion (0.5 g in 500 mL) was mixed with 5.0 ml of hydrazine hydrate solution. After being vigorously shaken or stirred for a few min, the flask was put into a water bath (~100 C) for 24 h. Filtration of the dispersion was achieved through an anodisc membrane filter (47 mm in diameter, 0.2 micrometer pore size, Whatman). Synthetic or natural reduced graphene powder was washed with plenty of deionized water and freeze-dried for 2 days.
2.2.2. Measurement of electrical conductivity
Electrical conductivity of graphene powder was measured at room temperature. Each sample was placed in a hollow cylinder having 0.7 cm inner diameter and was compressed in air between two brass pistons, forming the adjustable (upper) and fixed electrodes (lower). The pressure varied from 0.3 to 60 MPa by compressing pistons, while the load was measured using Newton NT-501A indicator. A digital vernier caliper was used to measure the small changes in height at each compression step. Conductivity was measured using Keithley DC Current Model 6220 with four point probe. Ohmic conductivity was measured using following formula:
σ=L/R.A
Where σ is electrical conductivity, L sample distance, A area of the piston surface, and R is resistivity.
Graphite oxide and reduced graphene were characterized by thermogravimetric analysis (TGA) in nitrogen at a heating rate of 1℃ / min from room temperature to 800℃ using TA instruments TGA Q50. Images of reduced graphene were taken at various magnifications using a scanning electron microscope(SEM). Spectra of X-ray Photon Spectroscopy(XPS) were recorded on a physical electronics quantum 2000 scanning ESCA microprobe with AlK α excitation at 15 kV acceleration voltages and 50 W for a probing size of 200 ㎛. The chamber pressure was maintained at 10-8Torr.
3.1. Confirmation of synthetic and natural graphite oxide and graphene
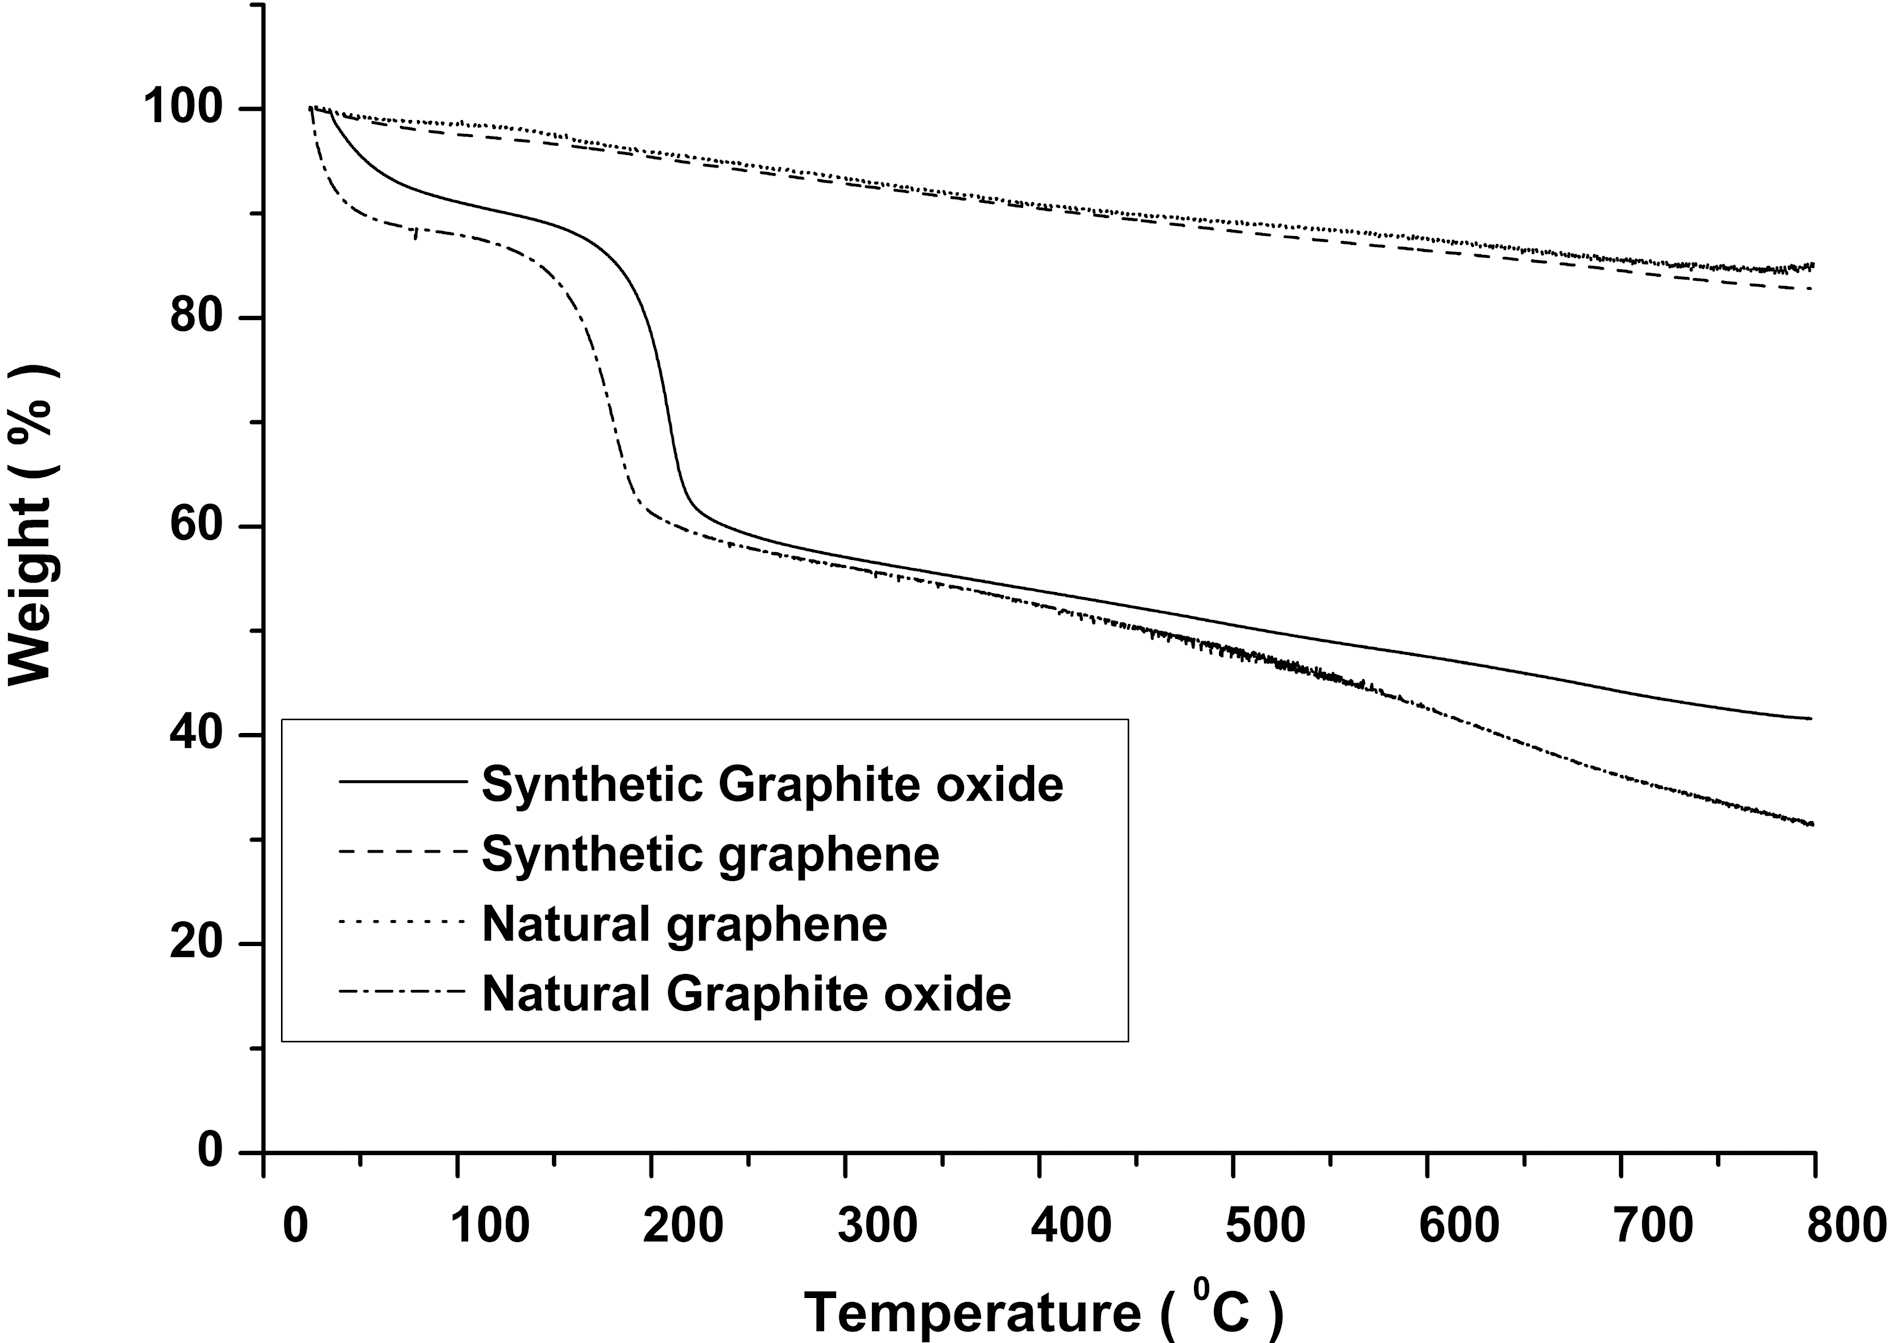
TGA of natural and synthetic graphite oxide show (Fig. 1)that major mass loss about 60% occurs at ~200oC which is due to decomposition of oxygen-containing functional groups in the graphite oxide [15]. On the other hand, both chemically reduced natural and synthetic graphene show much increased thermal stability than GO.
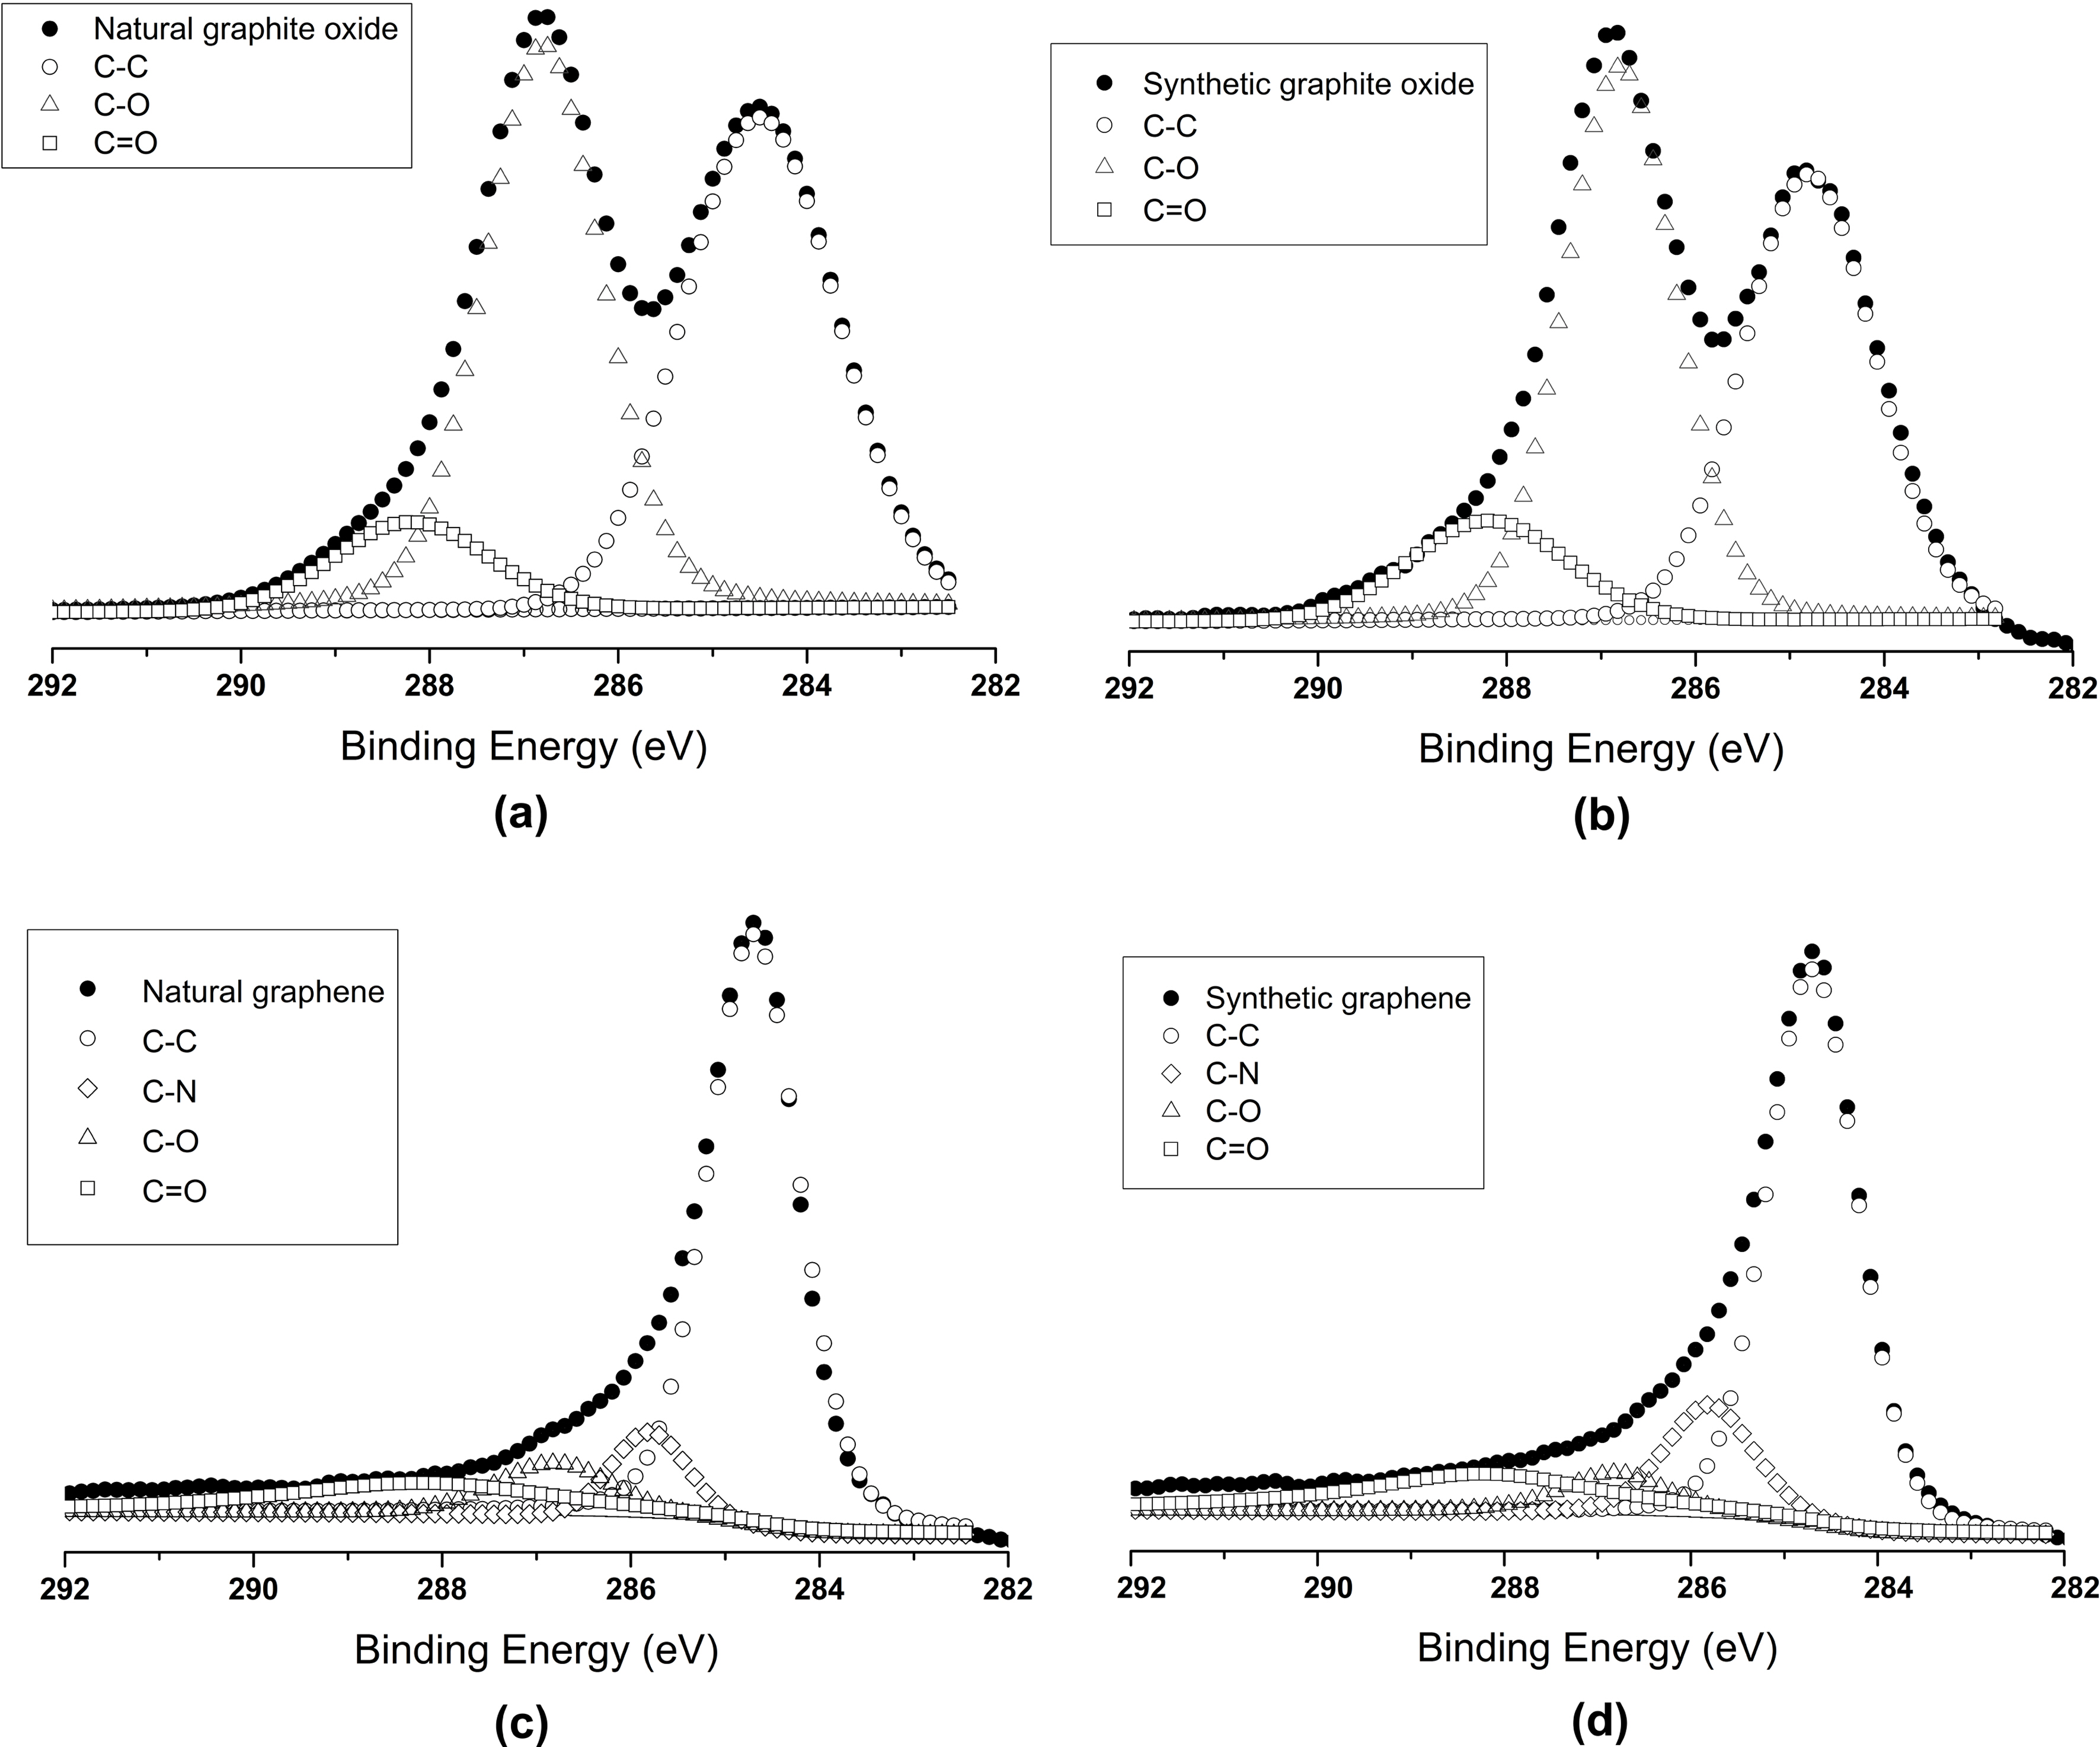
Further confirmation of natural and synthetic graphite oxides and graphenes were checked by XPS analysis (Fig. 2).The photoelectron peaks of natural and synthetic graphite oxide were curve fitted with two peaks at 284.7 eV,286.7 eV, assigned to graphitic carbon (C-C) and carbon singly bonded to oxygen (C-O-C and C-O-), respectively. In reduced natural and synthetic graphene case, only one predominant peak is observed that can be attributed to graphitic carbon. The narrow scan C 1s XPS spectra of natural and synthetic graphene are quite similar to that of
natural and synthetic graphite oxide, respectively and show fewer amount of deconvoluted peaks corresponding to nonoxygenated ring C (284.6 eV), C in C-O bonds (286.8 eV)and carbonyl C=O bonds (288.2 eV). Due to reduction in hydrazine hydrate one peak of C-N (285.8 eV) is also found.This finding [15] demonstrates that the reduction of graphite oxide has taken place.
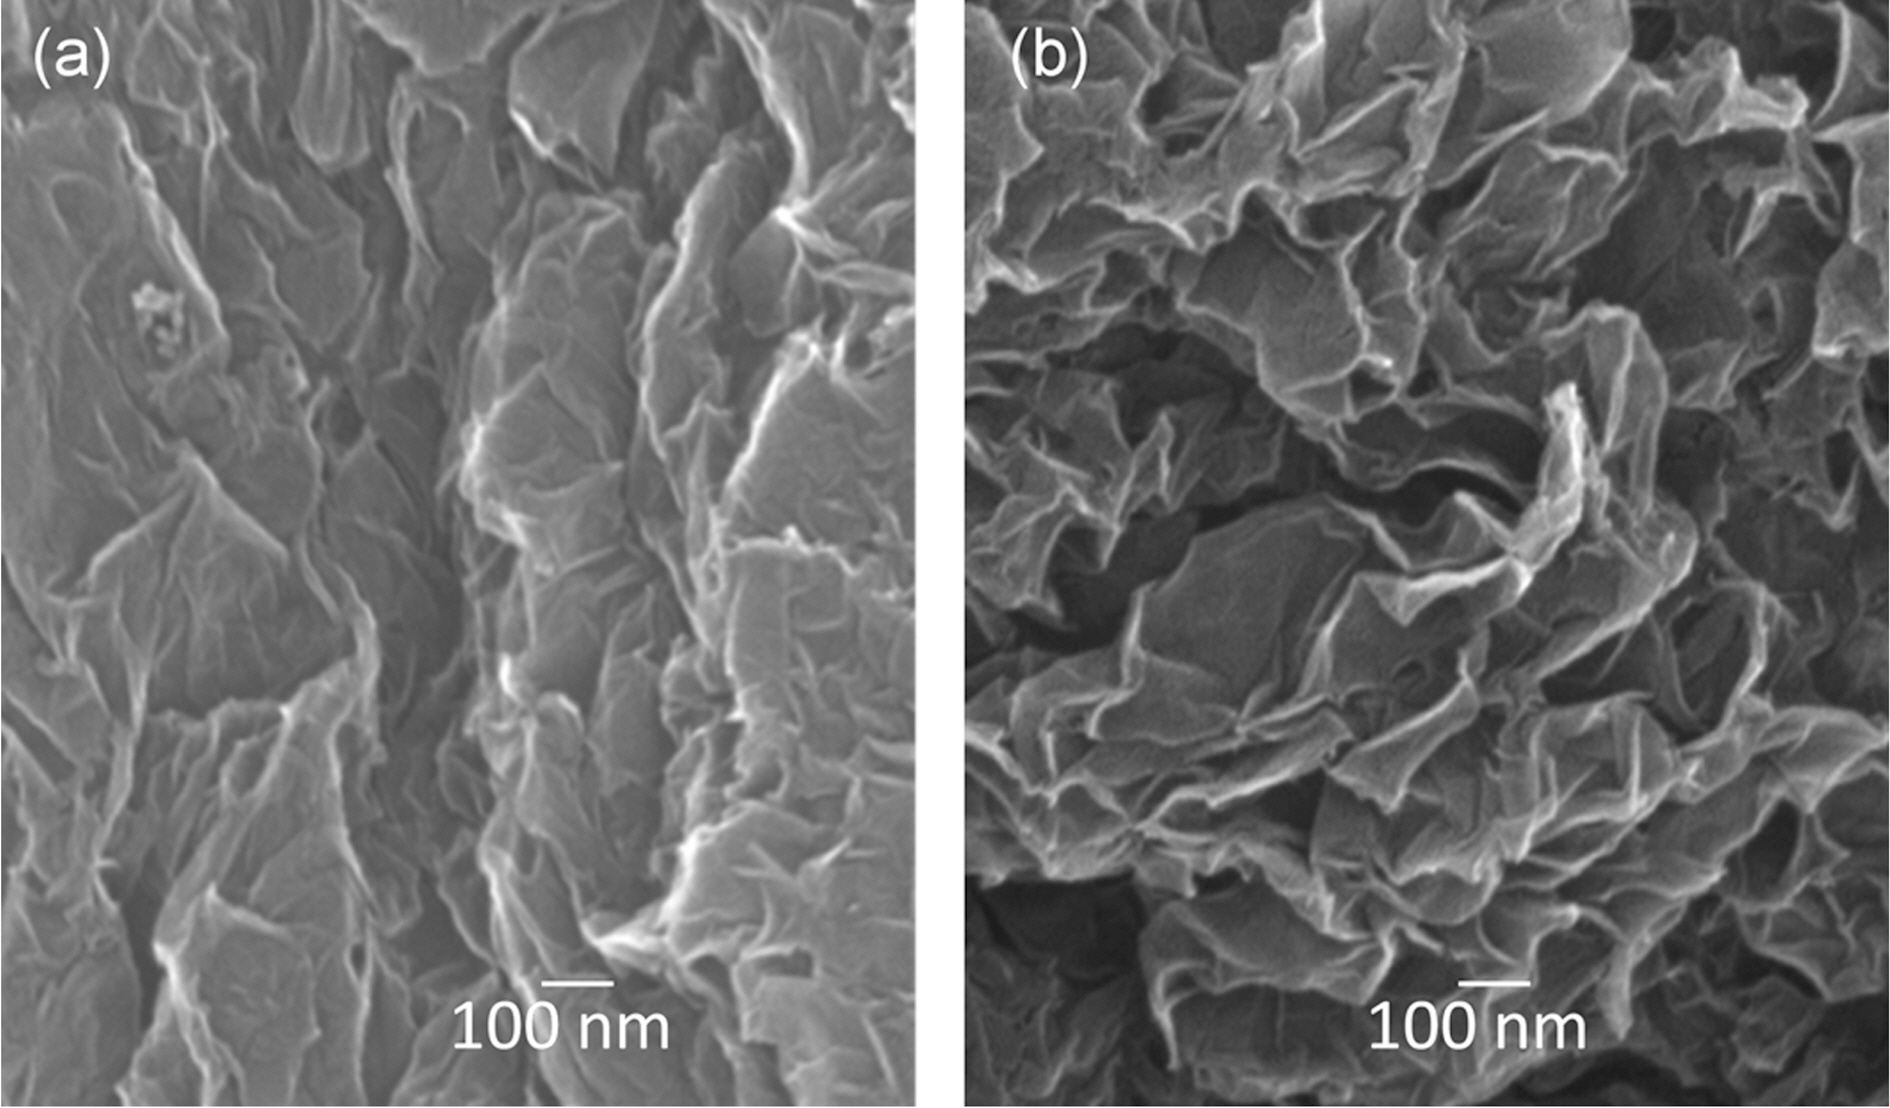
Morphologies of the graphene powders were checked by SEM which shows that both reduced graphenes from natural and synthetic graphite oxide consist of aggregated, thin sheets (Fig. 3).
3.2. Study of behavior of electrical conductivity under pressure
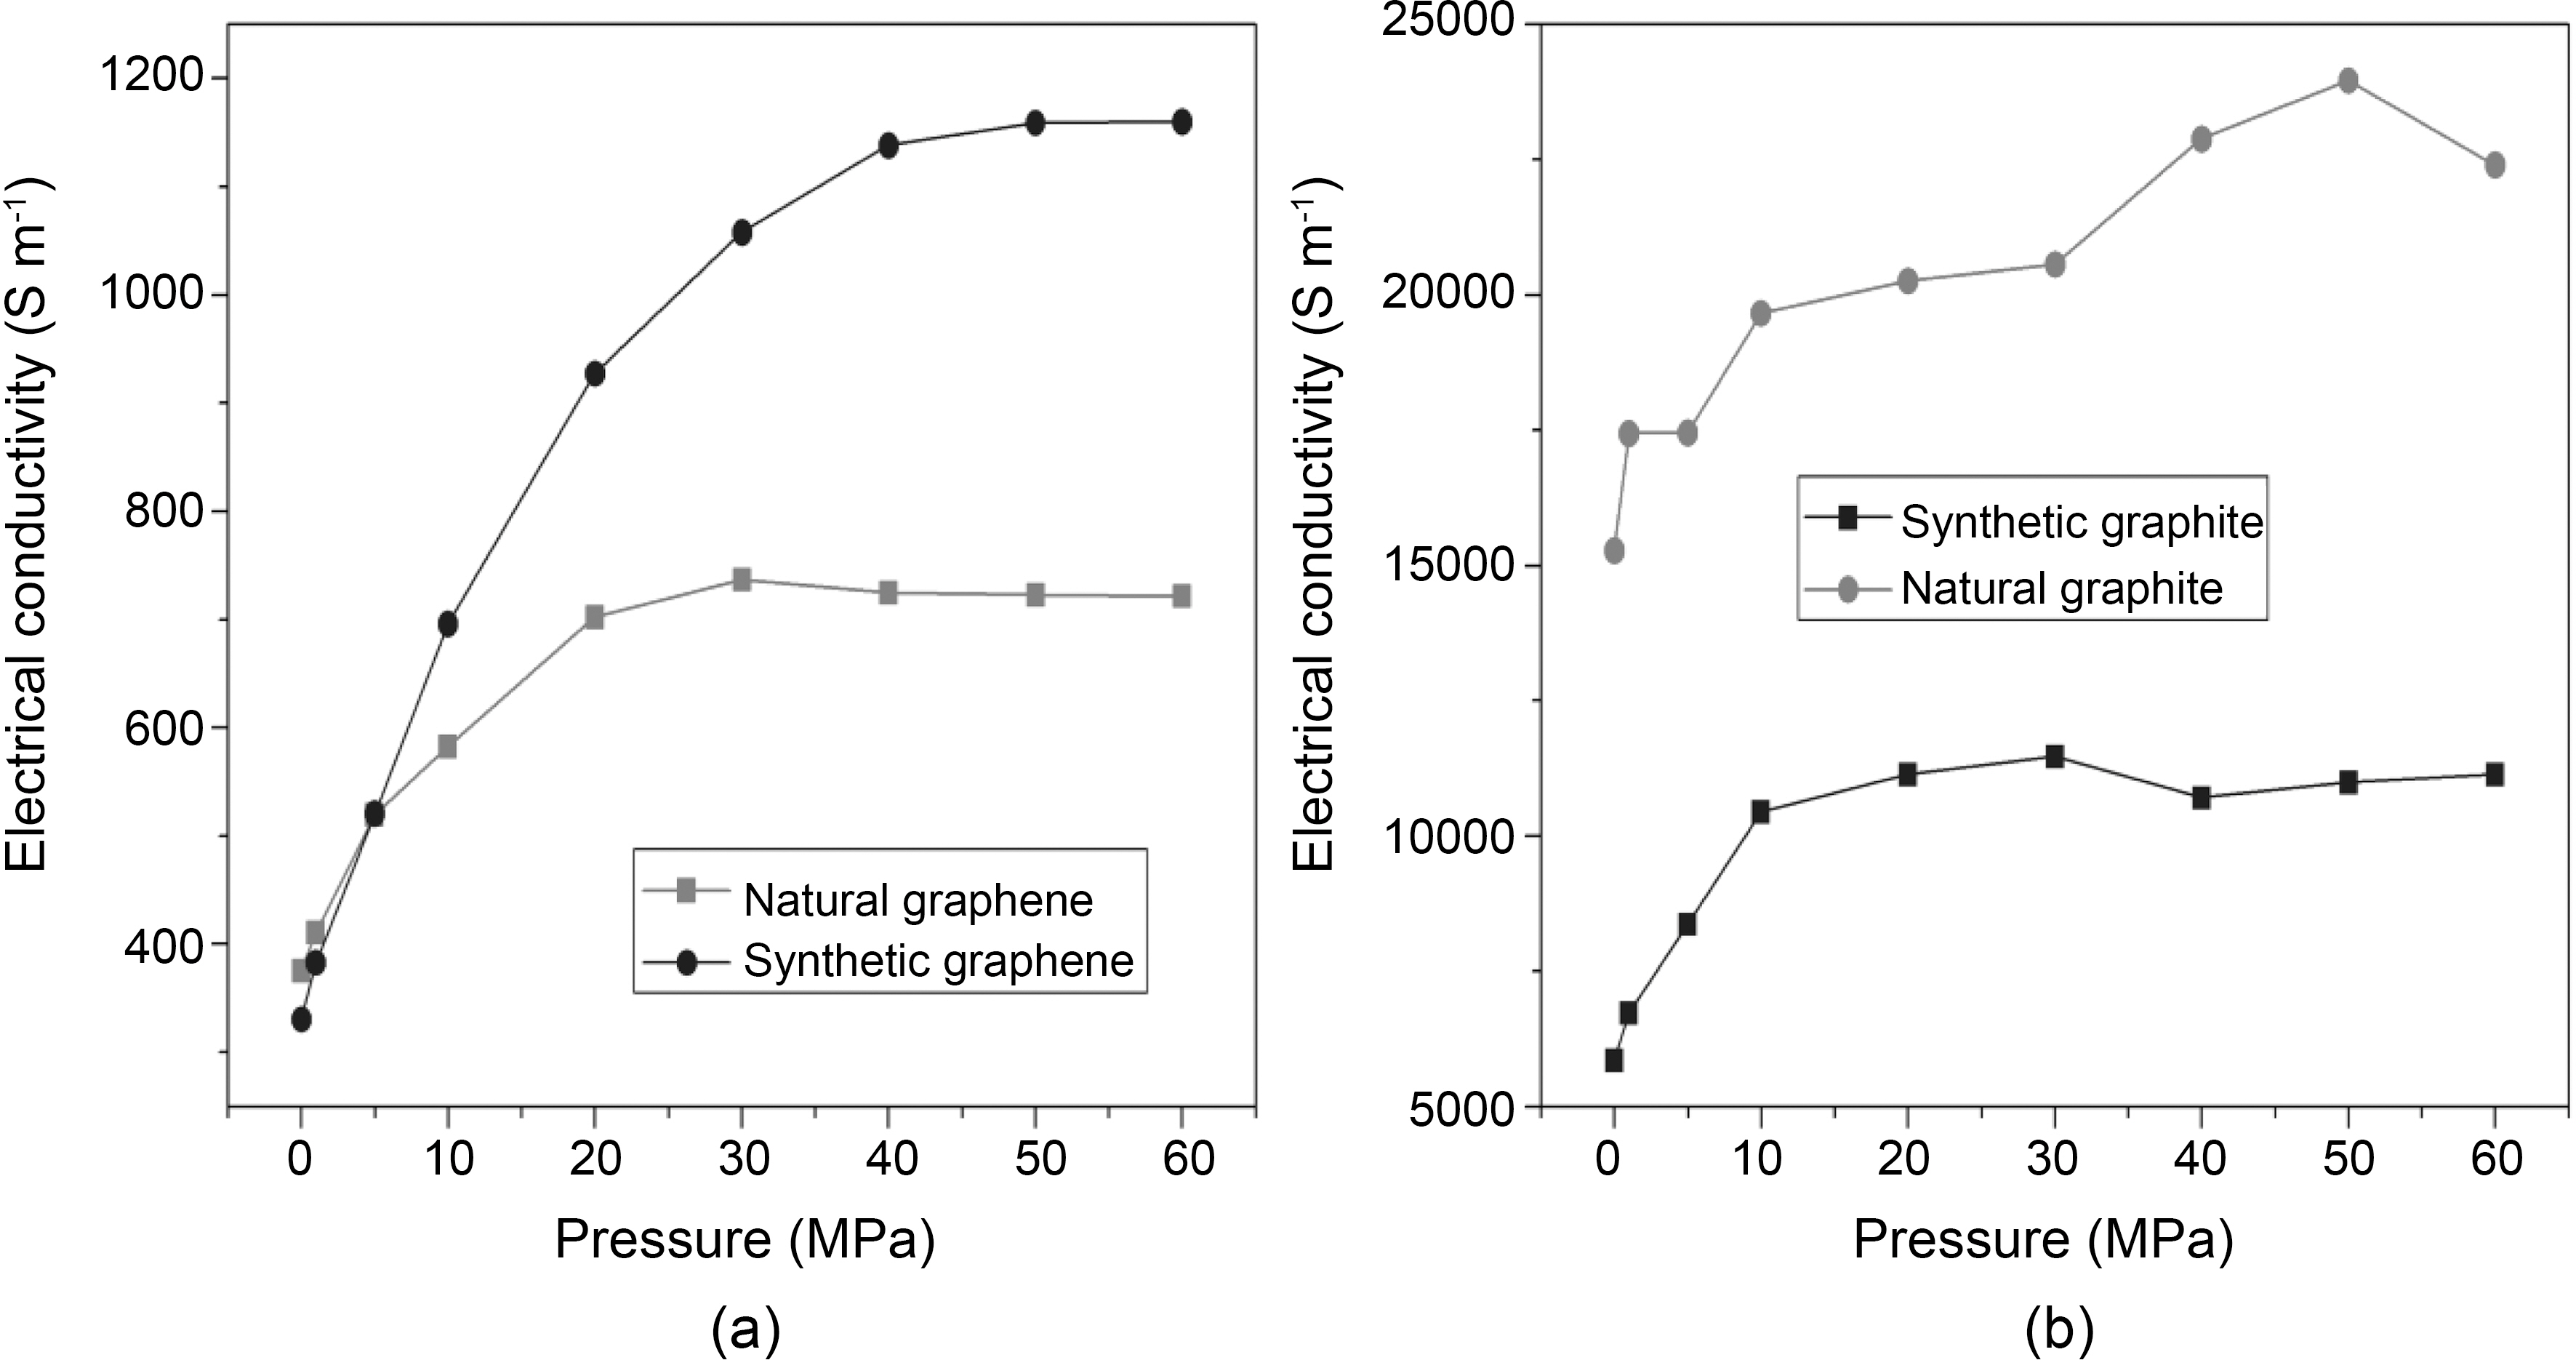
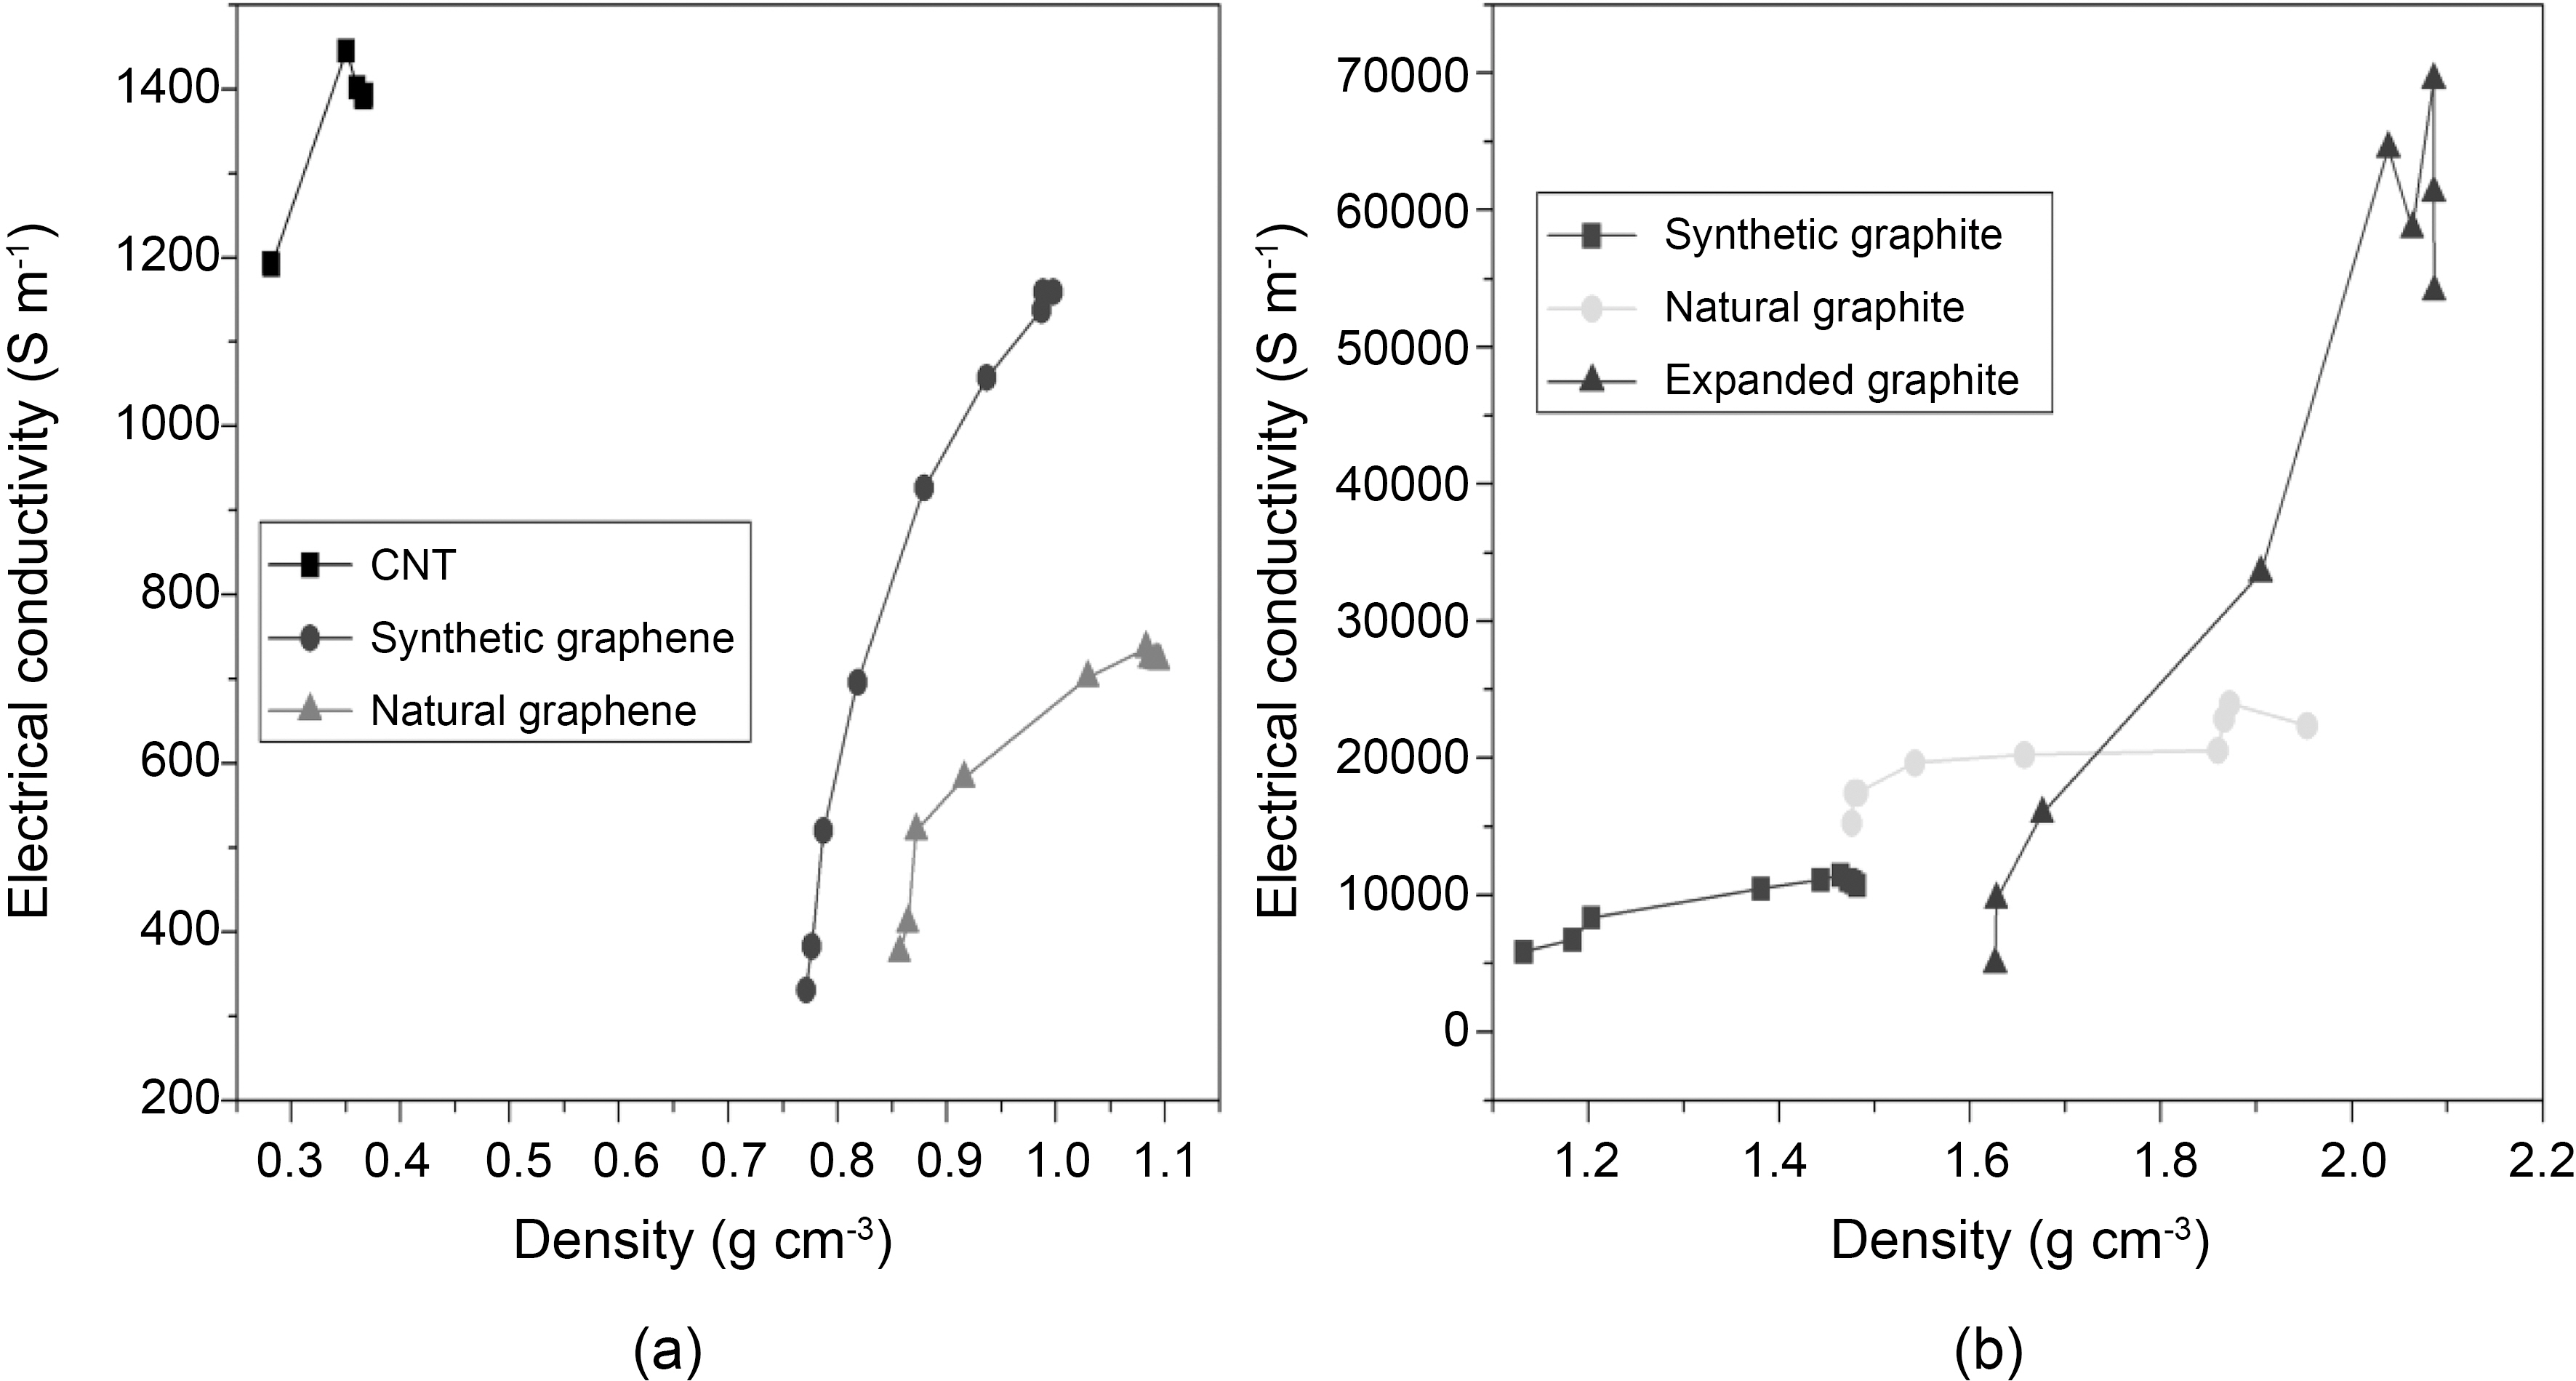
The electrical behavior of chemically reduced natural and synthetic graphene as well as natural and synthetic graphite under compression (0.3 to 60 MPa) is presented in Fig. 4a-4b. All graphene and graphite show large increase in electrical conductivity at pressure up to 30 MPa. On the other hand, electrical conductivity of synthetic graphene is increased by increasing applied pressure up to 40 MPa. At 30 MPa, the electrical conductivity of synthetic and natural graphene is ~1000 and ~700 S m-1, respectively. However,when we consider graphite materials, the electrical conductivity is higher for natural graphite (~20,000 S m-1 at 30 MPa) compared to synthetic graphite (~11,000 S m-1 at
[Table 1.] Percentage Increase in Electrical Conductivity (PIEC) at Different Pressure
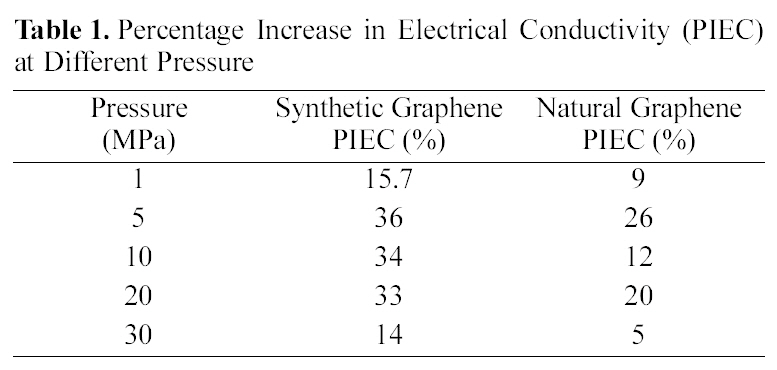
Percentage Increase in Electrical Conductivity (PIEC) at Different Pressure
30 MPa). Synthetic graphite has higher purity and consists mainly of graphitic carbon that has been obtained by graphitization, heat treatment of non-graphitic carbon, or by chemical vapors deposition from hydrocarbons at temperature above 2100 K [16]. The whole synthetic graphite tends to be of a lower density, higher purity, and higher electrical resistance. Our results for natural and synthetic graphite are consistent with the previous report [16]. However, after reduction of graphite oxide into graphene, synthetic graphene has higher electrical conductivity compared to natural graphene, which might be due to the higher purity of synthetic graphite. Under these conditions, we calculated the percentage increase in electrical conductivity (PIEC) and found that synthetic graphene showed 15 to 36% PIEC when applied pressure was increased from 1 to 5MPa. Whereas at the same applied pressure range, only 9 to 26% PIEC is found in natural graphene. The PIEC of synthetic graphene and natural graphene at different pressure are presented in Table 1. PIEC is calculated by the following formula: PIEC = (σ2-σ1) /σ1×100, where σ2 and σ1 show the values of electrical conductivity at different applied pressures respectively.
Next, we examined the electrical behavior with respect to density of different graphite and graphene materials. Fig. 5 clearly shows the differences in the electrical conductivity of all carbon materials according to the density. For comparison,electrical conductivities of CNTs and expanded graphite were also measured. The increase in electrical conductivity trend was found in the following order: Natural graphene < Synthetic graphene < CNTs < Synthetic graphite < Natural graphite < expanded graphite. We observed two groups of materials. As seen in Fig. 5b, denser materials have higher electrical conductivity. Expanded graphite is the densest material which shows higher electrical conductivity compared to natural and synthetic graphite. Electrical conductivity is greater in the following order according to material density:Synthetic graphite (~11000 S m-1, 1.47 g cm-3) < Natural graphite (~22000 S m-1, 1.95 g cm-3) < Expanded graphite (~54000 S m-1, 2.08 g cm-3). On the other hand, the opposite trend is observed in CNTs, synthetic and natural graphene. CNTs (~1300 S m-1, 0.36 g cm-3) are lighter than synthetic graphene (~1100 S m-1, 0.99 g cm-3) and natural graphene(~700 Sm-1, 1.09 g cm-3) and show higher electrical conductivity. The same behavior is observed when both graphene are compared. Synthetic graphene compared with natural graphene shows low density and high electrical conductivity. The electrical conductivity shown in Fig. 5a is increased with respect to the lower density material in the following order: CNTs (~1300 S m-1, 0.36 g cm-3) > Synthetic Graphene (~1100 S m-1, 0.99 g cm-3) > Natural Graphene (~700 S m-1,1.09 g cm-3). The electrical conductivity depends on the number of effective contacts that are established between all carbon type materials under compression. The number of electrical contacts increases due to the forced approach of
the particles belonging to the neighboring aggregate [11]. Since particles are closer for denser materials, a smaller increase in density would increase the electrical conduction. For graphene and CNTs, layers would be more important factor than aggregate particles. The least dense material showed a higher electrical conductivity which may be due to the morphological difference in the arrangement of single layer of graphene.
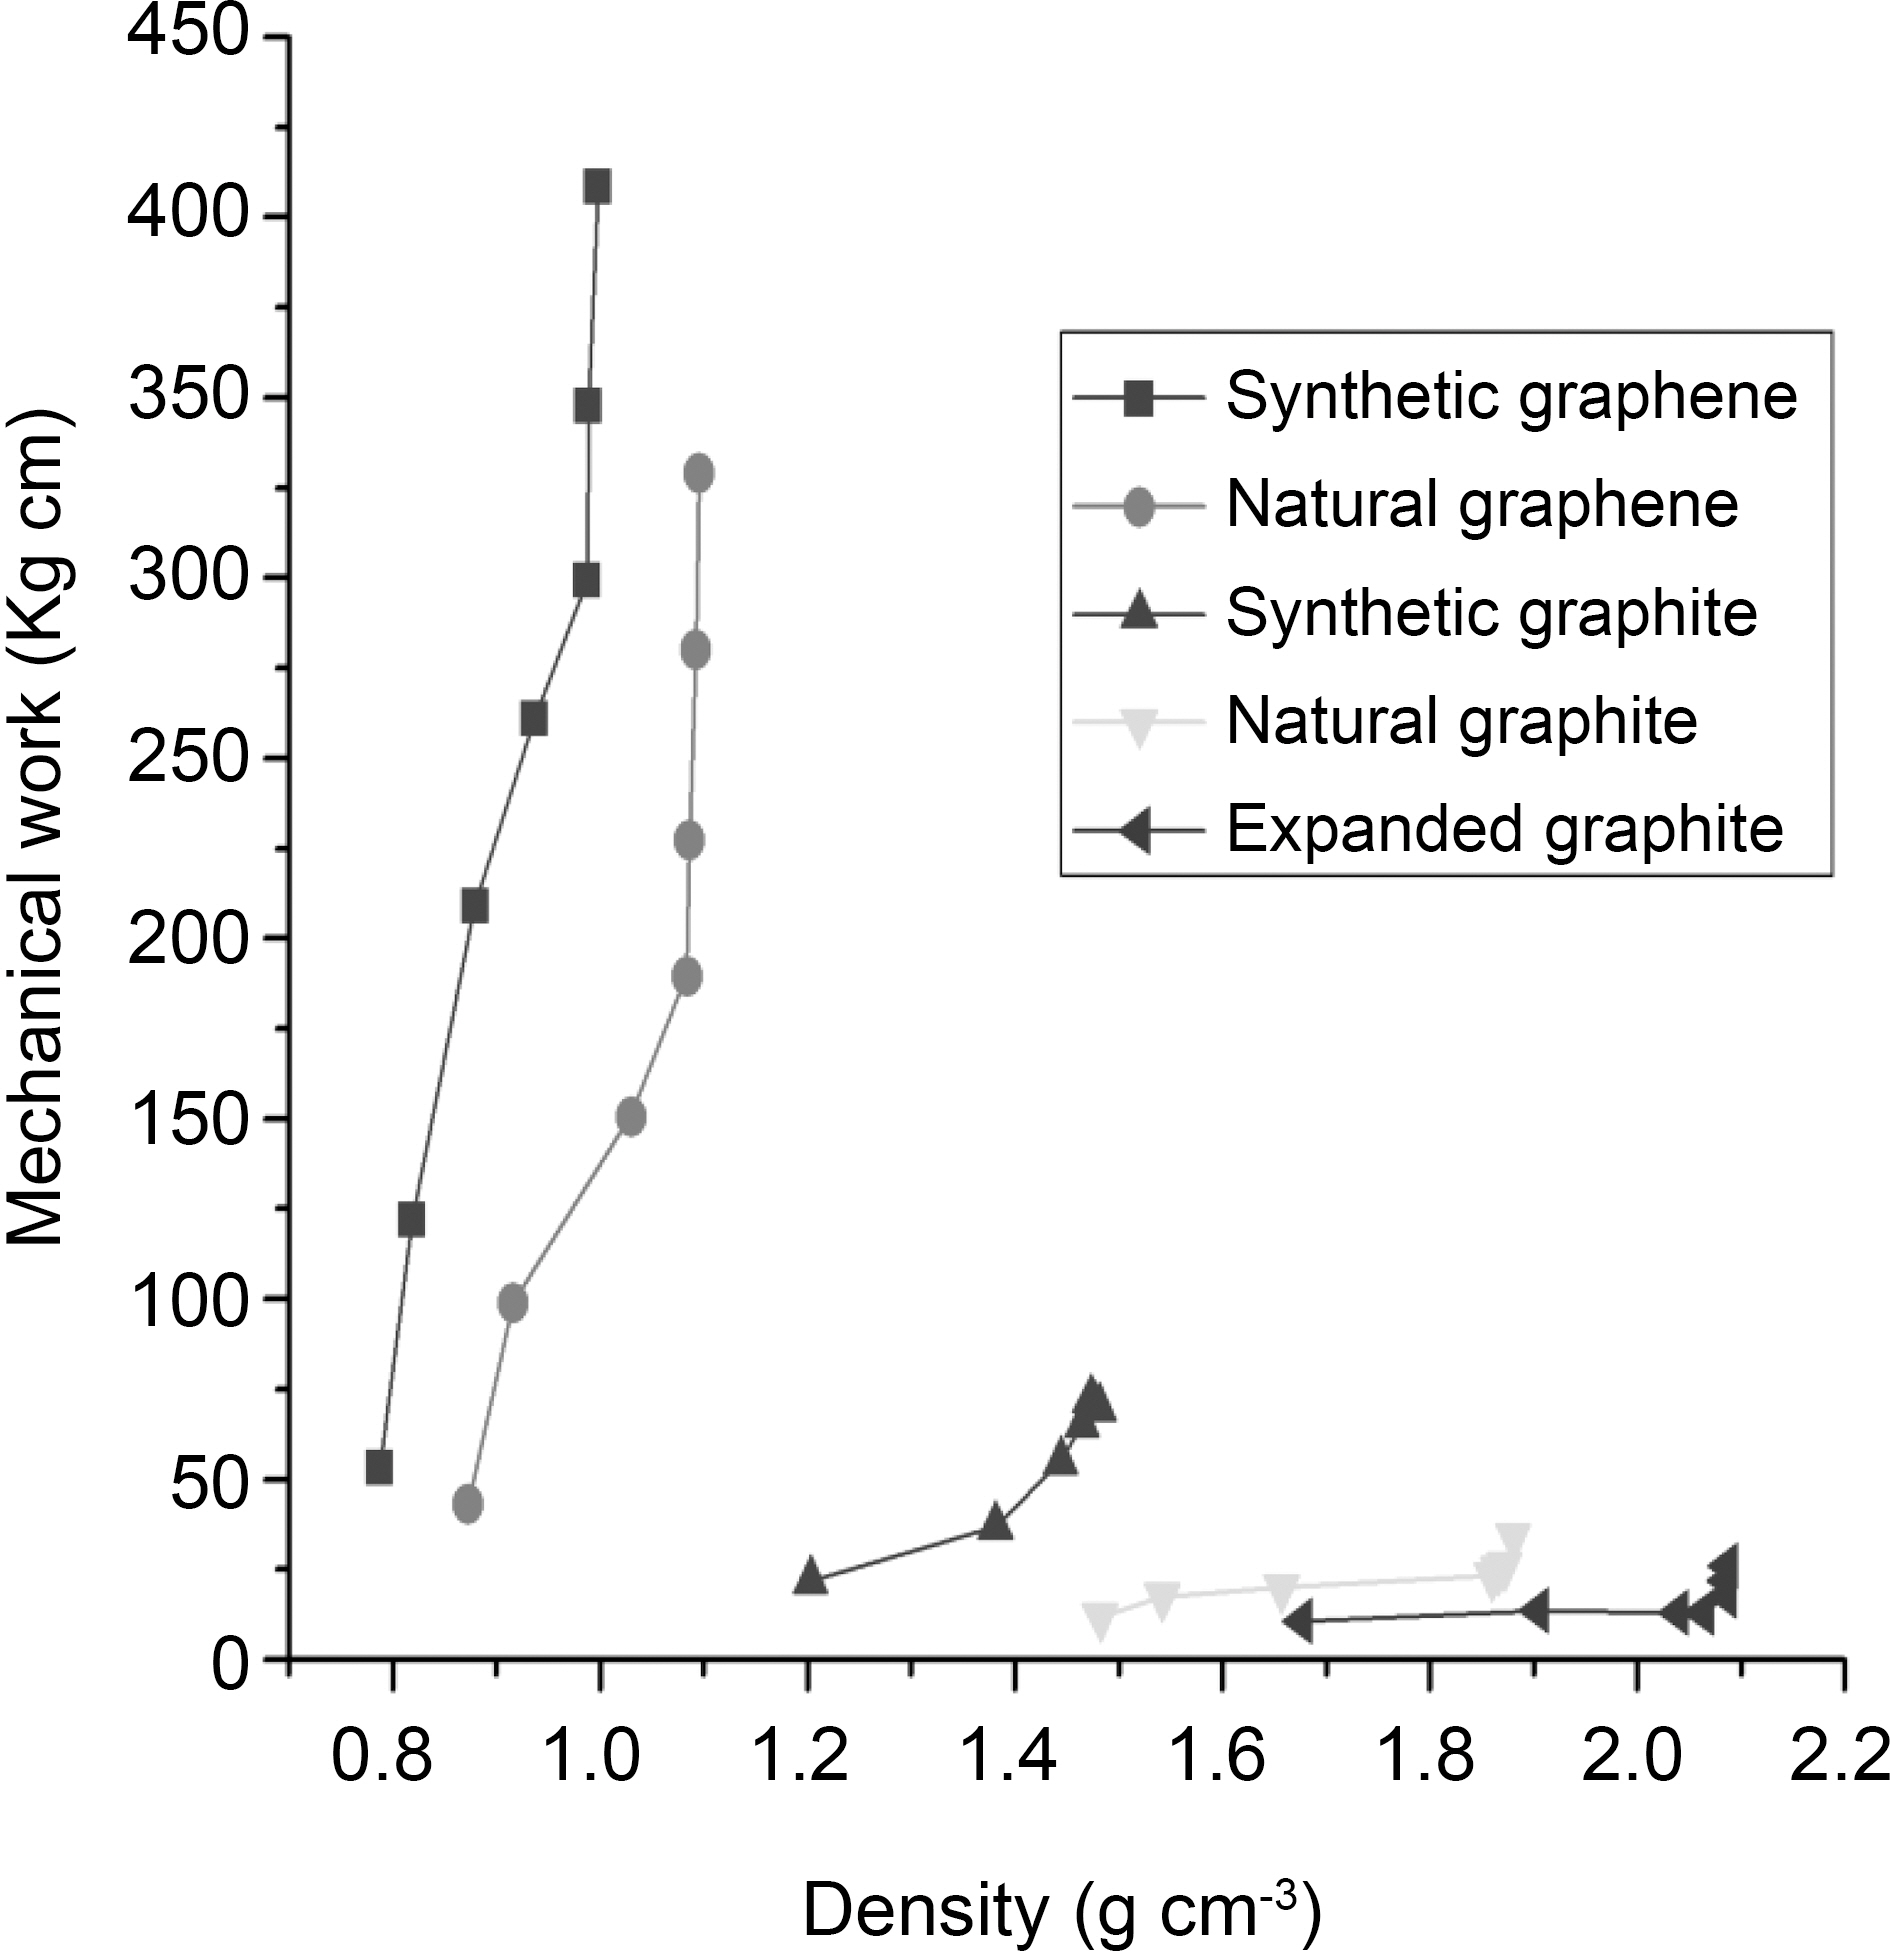
Further, we analyzed the data by calculating the mechanical work through compression of graphite and graphene materials to a given value of the density. The mechanical work was estimated by following formula [9]:
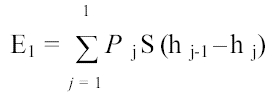
where E1 is the mechanical work, Pj is the pressure corresponding to the thickness hj. It is observed in Fig. 6 that the slope of the curves increases more sharply with both graphene materials than graphite materials. However, synthetic graphene requires more energy to increase the apparent density (~400 kg cm at 0.99 g cm-3) than natural graphene (~300 kg cm at 1.09 g cm-3). Whereas at the same density of 0.87 g cm-3, synthetic as well as natural graphene require ~200 and ~50 kg cm mechanical work, respectively. Synthetic, natural, and expanded graphite required much less energy to change their apparent density than graphene materials. This means that graphene requires higher mechanical work to compress than graphite materials.
Synthetic and natural graphenes were successfully synthesized via chemical route, which was confirmed from SEM, XPS, and TGA. Electrical conductivity of various powdered carbon materials under compression was measured and compared. The decrease in volume under compression depends on material type as well as the applied pressure. PIEC of synthetic graphene was higher than that of natural graphene. Carbon materials with macroscopic size and higher density such as graphites showed higher electrical conductivity. However, in the case of nanocarbon materials including graphene and CNTs, the trend is opposite: denser materials showed lower conductivity. Mechanical energy required for increasing the apparent density for both natural and synthetic graphene is much higher than other graphite materials.