Biocompatible polymers can be one of the most useful devices to release drugs in a more effective, longer, and safer manner [1-5]. Natural polymers such as sodium alginate and chitosan have received much attention in drug delivery systems for their excellent biocompatibility [6-7]. Alginate is composed of two uronic acids, α-l-guluronic and β-dmannuronic acids [8-10]. Chitosan is a weak cationic polysaccharide, composed mainly of (1,4) linked 2-amino-2-deoxy-β-D-glucan. Owing to amino groups in the chitosan molecule and carboxyl groups in the alginate molecule, they show pH-sensitivity as drug carriers, and the interaction between alginate and chitosan had been systematically investigated [11-13]. The strong positive charges on chitosan make it a very effective mucoadhesive as it can strongly interact with the negatively charged mucous membrane. Several chitosan-based bioadhesive and drug/vaccine delivery systems are currently under development [14]. Chitosan beads with good chemical and mechanical stability have been made by controlling their swelling behavior through selection of bead material according to chemical structure and molecular weight, as well as by controlling the kinetics of the bead formation [15]. The polyelectrolyte complex has been widely used to obtain devices for the controlled releasing of drugs [16].
Activated carbon is one of the most effective adsorbents for organic compounds because of their extended surface area, high adsorption capacity, micro porous structure and specific surface activity [17-18]. Coconut shell-based activated carbon (AC) is an effective candidate for drug adsorbent because it has mainly micro pores to meso pores.
The purpose of this study was to investigate the possibility of AC as an effective drug reservoir for the sustained release from alginate-chitosan blend (ALCH) systems. AC was incorporated to control both the drug-loading behavior and the releasing properties of ALCH. The effect of AC on the drug release behavior from ALCH system was studied in terms of pH-dependent solubility and sustainability. The model drug, coomassie brilliant blue R-250, was selected to maximize the visual evidence of both the releasing from ALCH and the retaining in AC.
AC was purchased from Dong Yang Tanso Co. (Korea). Before using it, washing process was carried out at 100℃ for 2 h using mixed acids of sulfuric (35 wt%) and nitric (20 wt%) acids with weight ratio (1:1). Alginic acid sodium salt (from brown algae, viscosity of 2% solution at 25℃ :~250 cps), chitosan (≥75% deacetylation), and calcium chloride (CaCl2) were obtained from Sigma Chemical Company. Coomassie brilliant blue R-250 (CBB) (C47H50N3O7S2+) (λmax =583 nm), the model drug, was obtained from Bio-rad.
2.2. Preparation of alginate-chitosan blend containing activated carbon
The blend solutions were prepared by mixing sodium alginate
[Table 1.] Feed Compositions of ALCH-AC
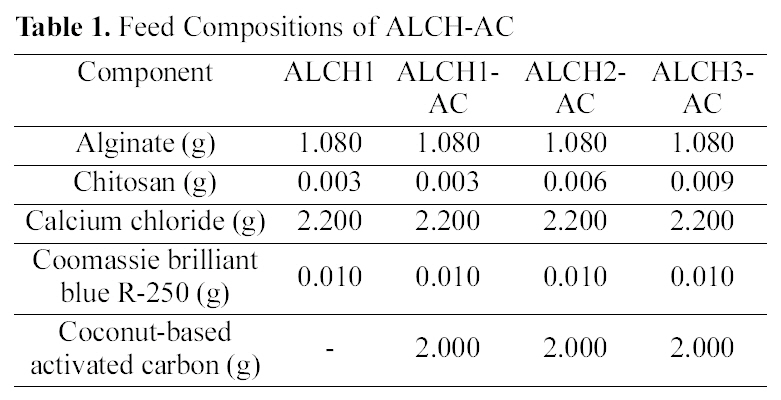
Feed Compositions of ALCH-AC
(4.0 wt%) and chitosan (0.1, 0.3, 0.5 wt%) with mass ratio of 9:1, respectively, under stirring at 40℃ for 20 min. AC was introduced to form the homogeneous dispersion in blend solutions. The solution concentration was optimized to give successful processing in both micropumping the polymer solution and dispersing AC in polymer solution by mechanical agitation. The blend solutions containing AC were dripped into the 100 ml solution of calcium chloride (2.0 wt%) through the injection needle. The smooth and spherical beads were formed by mechanical stirring at room temperature for 15 min. The beads were washed with distilled water three times by replacing fresh distilled water every few hours and dried under vacuum at 40℃. The feed composition and preparation conditions of ALCH and alginate-chitosan blend containing AC (ALCH-AC) are summarized in Table 1.
2.3. Characterization of alginate-chitosan blend containing activated carbon
2.3.1. FT-IR
Fourier transform infrared (FTIR) spectra of ALCH-AC were recorded on a Nicolet 510 FTIR spectrometer, from 400 to 4000 cm?1 with a nominal resolution of 2 cm?1. The samples were pressed into tablets with potassium bromide (KBr).
2.3.2. XPS
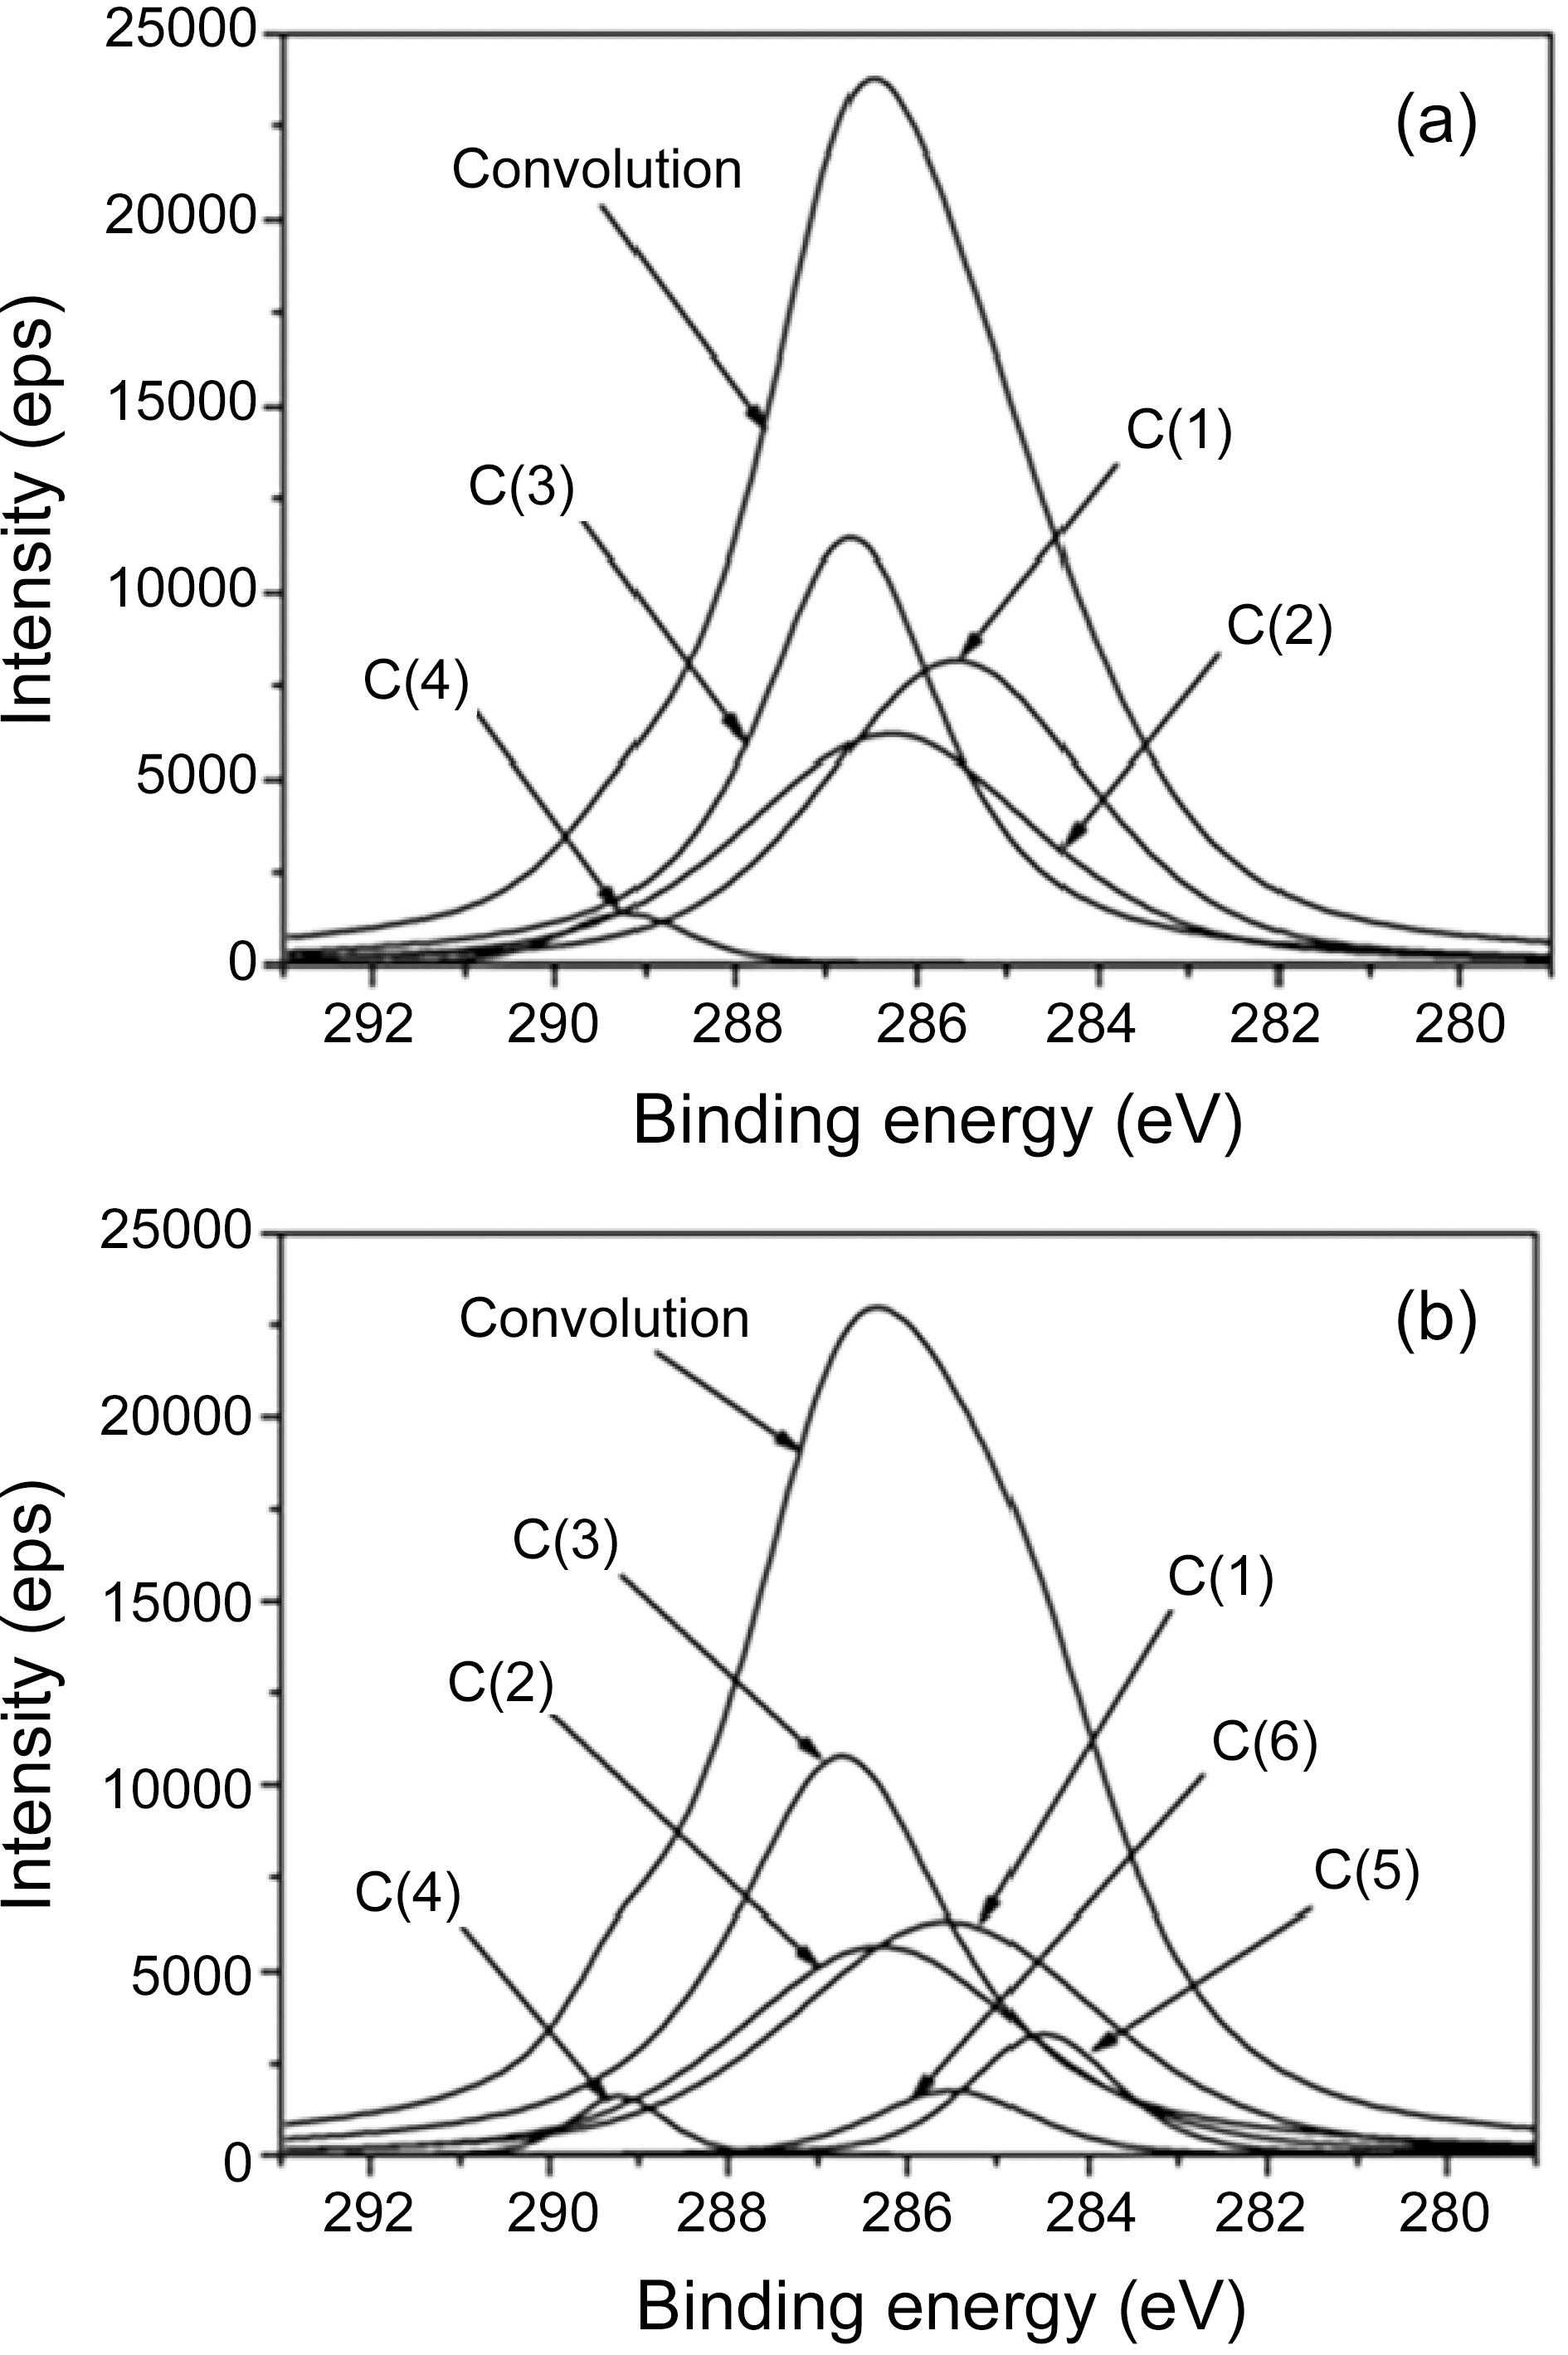
X-ray photoelectron spectroscopy (XPS) measurements were carried out with Multilab 2000 spectrometer using Al Kαradiation (1458.6 Ev) under a vacuum of 2×10?8 Pa to investigate the changes of chemical species on the surface of ALCH before and after incorporation of AC. Narrow-scan photoelectron spectra were recorded for the C 1s, O 1s, and N 1s regions. To compensate for charging effects, binding energies were corrected for covalent C 1s at 285.56 eV after curve fitting.
2.3.3. SEM
The morphology of samples was investigated using JSM-7000F (Jeol, Japan) scanning electron microscope. As a pretreatment, samples were vacuumed up to 10?3 Pa and sputtered using Pt. The SEM images were obtained at 10 keV.
2.3.4. BET analysis
In order to investigate the pore structure such as specific surface area, pore volume, and micropore fraction, BET apparatus (ASAP 2020) was used. Every sample was degassed up to 10?3 Pa and then, nitrogen gas (99.9999%) adsorption was carried out at 77 K. Specific surface area (S.S.A.) was calculated by using BET equation and the fraction of micropore surface area was measured by HK (Horvth-Kawazoe) method.
2.3.5. Drug release behavior
The release behavior of CBB from ALCH-AC was investigated in pH 2, 7 and 10 buffer solutions, respectively. The cumulative amounts of released CBB were measured by UV/VIS spectrophotometer (Optizen 2120 UV, Mecasys, Korea) at a wavelength of 583 nm. At each point, the buffer solution was removed and replaced with fresh one to reduce the experimental error. All release studies were carried out in triplicate. The results were presented in terms of cumulative release as a function of time:
Cumulative amount released (%) = (Mt/M)×100,
where Mt is the amount of drug released from the ALCHAC at time t and M is the amount of CBB pre-loaded in AC.
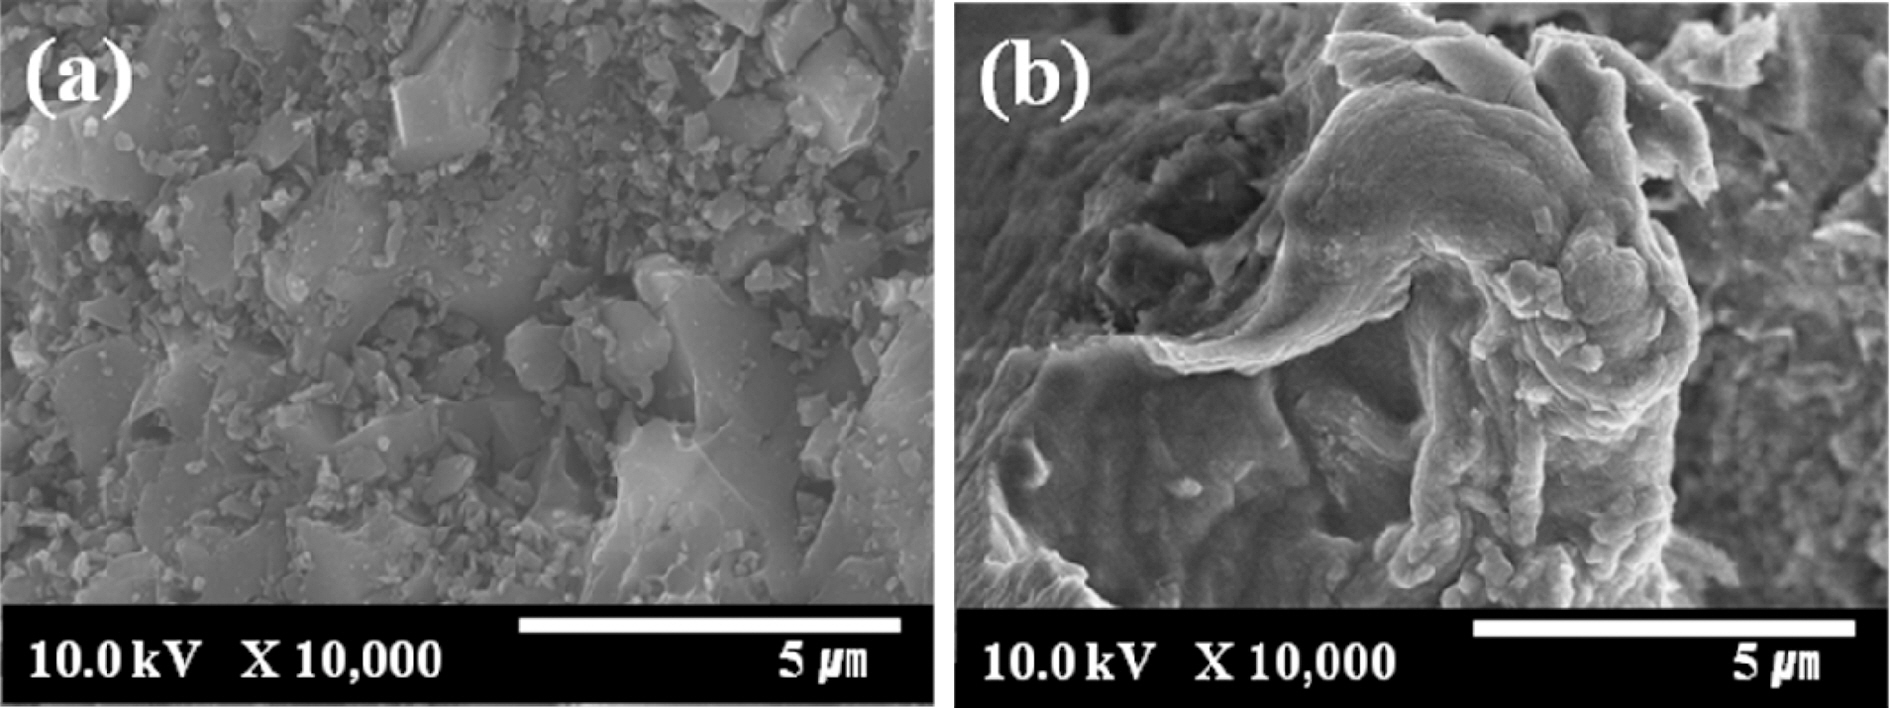
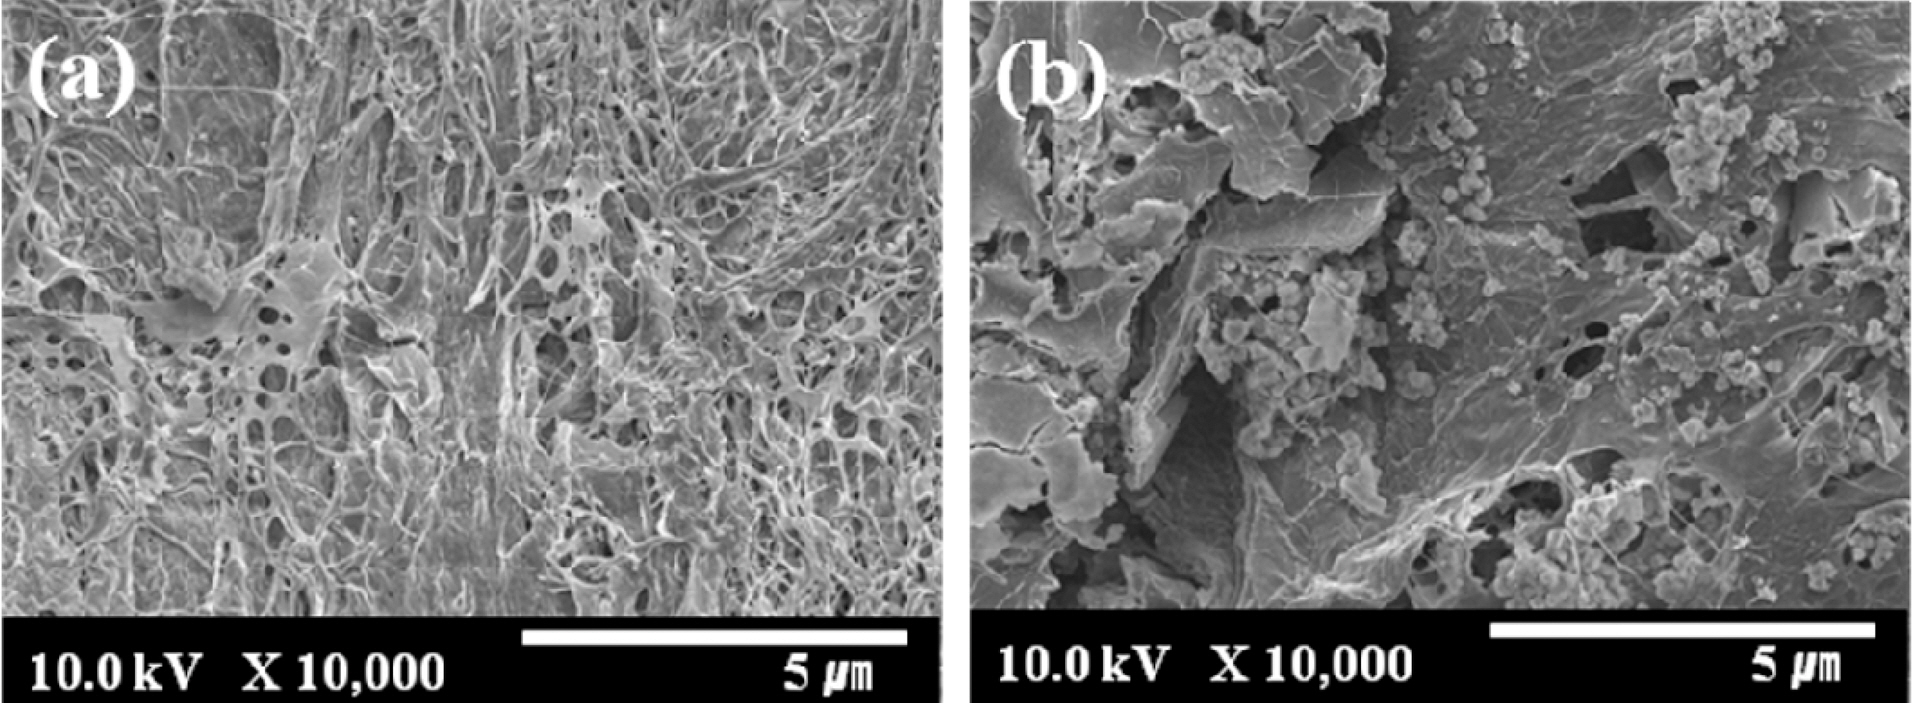
3.1. Morphology of alginate-chitosan blend containing activated carbon
The SEM images of ALCH-AC are presented in Fig. 1. AC did exist in the ALCH to form a new phase: AC in ALCH, although some AC was aggregated. As can be seen from Fig. 1, AC was uniformly distributed in the ALCH matrix and retained the similar surface structure as that of pristine AC.
3.2. Interaction between alginate-chitosan and activated carbon
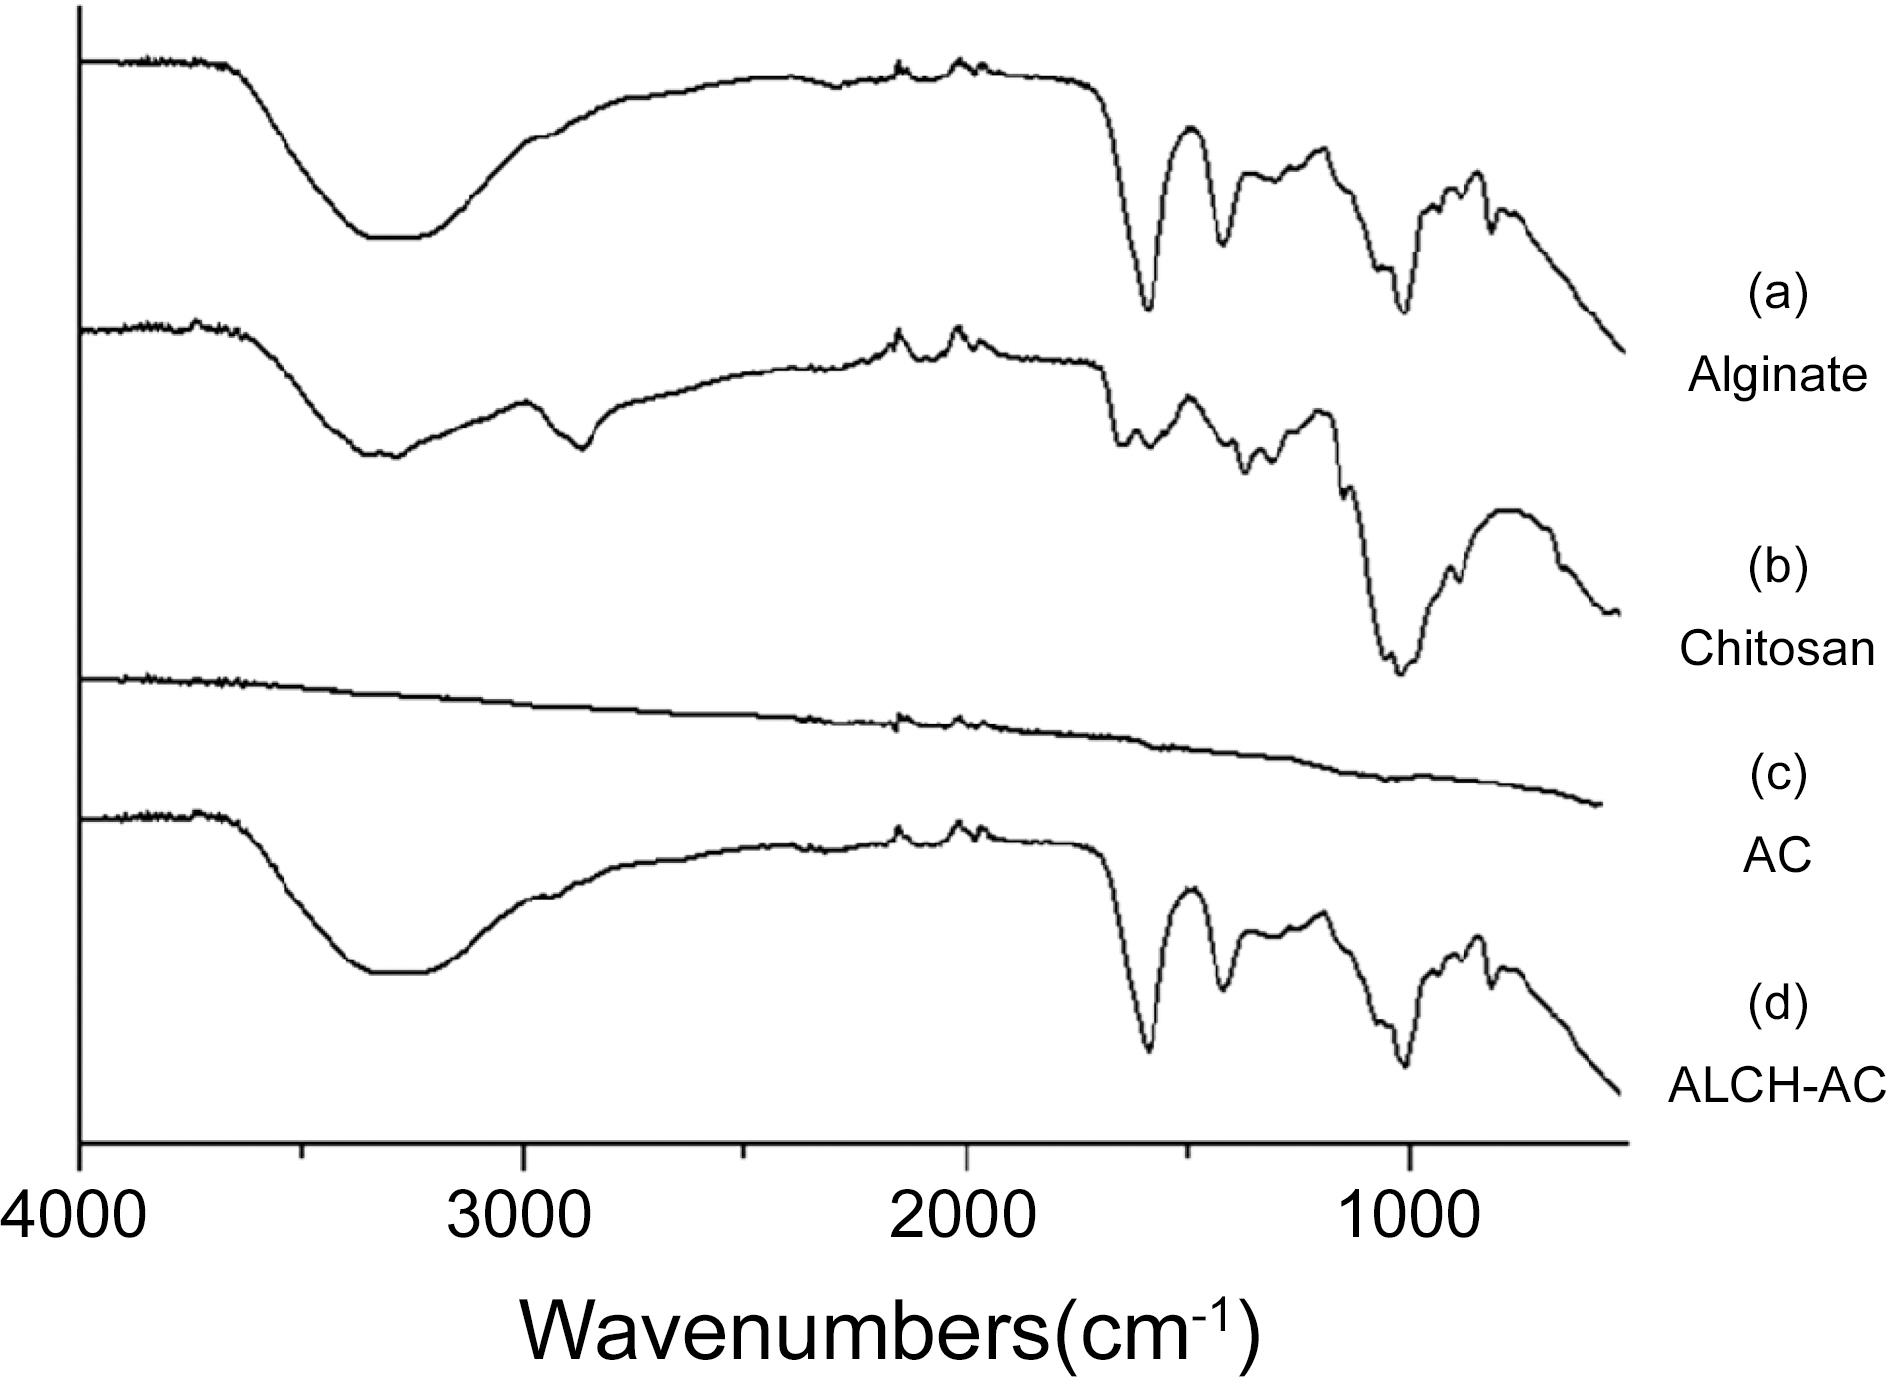
The molecular structures of the ALCH-AC were studied by FTIR and XPS. Fig. 2 shows the FTIR spectra of alginate, chitosan, AC, and ALCH-AC. In the spectrum of alginate, the strong peak at 1720 cm?1 is in correspondence to the C=O stretching vibration, while the peak at 2925 cm?1 is related to the asymmetric stretching vibration of C-H. In
the spectrum of chitosan, peaks at 3500 and 3240 cm?1 are due to the N-H stretching vibrations. All the peaks in the spectra of both alginate and chitosans were observed in the ALCH-AC.
In order to investigate the reasons which resulted in the
[Table 2.] Textural Properties of AC
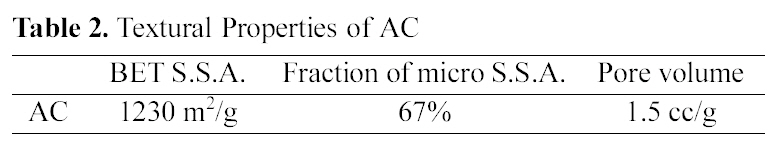
Textural Properties of AC
[Table 3.] C1s Peak Parameters of ALCH and ALCH-AC
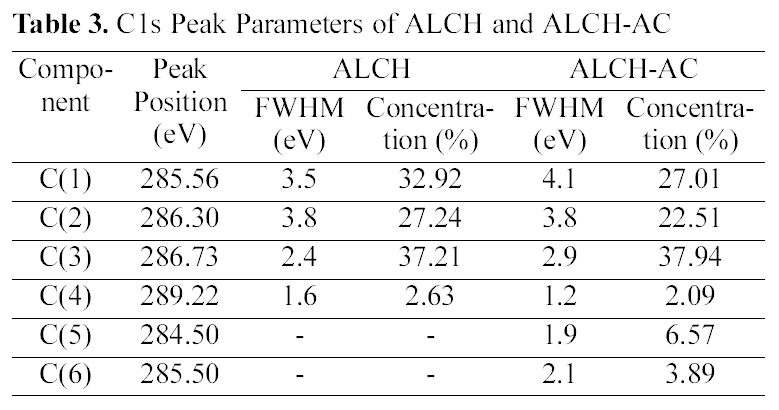
C1s Peak Parameters of ALCH and ALCH-AC
[Table 4.] Energy Shifts and Assignments of the Different Component of C1s Spectra
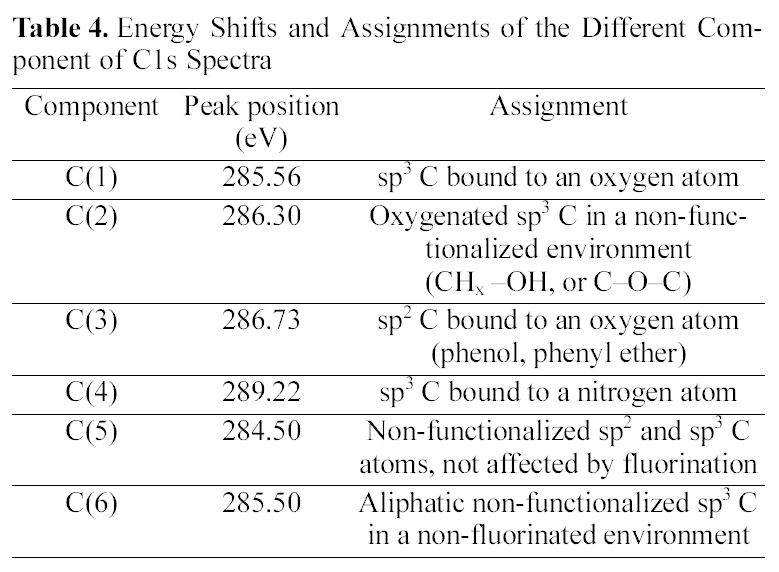
Energy Shifts and Assignments of the Different Component of C1s Spectra
difference in the drug release, the surface chemical structure of ALCH-AC was studied by using XPS as shown in Fig. 3 and Table. 3 and 4. Regarding the deconvolution of C1s, it was sure that the surface of ALCH-AC had more sp3 and sp2 representing AC peak. The increased sp3 and sp2 peak of AC is believed to play an important role in the higher adsorption of drug and more prolonged release of drug from the ALCH-AC.
The textural property of AC is presented in Table 2. The BET S.S.A. of AC was 1230 m2/g. The fraction of micropore structure was 67% and the total pore volume was 1.5 cc/g. The highly developed pore structure was believed to contribute to the efficient loading and sustained releasing of the drug due to the excellent adsorbing properties.
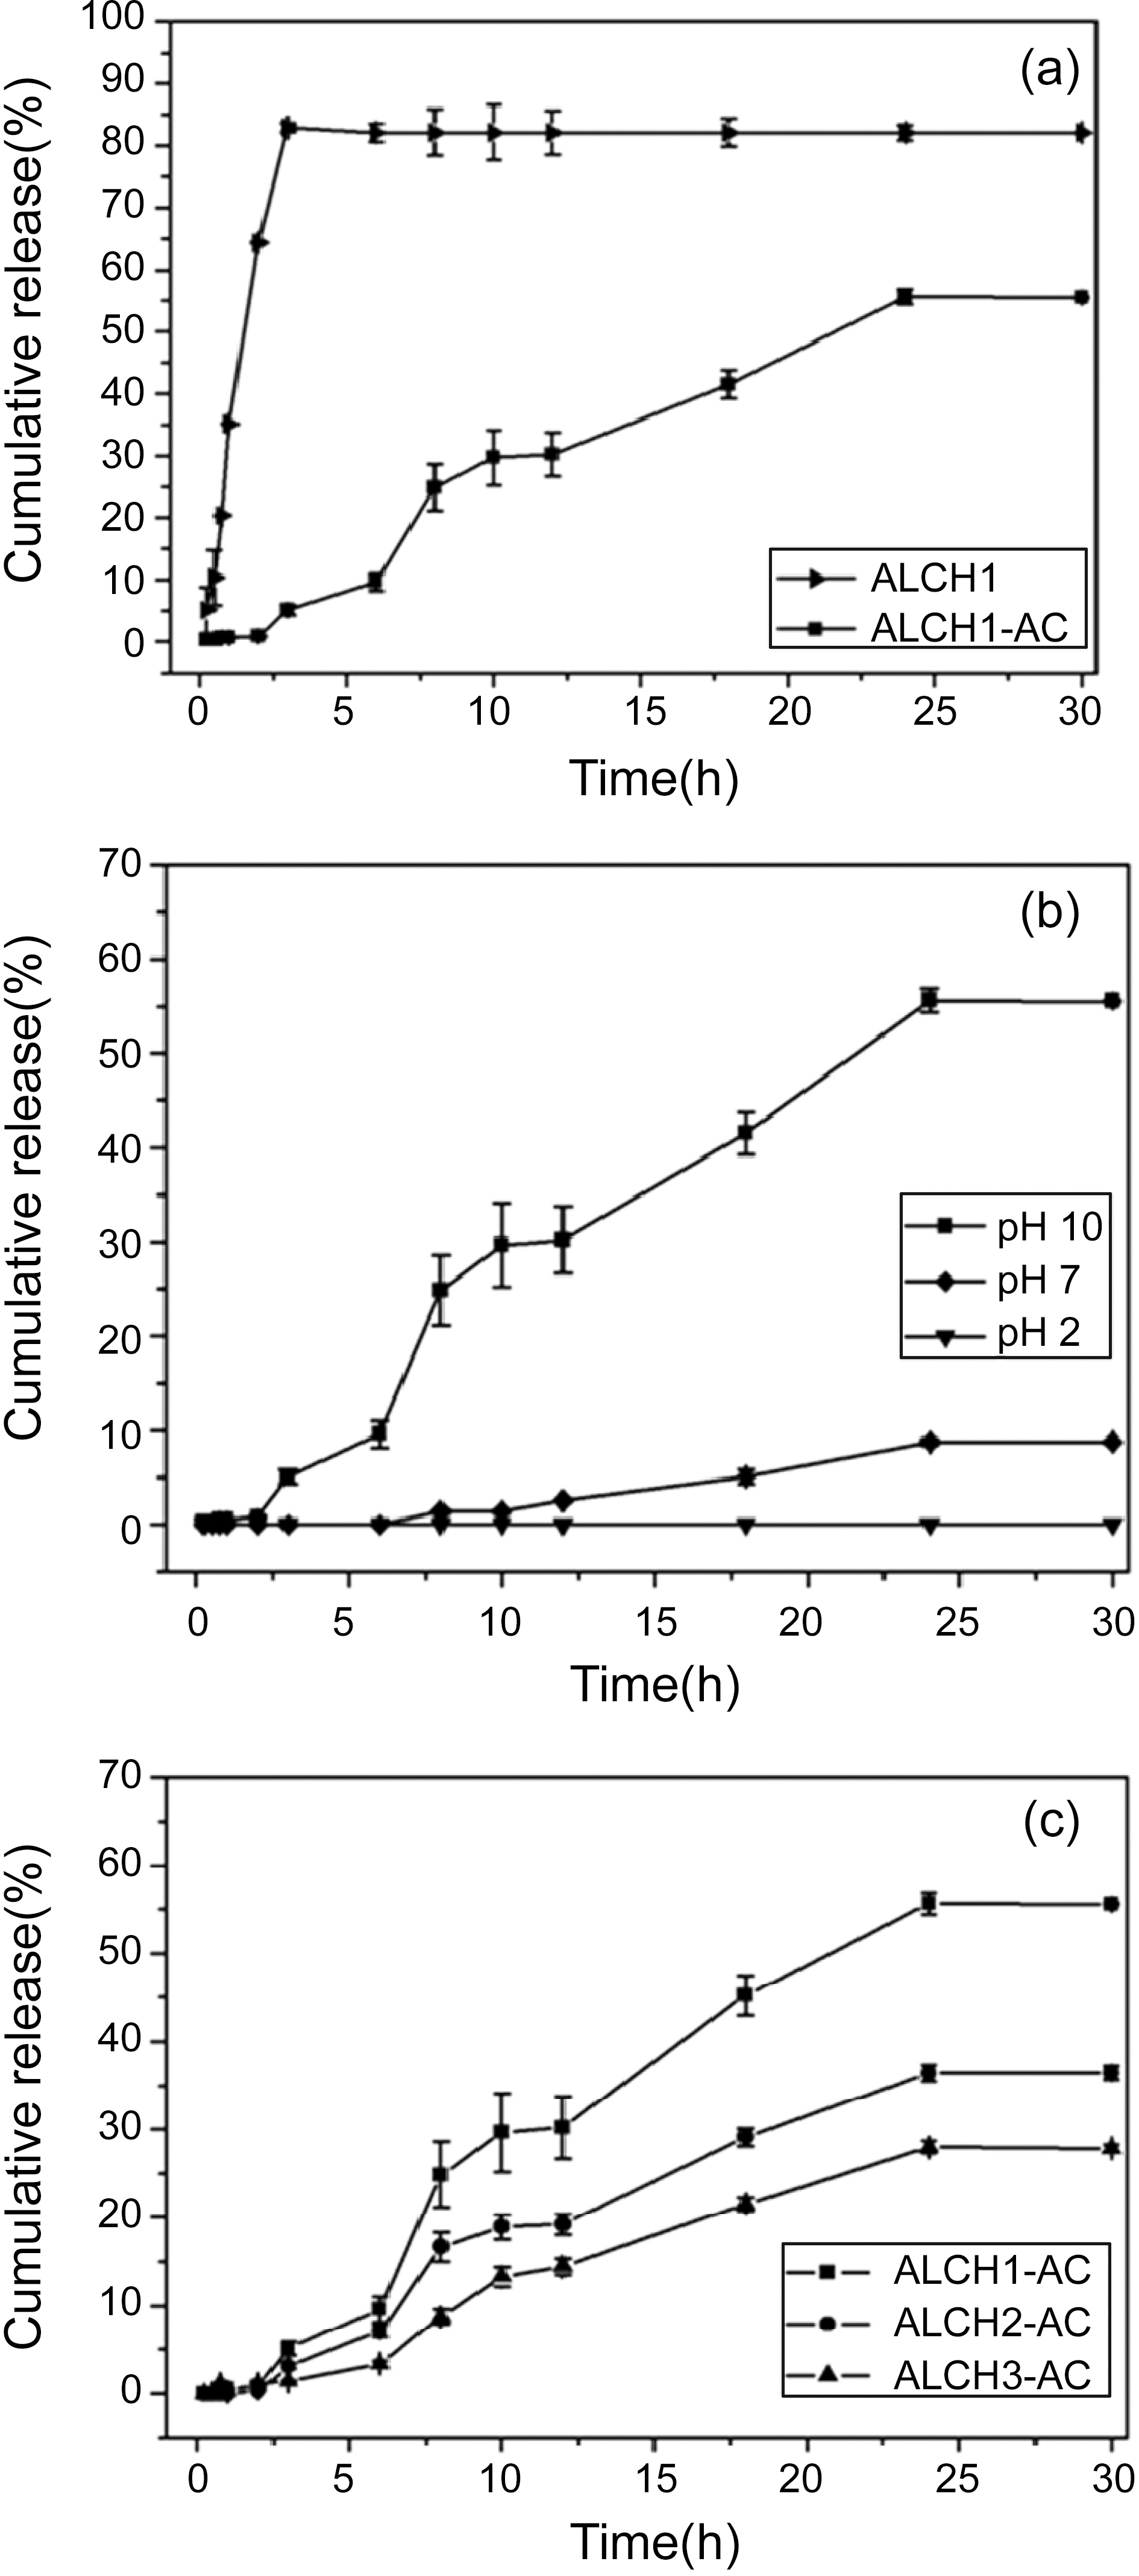
CBB was used as a model drug which was loaded in the AC reservoir. The drug release profile from ALCH-AC is shown in Fig. 4. The drug release behavior of ALCH-AC was quite different depending on the incorporation of AC. Degrees of
drug release from the ALCH-AC and the control ALCH at pH 10 were about 55 and 85%, respectively. In addition, the ALCH-AC gave the prolonged period of release over 24 hours to allow the sustained release of drug. The released amount of drug from the ALCH-AC was increased rapidly as the pH increased into basic condition due to the selective dissolution of alginate from blend matrix. The pH-responsive ALCH
could control the release of drug successfully depending on the degree of selective dissolution of alginate by changing pH of the release media. Meanwhile, the released amount of drug from the ALCH-AC was decreased rapidly as the content of chitosan increased in the blend because the difficult dissolution of chitosan in the basic media limited the release of the drug effectively.
3.5. Surface morphological change of alginate-chitosan blend by blend composition
The effect of chitosan content on surface morphology of ALCH was investigated using SEM as shown in Fig. 5. When the content of chitosan was lower in the blend, the alginate could be dissolved selectively in the basic media to result in a network structure containing well-developed micro pores which played an important role in the faster release of drug retained in AC. However, as the content of chitosan increased in the blend, the chitosan could prevent the alginate from dissolving in the basic media effectively. Therefore denser surface with less micro pores was observed for the ALCH with higher content of chitosan. These morphological results accorded with the release results shown in Fig. 4.
The drug was loaded efficiently and released from the pHsensitive ALCH-AC for a prolonged period due to the highly developed pore structure of AC. ALCH-AC showed the higher dissolution of alginate as the pH increased resulting in the network structure containing well-developed micro pores to give the faster release of the drug retained in AC.ALCH-AC showed a higher release of the drug as the content of chitosan decreased. The released amount of drug from the ALCH-AC bead was controlled easily by changing either blend composition or pH of the release media.