Various aromatic compounds (mainly phenol and its derivatives) are raw materials and/or basic products of the chemical industry. As a result, they are widely found in the effluents of these industries or reach the surface or ground water via use by consumers. These chemicals are very toxic to both flora and fauna as they are not readily biodegradable and therefore, pose environmental problems. In order to eliminate this menace to the environment, various regulatory agencies have set a limit of 1.0 mg L?1 on the concentration of phenolic compounds in the effluent of industries for safe disposal into water bodies [1]. These limits have generally been on the basis of the total phenols present in the effluent.However, among the class of phenolic compounds, susceptibility to removal of these compounds by adsorption and biodegradation may differ. The variety and number of phenolic compounds present in any particular industry’s effluent and their respective concentrations may be time- and spacespecific based on the raw material used and process conditions.
In the present study, one of the derivatives of phenol,namely resorcinol was studied which is a pollutant from industries such as textile, paper and pulp, steel, petrochemical,petroleum refinery, rubber, dyes, plastics, pharmaceutical,cosmetics and also from synthetic coal fuel conversion process waste water. The effluents from the synthetic coal fuel conversion processes may contain high concentrations of resorcinol which varies from a few mg L?1 to more than 1000 mg L?1 [1].
Resorcinol is fatal if swallowed, is a skin and lung irritant,and may cause ethemoglobinemia. It affects the cardiovascular system, central nervous system, blood, liver, and kidneys.Resorcinol is slightly more toxic than phenol. Several studies in the field of wastewater treatment have been done on phenol and activated carbon systems with the objective of determining equilibrium relationships and also for understanding their kinetic behaviour [1].
Organic effluents of intermediate range are normally treated by adsorption operation [2]. Though several other processes like atmospheric catalytic oxidation, biological degradation are available, activated carbons, which have frequently been considered as amorphous carbons, show a very disordered microcrystalline structure in which graphitic micro crystals are randomly oriented. The disorder existing between the graphitic layers due to the concentration of defects in the crystal lattice involves the occurrence of gaps between the micro crystals; such gaps are known as pores and are created during the first step in the preparation of activated carbon from the precursor. Pores are usually occluded or blocked and an adequate activation process leads to a maximum development of the pores and removes carbon atoms from the most reactive zones (i.e., the most external or disordered ones), thereby creating the pores or increasing their number [3]. There are different methods for activation like physical activation and/or chemical activation which involves treatment with chemicals like H3PO4 [4,5], H2SO4[6], Zncl2 [7], HNO3 [8, 9] and steam activation [10].
Charcoal is a basic material used for obtaining activated carbons but is relatively expensive. Alternative sources like rice hull [11], groundnut shell, bagasse [12], chest nut wood[13], rice bran [14] and agricultural by-products are being considered as viable biomass for the production of activated carbon. The biomass is pyrolysed to produce char and then activated to obtain activated carbon, which is used as an adsorbent.
The objective of this work is to produce activated carbon using low cost materials as the precursor for removing resorcinol from aqueous solutions. The adsorption of resorcinol onto activated carbon prepared from Moringa oleifera a precursor which otherwise has very low economic value was carried out. The reason for using Moringa oleifera is, it’s wood, however has no utility and therefore a cause of environmental degradation. Moreover, the tree is normally cut back annually to less than 1 meter and allowed to regrow, so that pods and leaves remain within arm's reach. The carbon from Moringa oleifera has extensive surface area, which is a suitable attribute for resorcinol adsorption.
Phosphoric acid required for impregnation was obtained from Rankem Fine Chemicals Ltd. Resorcinol for adsorption studies was obtained from Sisco Chemicals Pvt Ltd, 4-amino antipyrine required for analysing was obtained from Merck Specialities Pvt Ltd. All the chemicals used were of analytical grade.
The experiments were carried out in two stages.
1) The preparation of activated carbon and its characterization.
2) Adsorption studies of Resorcinol (batch experiments).
2.2. Preparation of Moringa oleifera activated carbon
The preparation of activated carbon involves two steps (1)The impregnation of Moringa oleifera using H3PO4 and (2)carbonization of the impregnated Moringa oleifera.
The wood of the Moringa oleifera was collected, the outer pericarp was removed and the wood cut into small pieces was dried before reducing it to a particle size of 2.36 mm.The wood was then thoroughly washed with water to remove all impurities present and then dried.
The Moringa oleifera thus prepared was soaked in 50%H3PO4 solution in the ratio of 1:1 w/w (MOAC1). The mixture was soaked for 24 h the impregnated Moringa oleifera was transferred to a pyrex glass plate and dried at 110oC for 1.5 h. The char thus obtained was activated at 400oC for 1 hour in a self generated atmosphere in a muffle furnace. The carbon thus produced was thoroughly washed with distilled water till the solution pH was neutral. The washed activated carbon was then dried in a hot air oven at a temperature of 105oC until a constant weight of the activated carbon was reached. The prepared material was stored for further adsorption studies. Another Moringa oleifera activated carbon(MOAC2) was prepared similar to MOAC1 but changing only the impregnation ratio to 1:2 w/w.
[Table 1.] Characterization of Activated Carbons MOAC1 andMOAC2
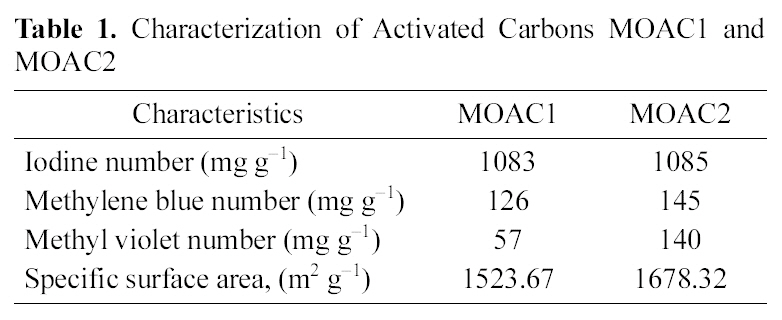
Characterization of Activated Carbons MOAC1 andMOAC2

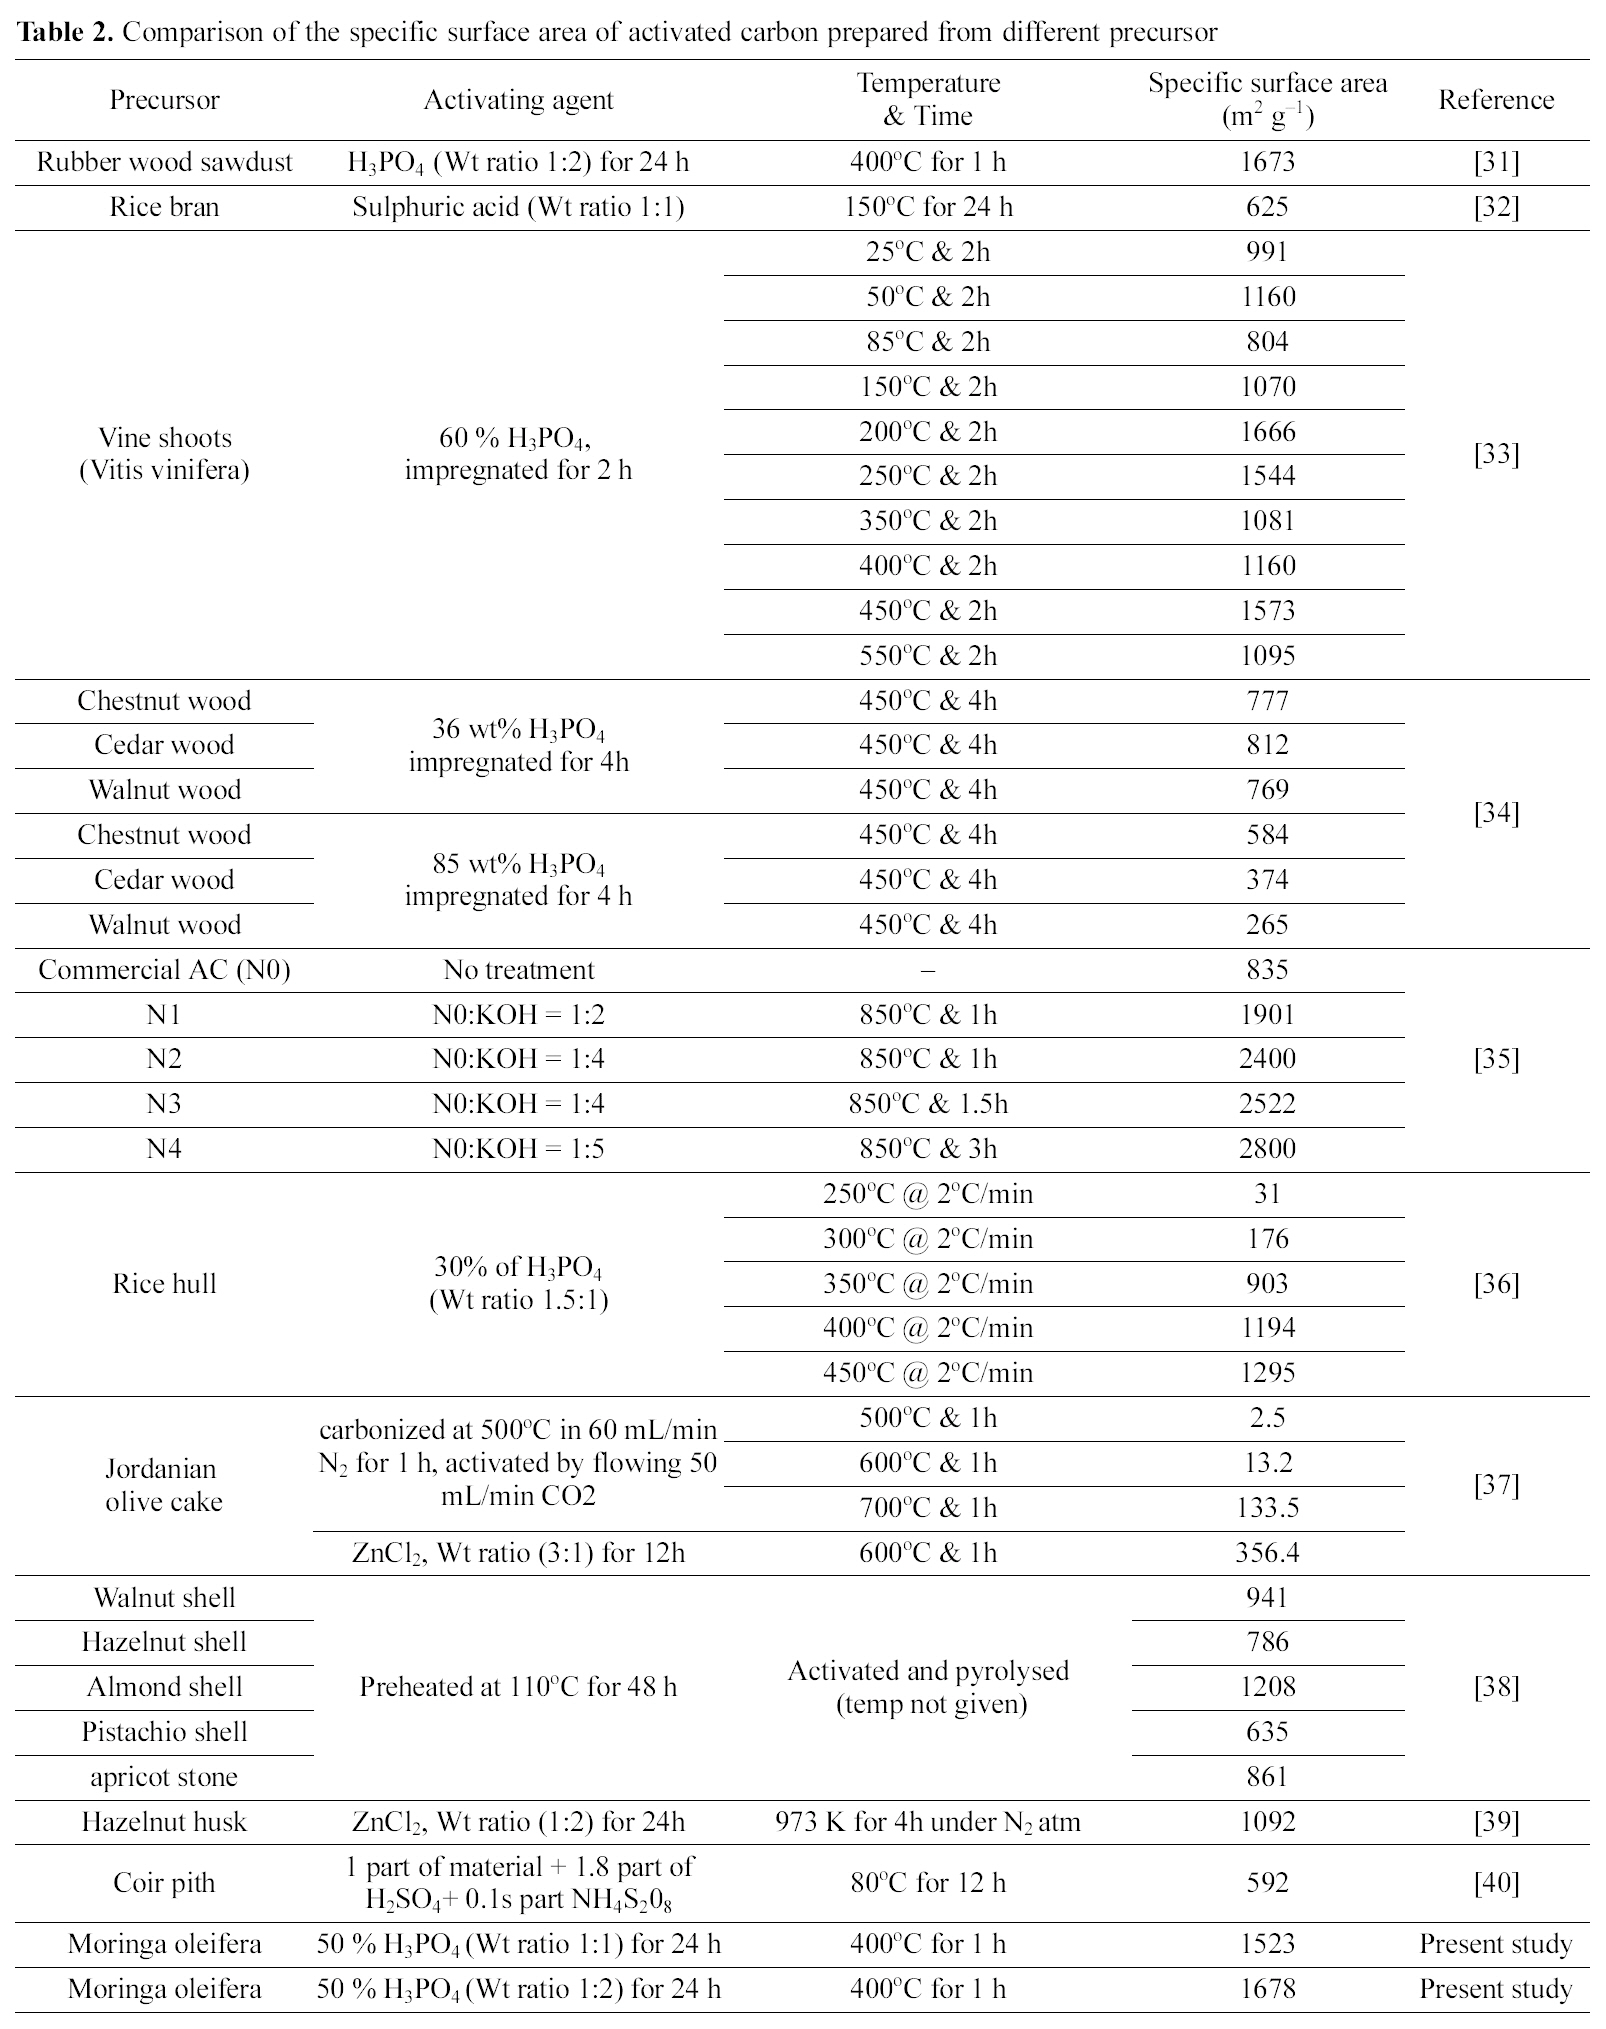
Comparison of the specific surface area of activated carbon prepared from different precursor
2.2.1. Characterization of activation carbon
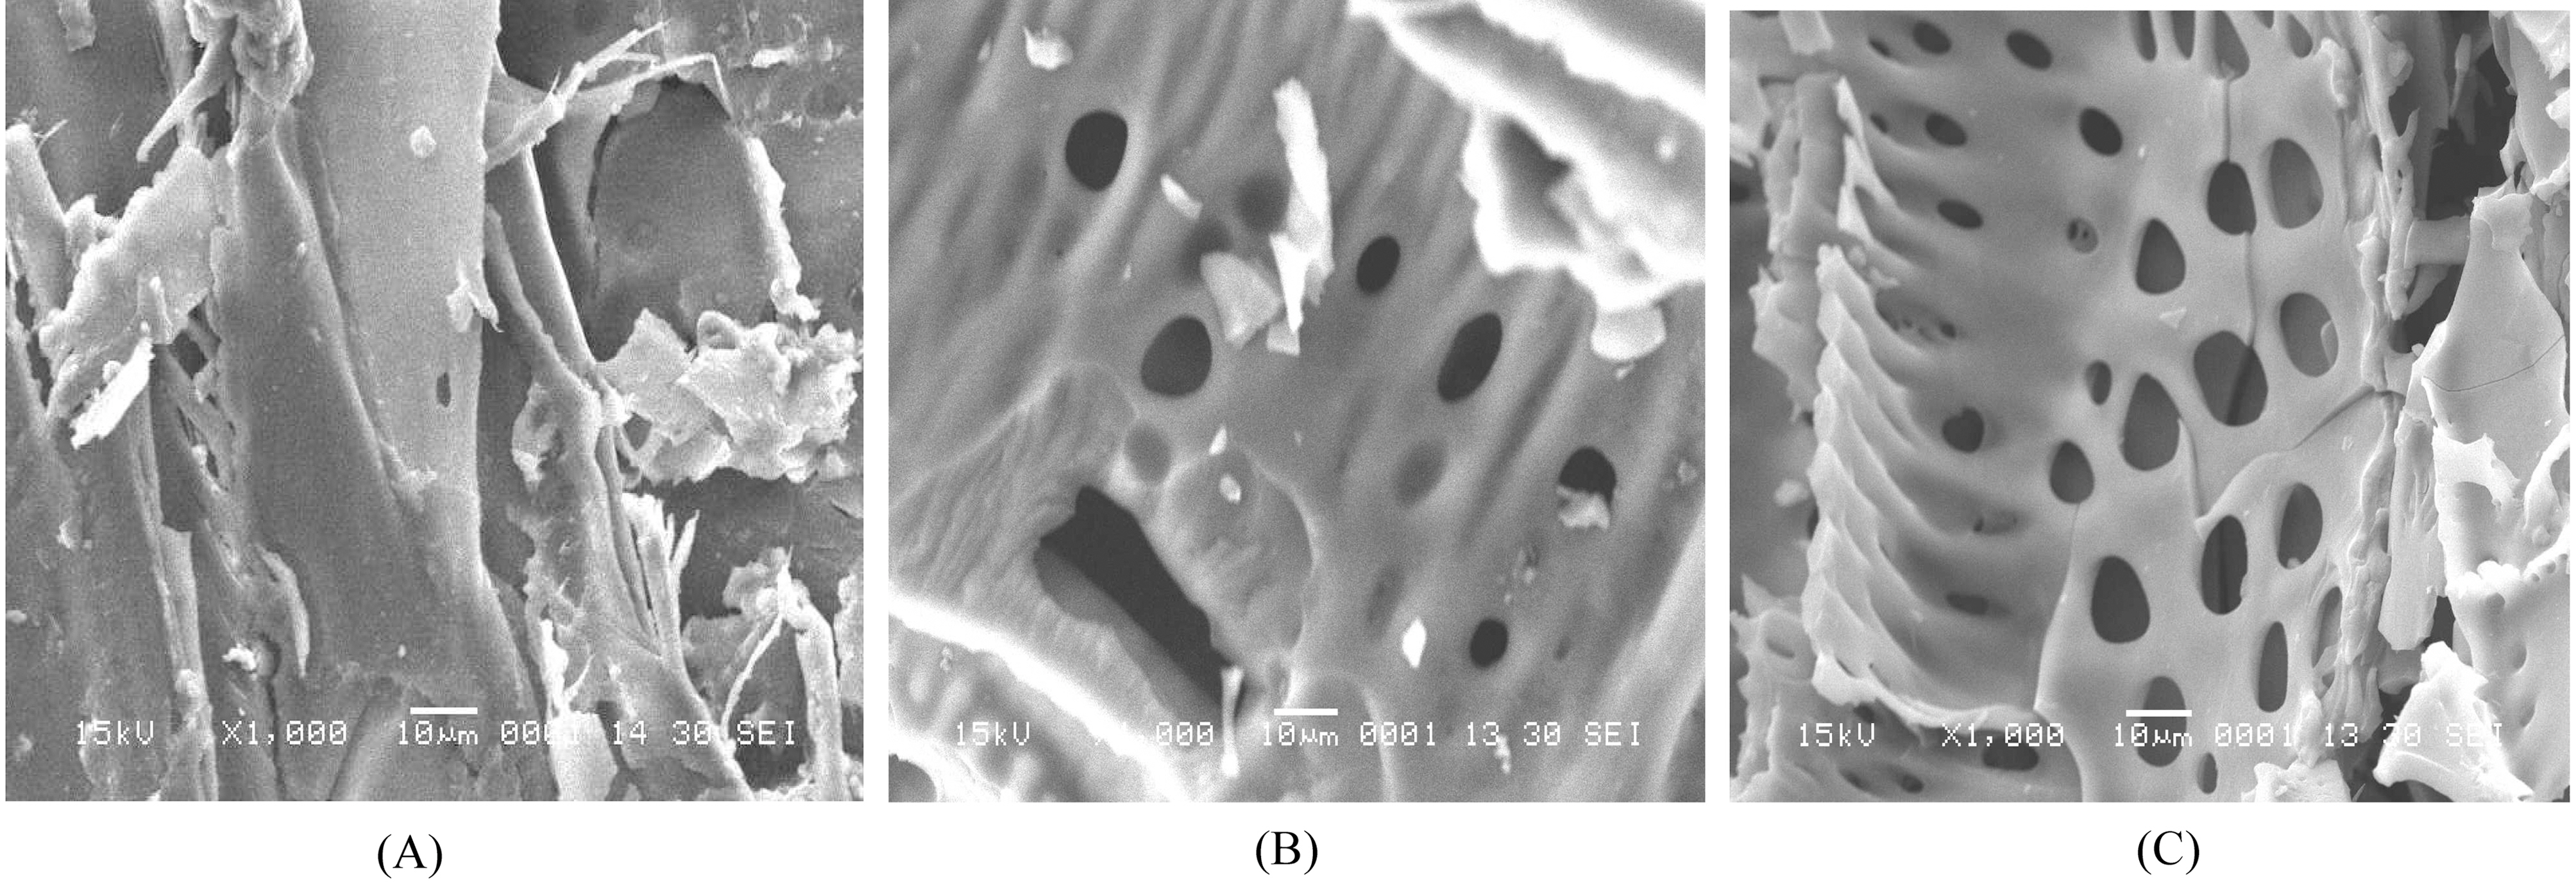
The activated carbons MOAC1 and MOAC2 were characterized with the help of SEM micrographs shown in Fig. 1,(A) shows the SEM micrograph of a raw Moringa oleifera which has no pores, (B) SEM micrograph of activated carbon MOAC1 which shows some pores, (C) SEM micrograph of activated carbon MOAC2 which shows more number of pores than MOAC1, Iodine number [15], Specific surface area, Methylene Blue Number (MBN) and Methyl Violet Number (MVN) [16]. Standard procedures were used in their determination. The iodine number is a measure of microporosity of the activated carbon and it is defined as milligrams of iodine adsorbed per gram of carbon. MBN and MVN indicate the decolorizing power and are defined as milligrams of MB and MV adsorbed per gram of carbon.The values obtained for MOAC1 and MOAC2 are compared and are summarized in Table .1 Table 2 gives a comparison of the specific surface area of activated carbon prepared from different precursor.
100 mL of Resorcinol solution with initial concentration of 10 to 40 mg L?1 and 0.5 g (100 mL)?1 of activated carbon was introduced into a series of 250 mL conical flasks closed with stoppers and agitated in a rotary shaker at 180 rpm for the desired time interval. The residual concentration of resorcinol was analysed by using a UV/Visible spectrophotometer at a λmax of 510 nm by forming complex with 4-amino antipyrine[17].
The adsorption capacity was calculated using the following equation
qt = (Co?Ct) ×V/W
where, Co and Ct are the initial concentration and concentration of resorcinol at time t, V is the volume of the adsorbate(L) and W is the weight of the adsorbent(g).
The Moringa oleifera activated carbon (MOAC1, MOAC2)was used as the adsorbent in the adsorption of Resorcinol from aqueous solutions varying the initial concentration and adsorbent dosage.
3.1. Characterization of the adsorbent
3.1.1. SEM Micrographs
Fig.1 (A), 1(B) and 1(C) shows the SEM micrographs of the raw Moringa oleifera (RMO), activated carbon MOAC1 and MOAC2 respectively. SEM images illustrated irregular structure with cracks and crevices on the surface of the activated carbon, which confirmed amorphous and heterogeneous structures. It is quite obvious from the obtained SEM images that chemical activation of the carbon adsorbents significantly alters the physico-chemical properties and porosity of the materials when compared to that of RMO.Activated carbon MOAC2 has more pores compared to MOAC1. This is due to the fact that as the acid concentration was increased, more the number of pores formed.
3.1.2 Iodine Number (IN), Methylene Blue Number (MBN),Methyl Violet Number (MVN)
Iodine number shown in Table 1 for both the activated carbons (MOAC1 and MOAC2) was above 1000 mg g?1,which clearly indicates both the activated carbons are microporous.Also, MBN and MVN numbers are high for activated carbon MOAC2 than MOAC1. Acids are responsible to provide the protons upon ionization in aqueous solutions which in turn can further open the pores of activated carbon which increases the surface area of adsorbents. The iodine number is a relative indicator of porosity in an activated carbon. As the acid content increased, more reaction took place, and consequently, more surface area was developed.Hence, a higher acid content led to a formation of the product with a higher level of volume and surface area which could then provide a higher adsorption capacity.
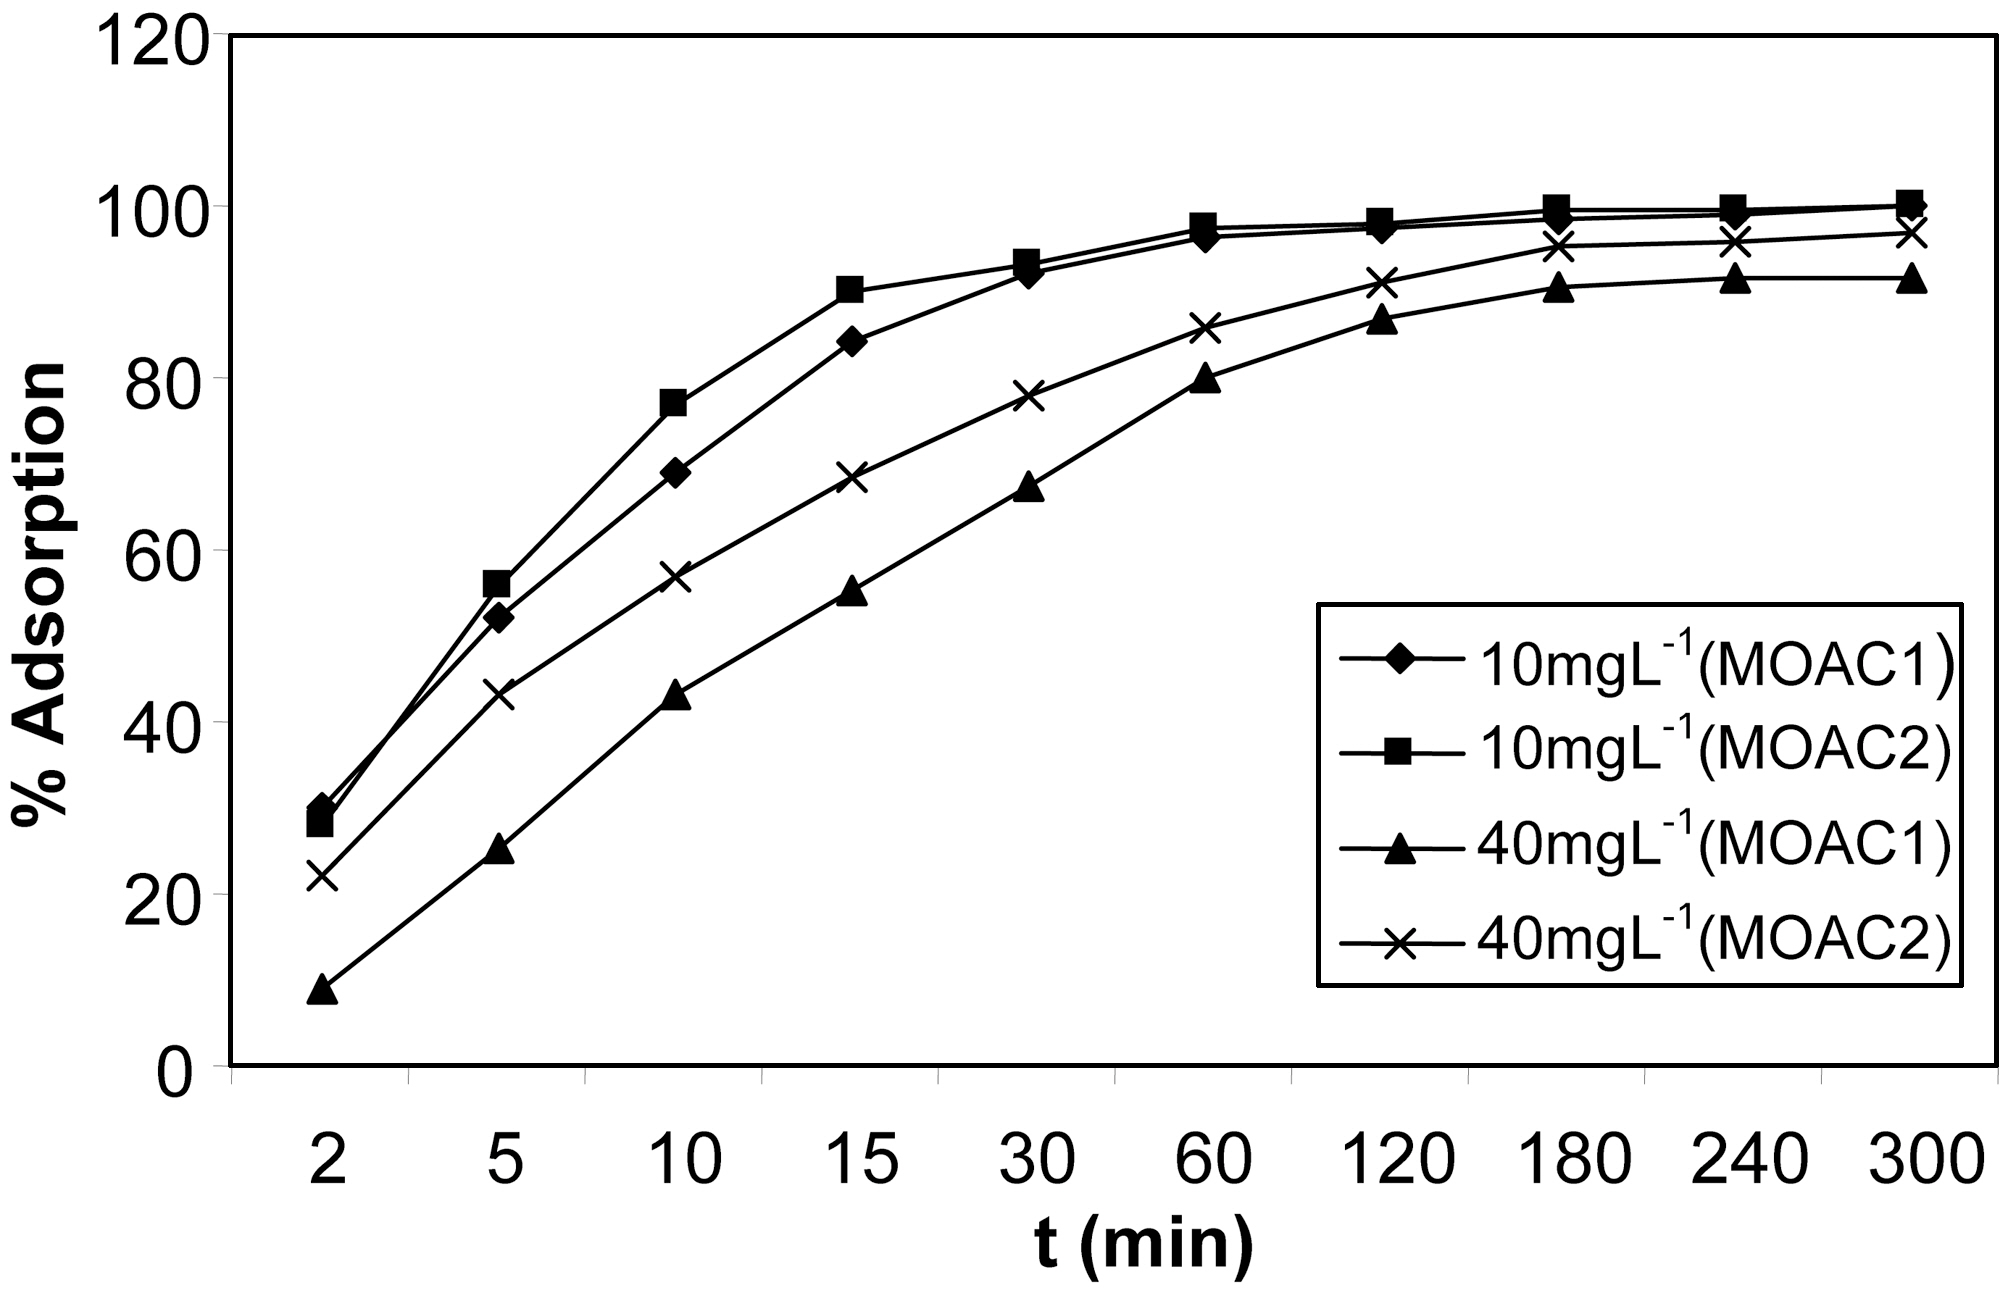
3.2. Effect of contact time on percentage adsorption
The percentage adsorption of resorcinol on activated carbon MOAC1 and MOAC2 are shown in Fig. 2 The adsorption was carried out in solutions containing 10 to 40 mg L?1 of resorcinol with constant carbon dosage of 0.5 g (100 mL)?1 of resorcinol at 30oC. Adsorption of resorcinol onto the activated carbon increased with increase in contact time and reached a maximum at 4 hrs and there was no change in percentage adsorption after 4 h for both MOAC1 and MOAC2 activated carbons. Hence, the equilibrium time for all further experiments was taken to be 4 hrs. When the adsorptions of the exterior surface reached saturation, the ions exerted onto
the pores of the adsorbent particles and were adsorbed by the interior surface of the particle. This phenomenon takes a relatively long contact time.
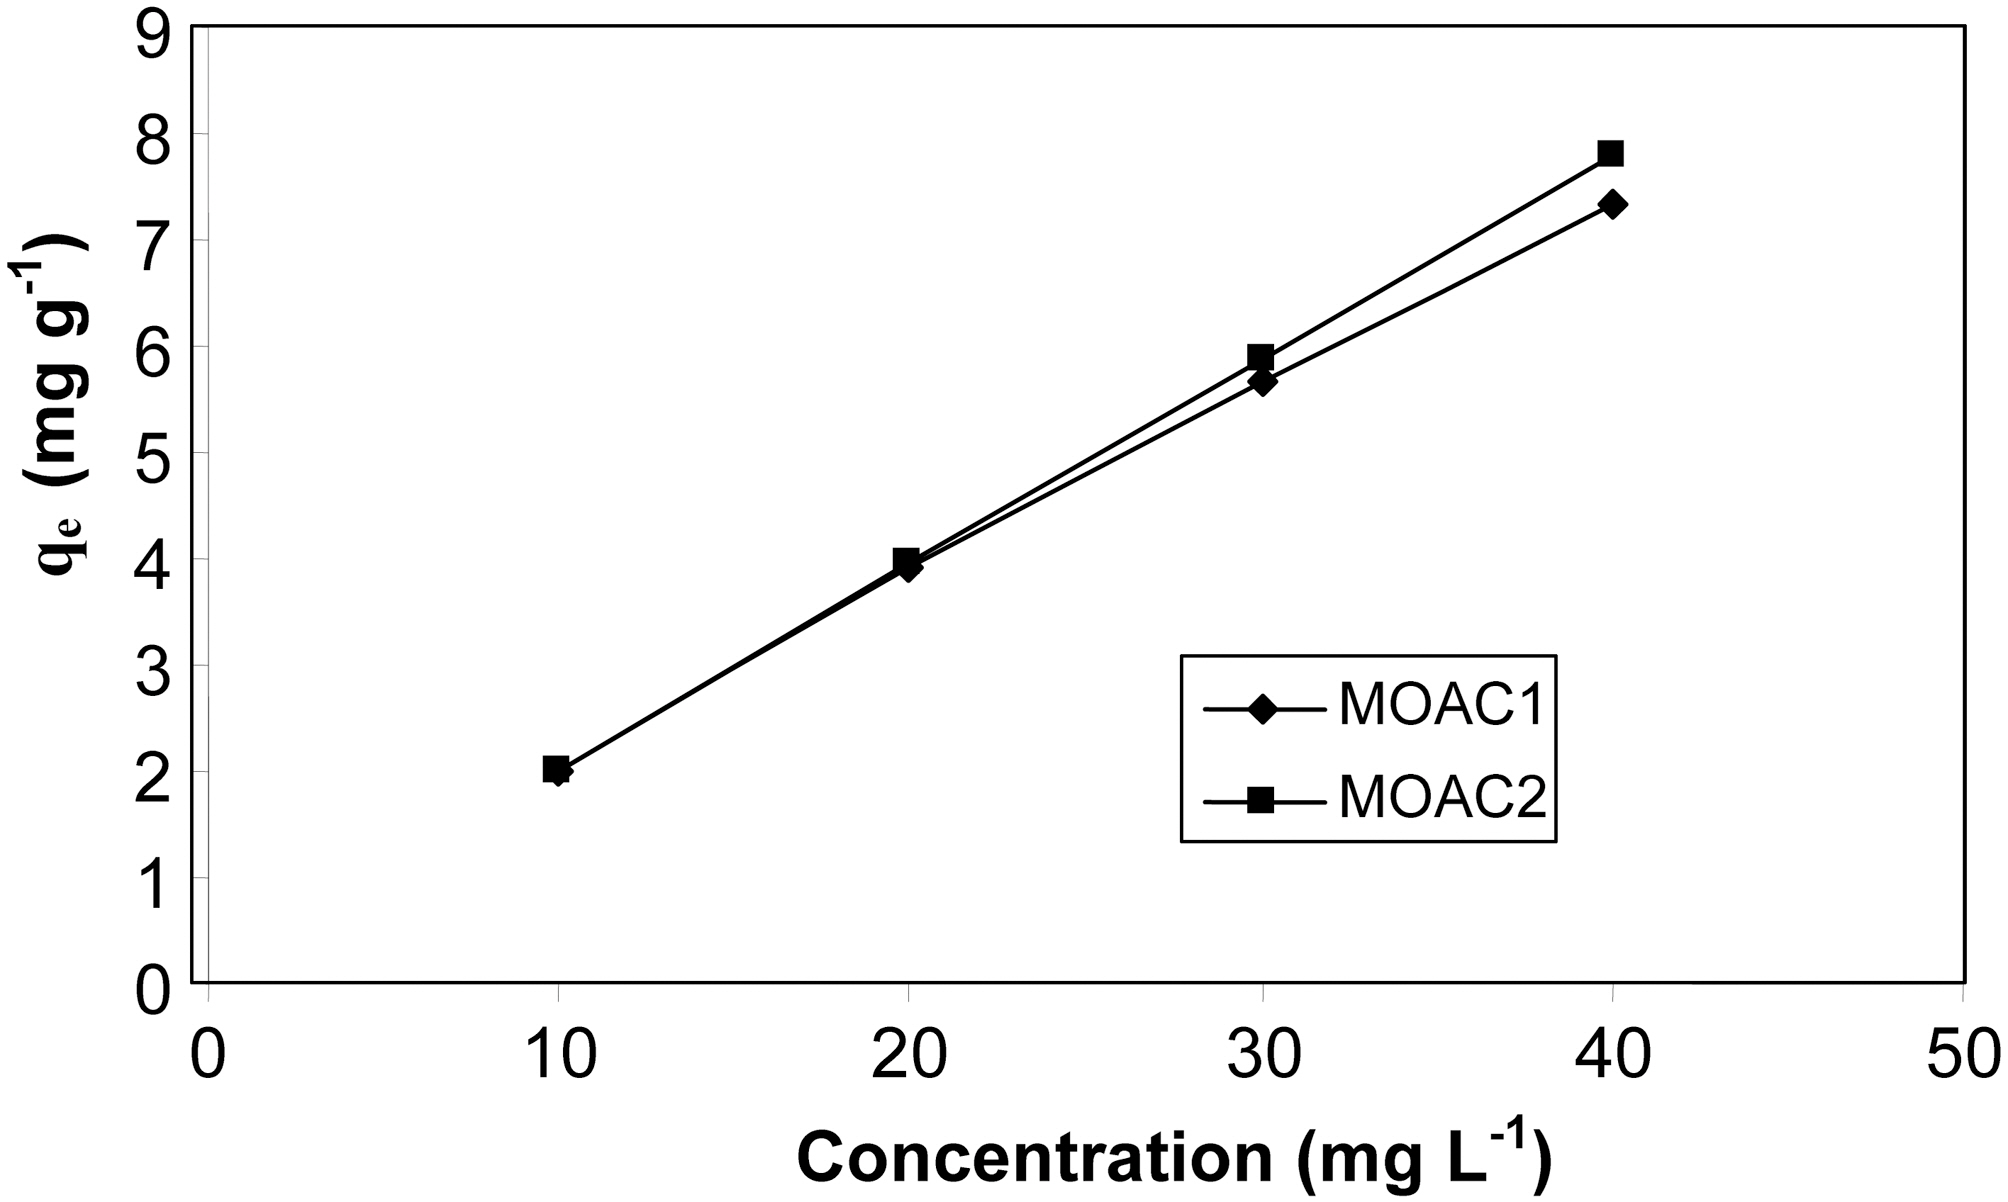
3.3. Effect of initial concentration of the adsorbate
The adsorption was carried out in solutions containing 10 to 40 mg L?1 of resorcinol with constant carbon dosage of 0.5g (100 ml)?1 at 30oC .The effect of initial concentration of resorcinol on adsorption capacity of MOAC1 and MOAC2 are compared in Fig. 3 At lower concentrations, all resorcinol present in the adsorption medium could interact with the binding sites, so higher percentage removals were obtained.At higher concentrations, lower removal percentage was observed. From the Fig. 3 it was observed that the adsorption capacity of both the carbon (MOAC1, MOAC2) did not vary significantly. It was also observed that the amount adsorbed per unit weight of adsorbent increased with an increase in initial concentration. This increase is because the resistance to the uptake of resorcinol from the solution decreases with an increase in resorcinol concentration. The rate of adsorption also increases with an increase in Co due to enhanced driving force [18].
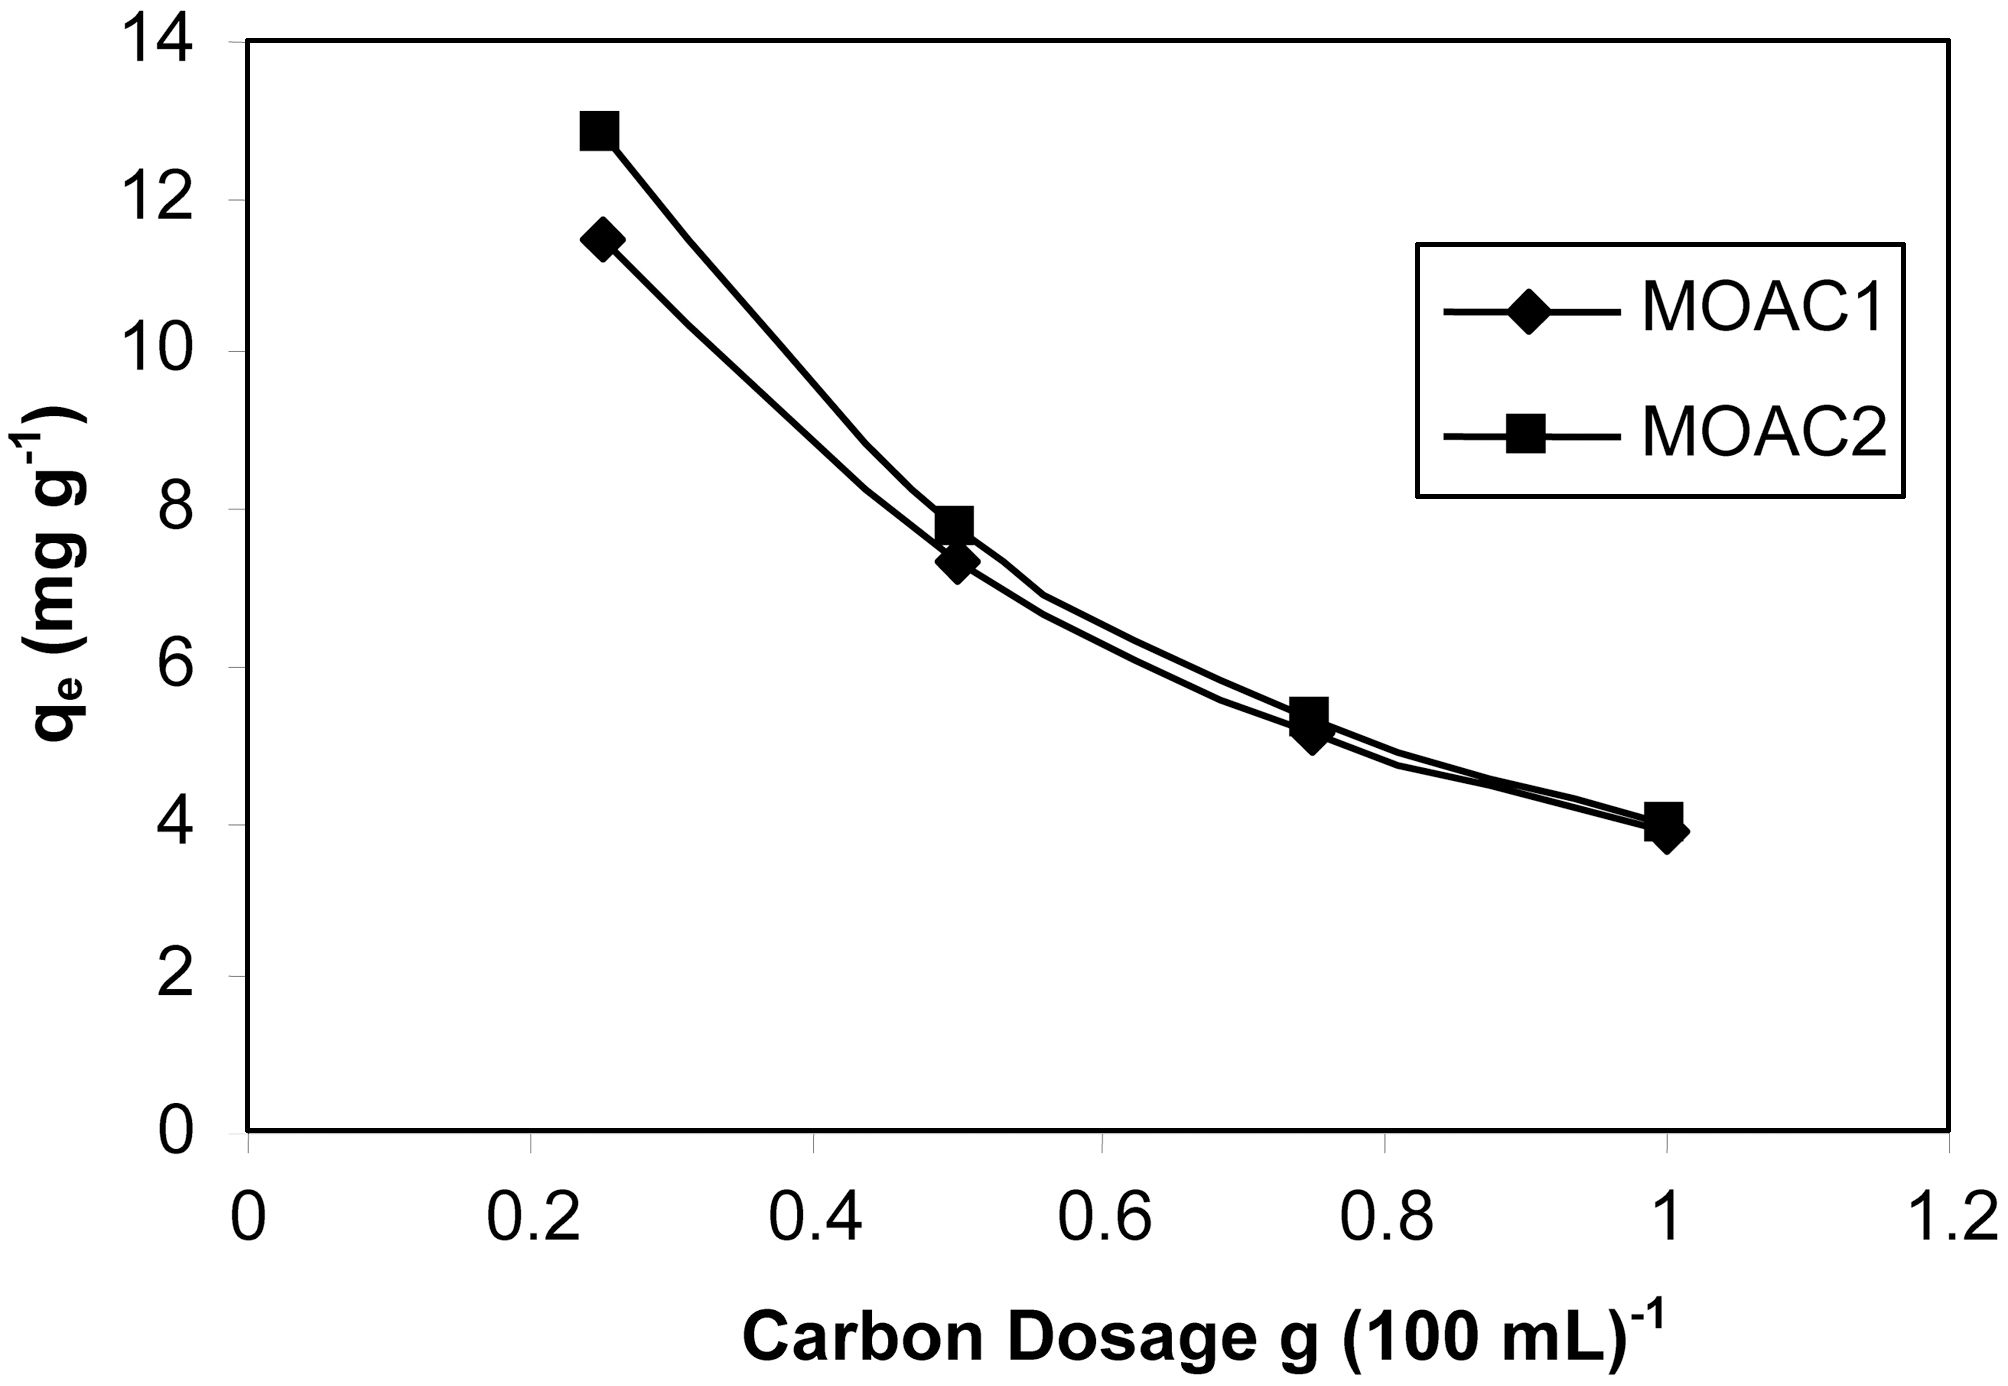
3.4. Effect of carbon dosage on percentage adsorption
The change in adsorption capacity of MOAC1 and MOAC2 for different dosages was shown in Fig. 4. The adsorption studies were carried out by taking 100 mL of 40 mg L?1 resorcinol for different dosages of activated carbon. As the carbon dosage increased, the adsorption percentage increased. This was due to the availability of more surface functional groups at higher concentrations of adsorbents. But the amount of dye adsorbed per unit weight of the adsorbent decreases with increase in dosage, as observed in both the cases [19]. This may be attributed to the aggregation of adsorbent particles at high dosage, which reduces the total
surface area of the adsorbent and results in an increase in the diffusion path length.
3.5. Kinetics of Resorcinol adsorption
To describe the changes in the adsorption of resorcinol with time, several kinetic models were tested; among different kinetic models available in literature the Lagrangen pseudo first order and Ho’s pseudo second order reaction rate models are widely used. The mathematical models are as follows.
3.5.1. Pseudo first order kinetics
Pseudo first order kinetic model is represented as [20]
dq/dt = K1(qe?q)
On integration with boundary conditions, q = 0 at t = 0 and q = qt at t = t gives
On integration with boundary conditions, q = 0 at t = 0 and q = qt at t = t gives
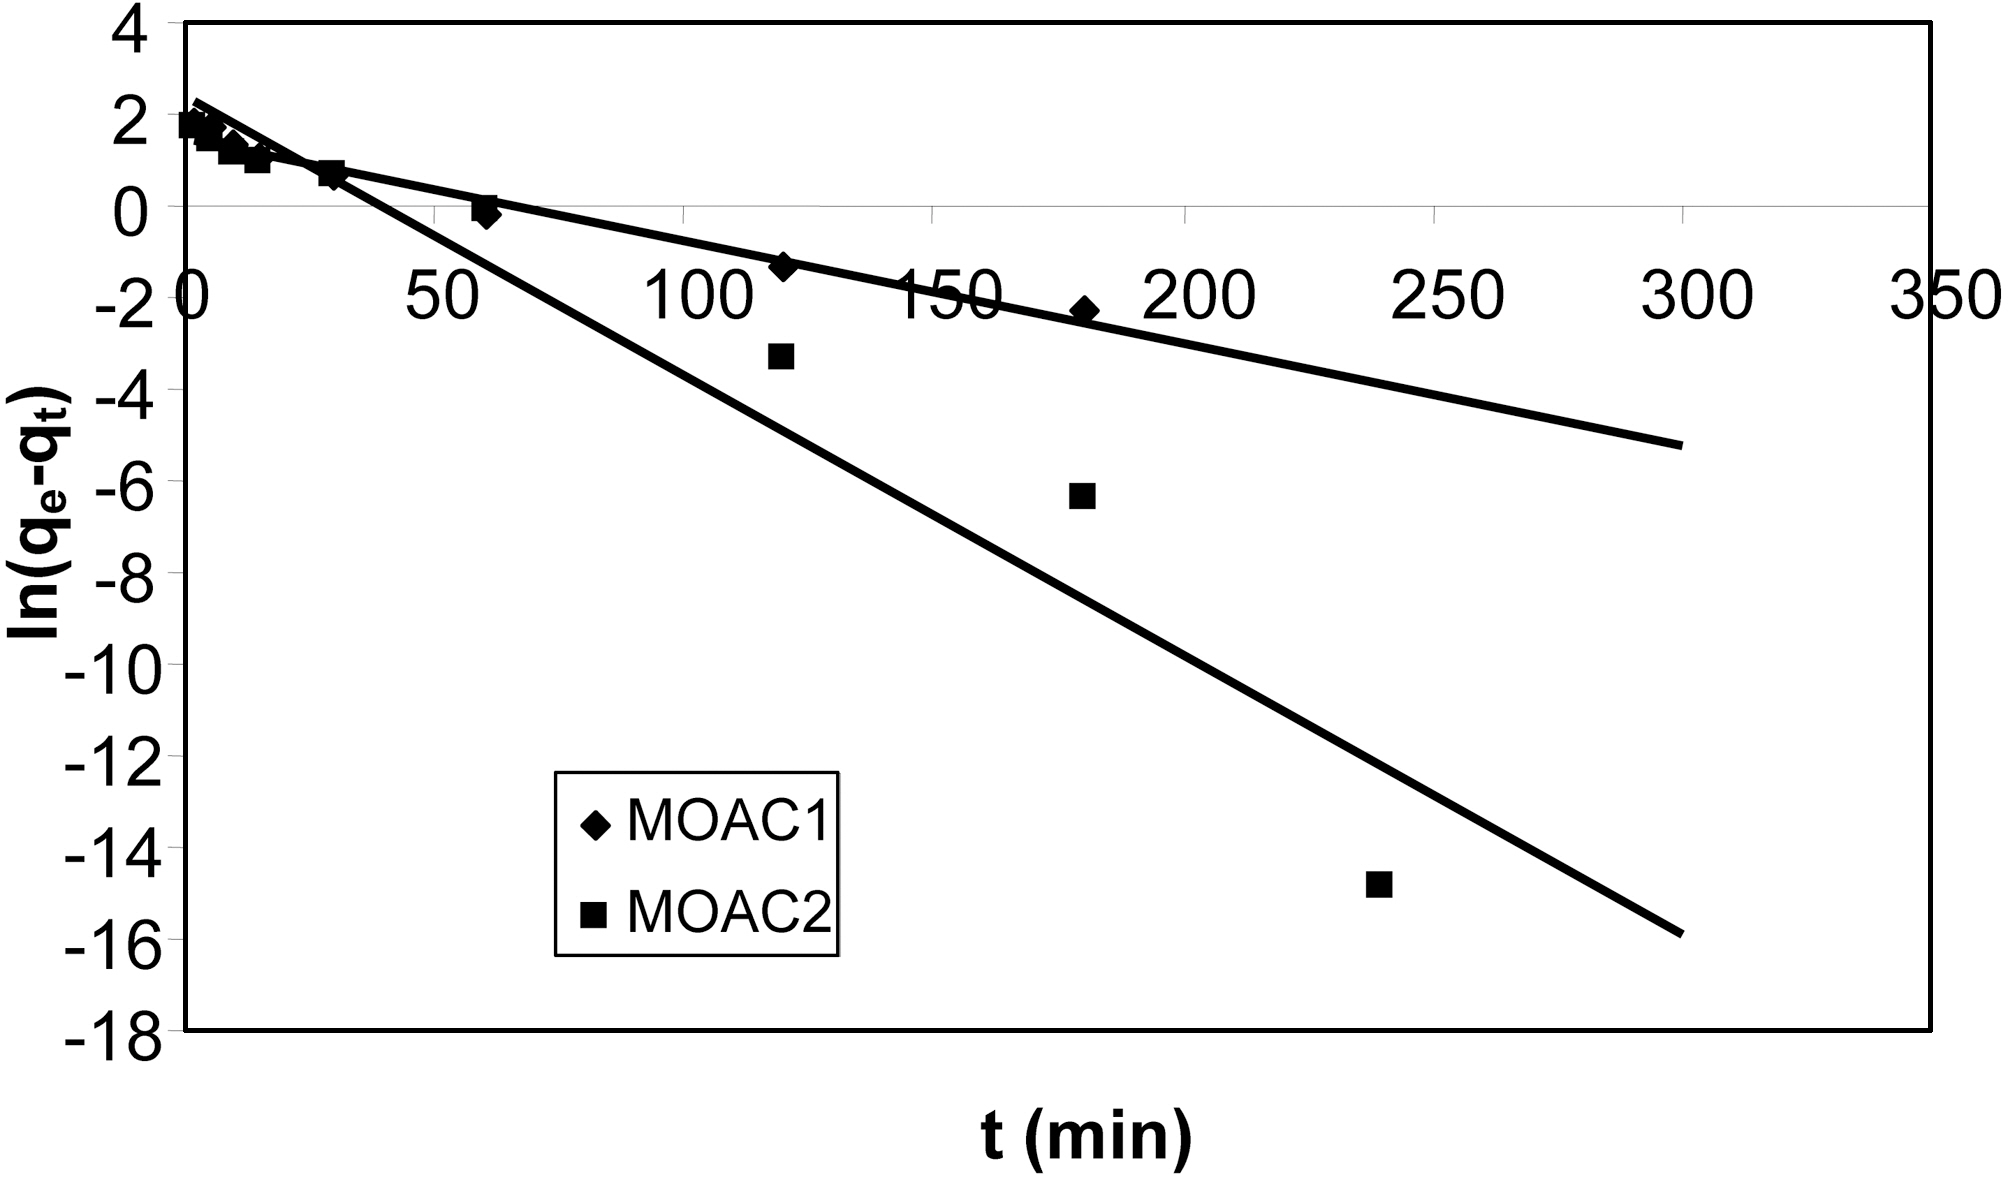
ln(qe?qt) = ln qe?K1t
where qe and qt are amount of resorcinol adsorbed at equilibrium and at time t, K1 is the rate constant for first order adsorption (min?1).
Graphs were plotted between ln(qe?qt) Vs t. qe (calculated)and the pseudo first order rate constant K1 was obtained from intercept and slope of the plot. The kinetic plot obtained fitting pseudo first order rate equation for adsorption of resorcinol for both the carbons (MOAC1, MOAC2) is shown in Fig. 5.
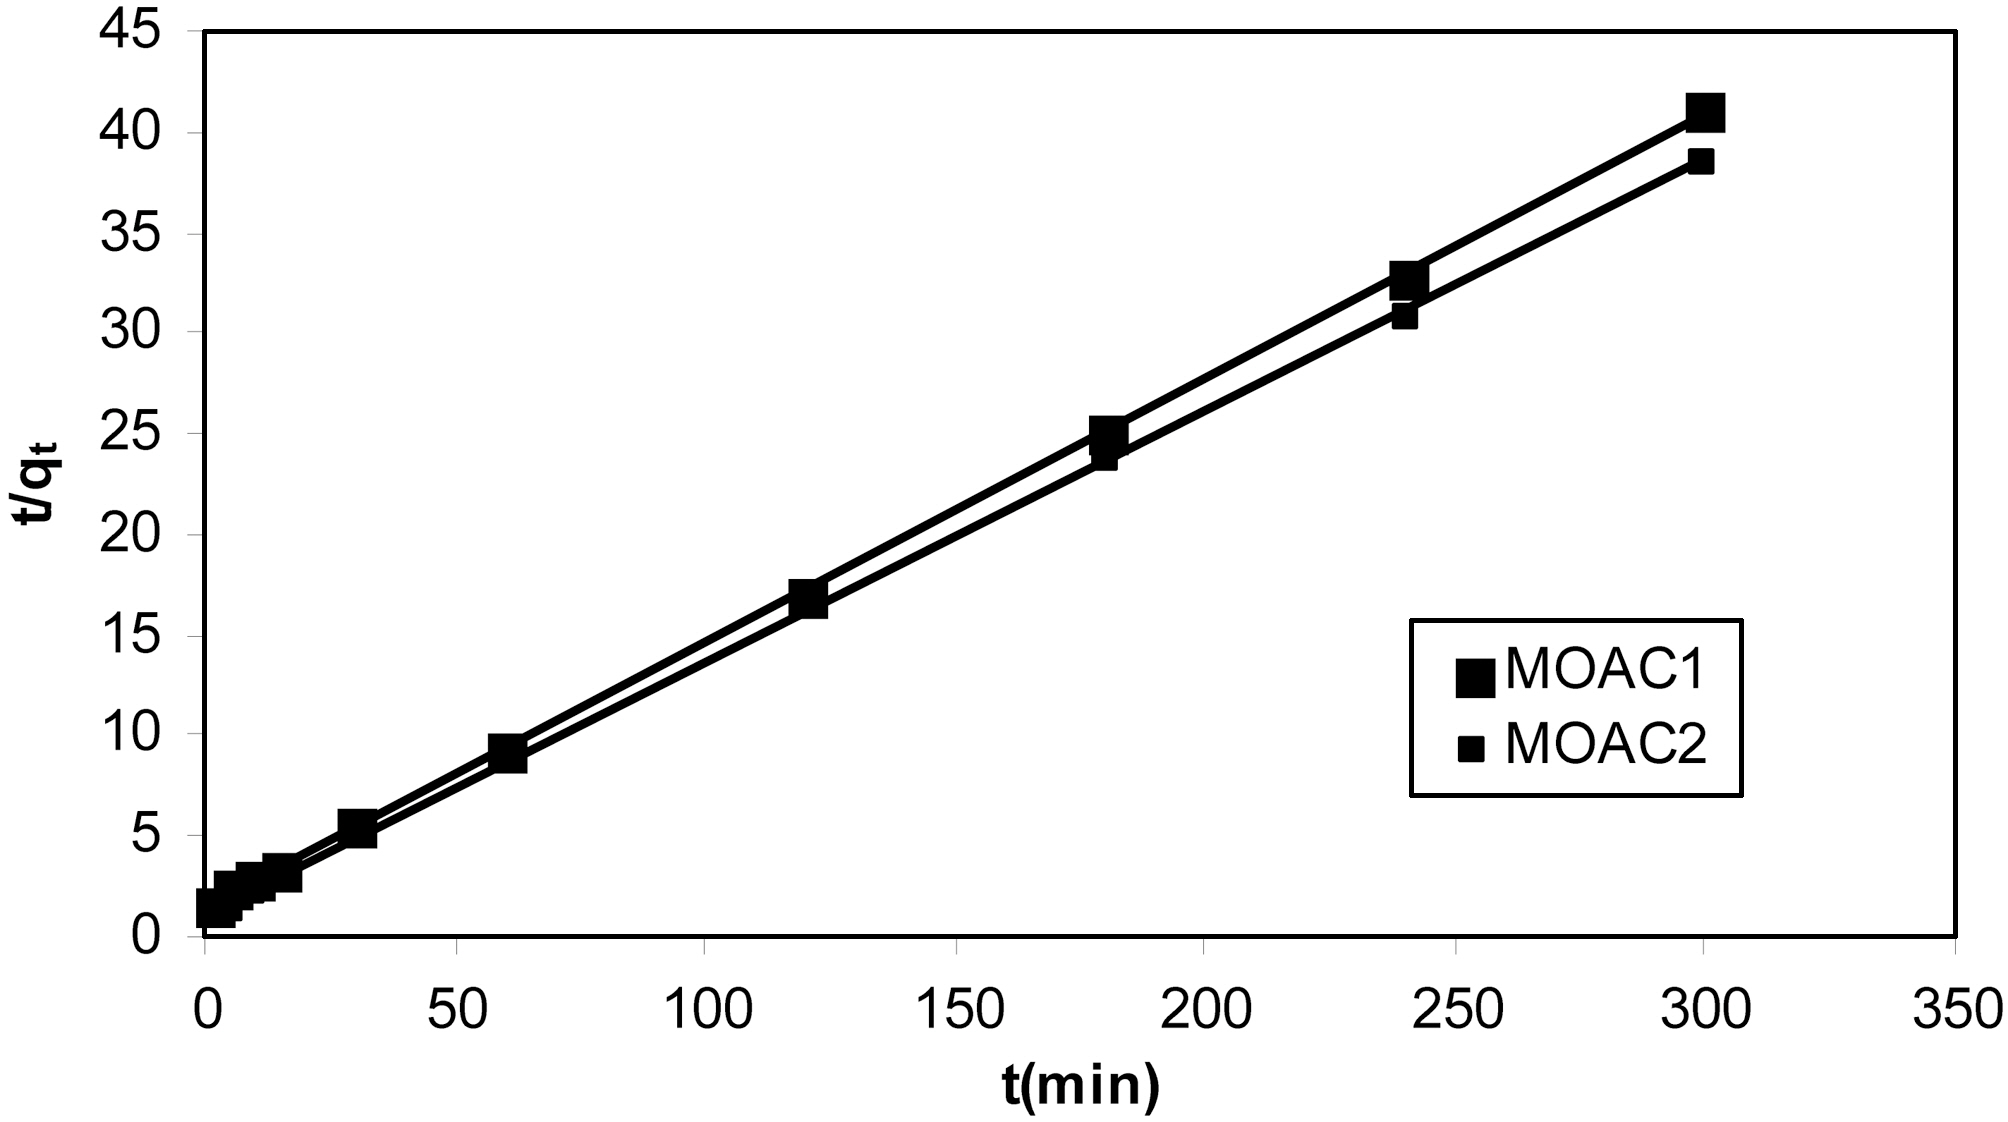
3.5.2. Pseudo second order kinetics
Pseudo second order kinetic model is represented as [21]
dq/dt = K2 (qe?q)2
on integration with boundary conditions, q = 0 at t = 0 and q = qt at t = t gives
t/qt = 1/K2qe 2+ t/qe
where qe and qt are amount of resorcinol adsorbed at equilibrium and at time t, K2 is the rate constant of pseudo second order adsorption (g mg?1 min?1).
Graphs were plotted between t/qt Vs t. qe calculated and the pseudo second order rate constant K2 were obtained by slope and intercept of the plot. The kinetic plot obtained fitting pseudo second order rate equation for adsorption of resorcinol on both the carbons (MOAC1, MOAC2) is shown in Fig. 6.
It can be seen from the Fig. 5 that pseudo first order kinetics does not fit well. It is clear from the Fig. 6 that
[Table 3.] Kinetic parameters for adsorption of resorcinol onto activated carbons MOAC1 and MOAC2

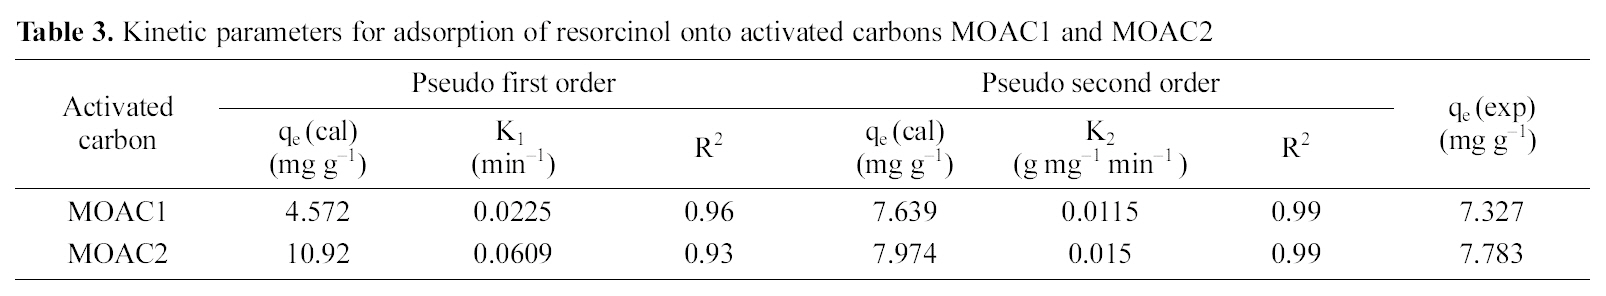
Kinetic parameters for adsorption of resorcinol onto activated carbons MOAC1 and MOAC2
kinetic data fits well for the pseudo second order model and adsorption of resorcinol on activated carbons (MOAC1,MOAC2) follows pseudo second order reaction and it is evident from correlation coefficients shown in Table .3 It can be seen from Table 3 that qe experimental agrees reasonably well with qe predicted from the model for pseudo second order kinetics. Hence, it is clear that adsorption of resorcinol follows pseudo second order kinetics.
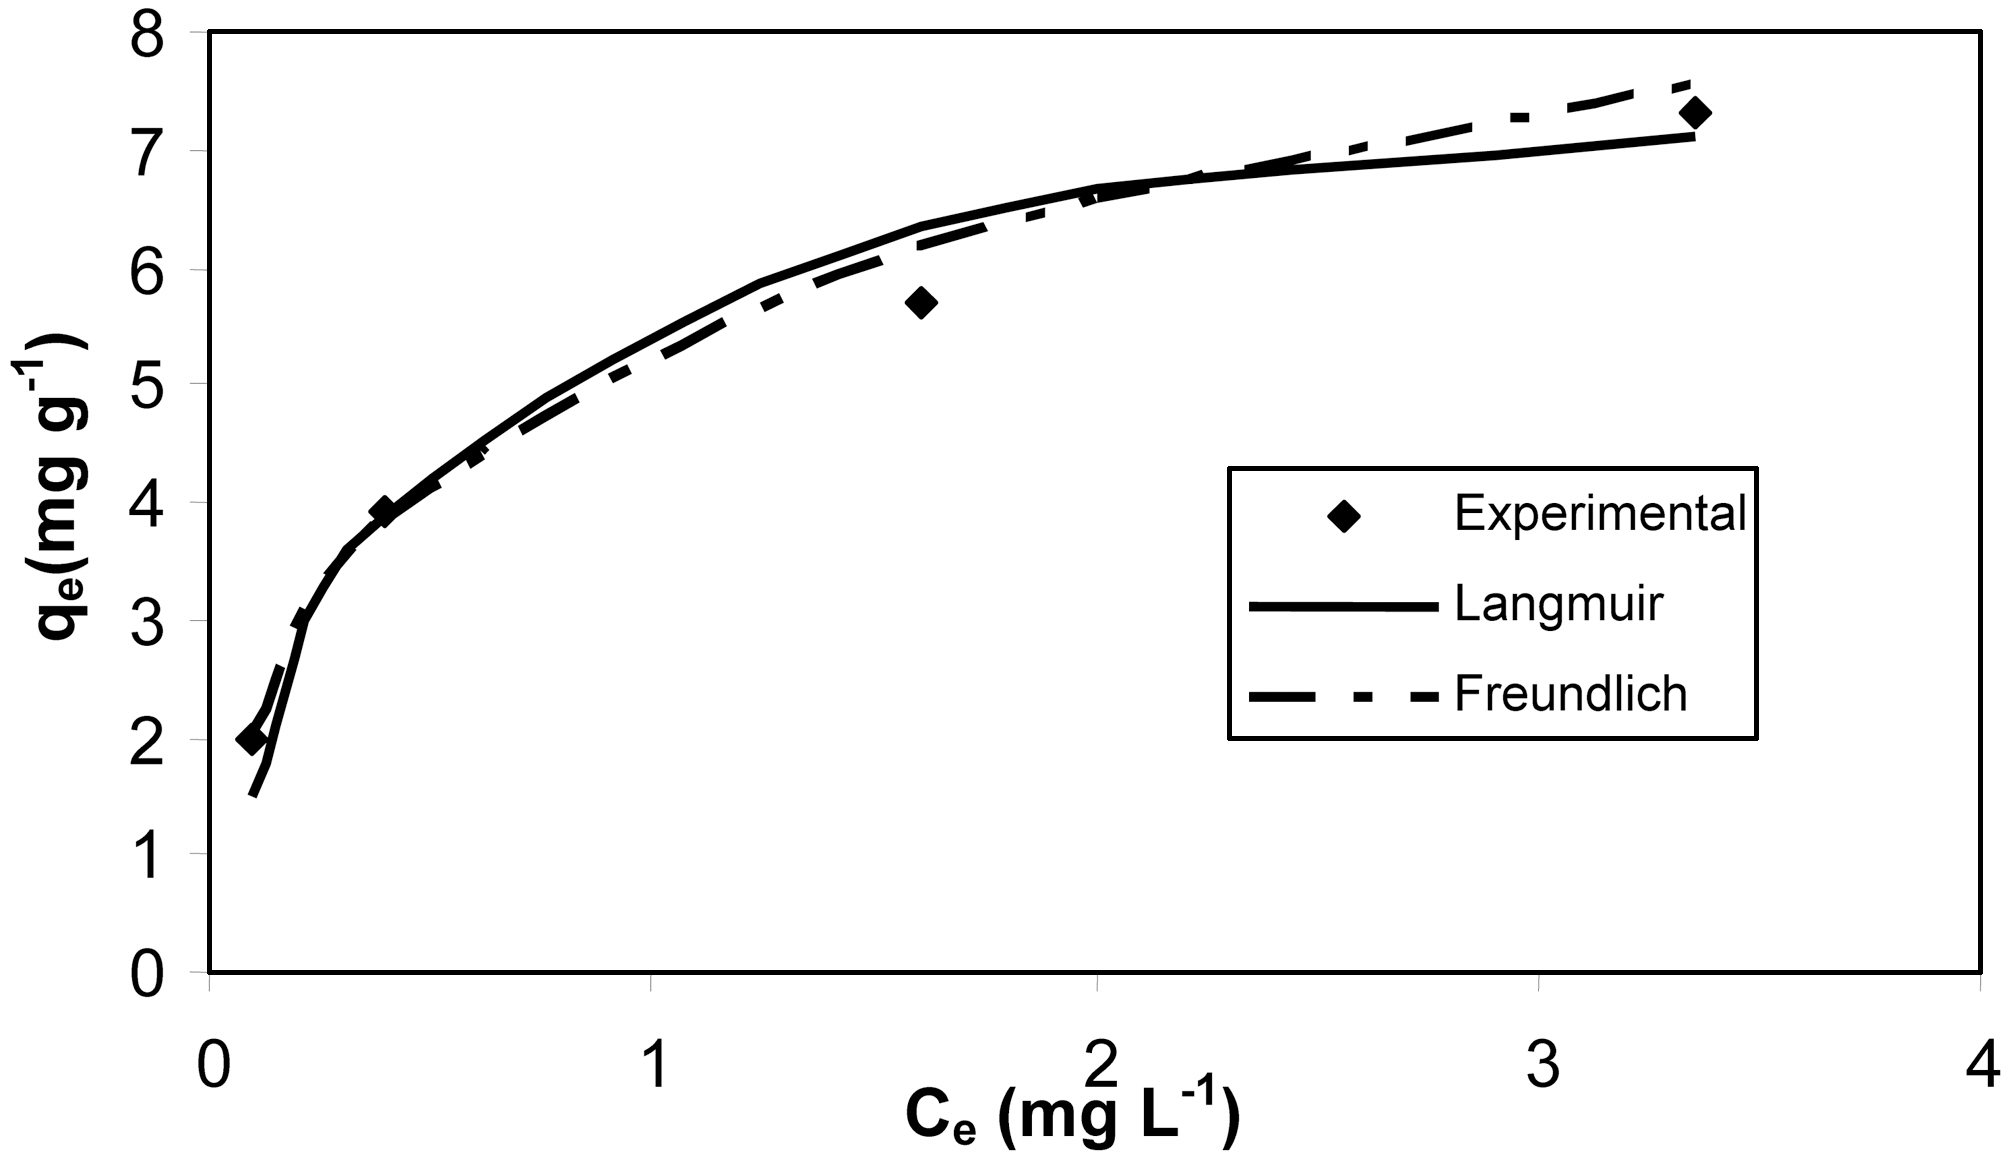
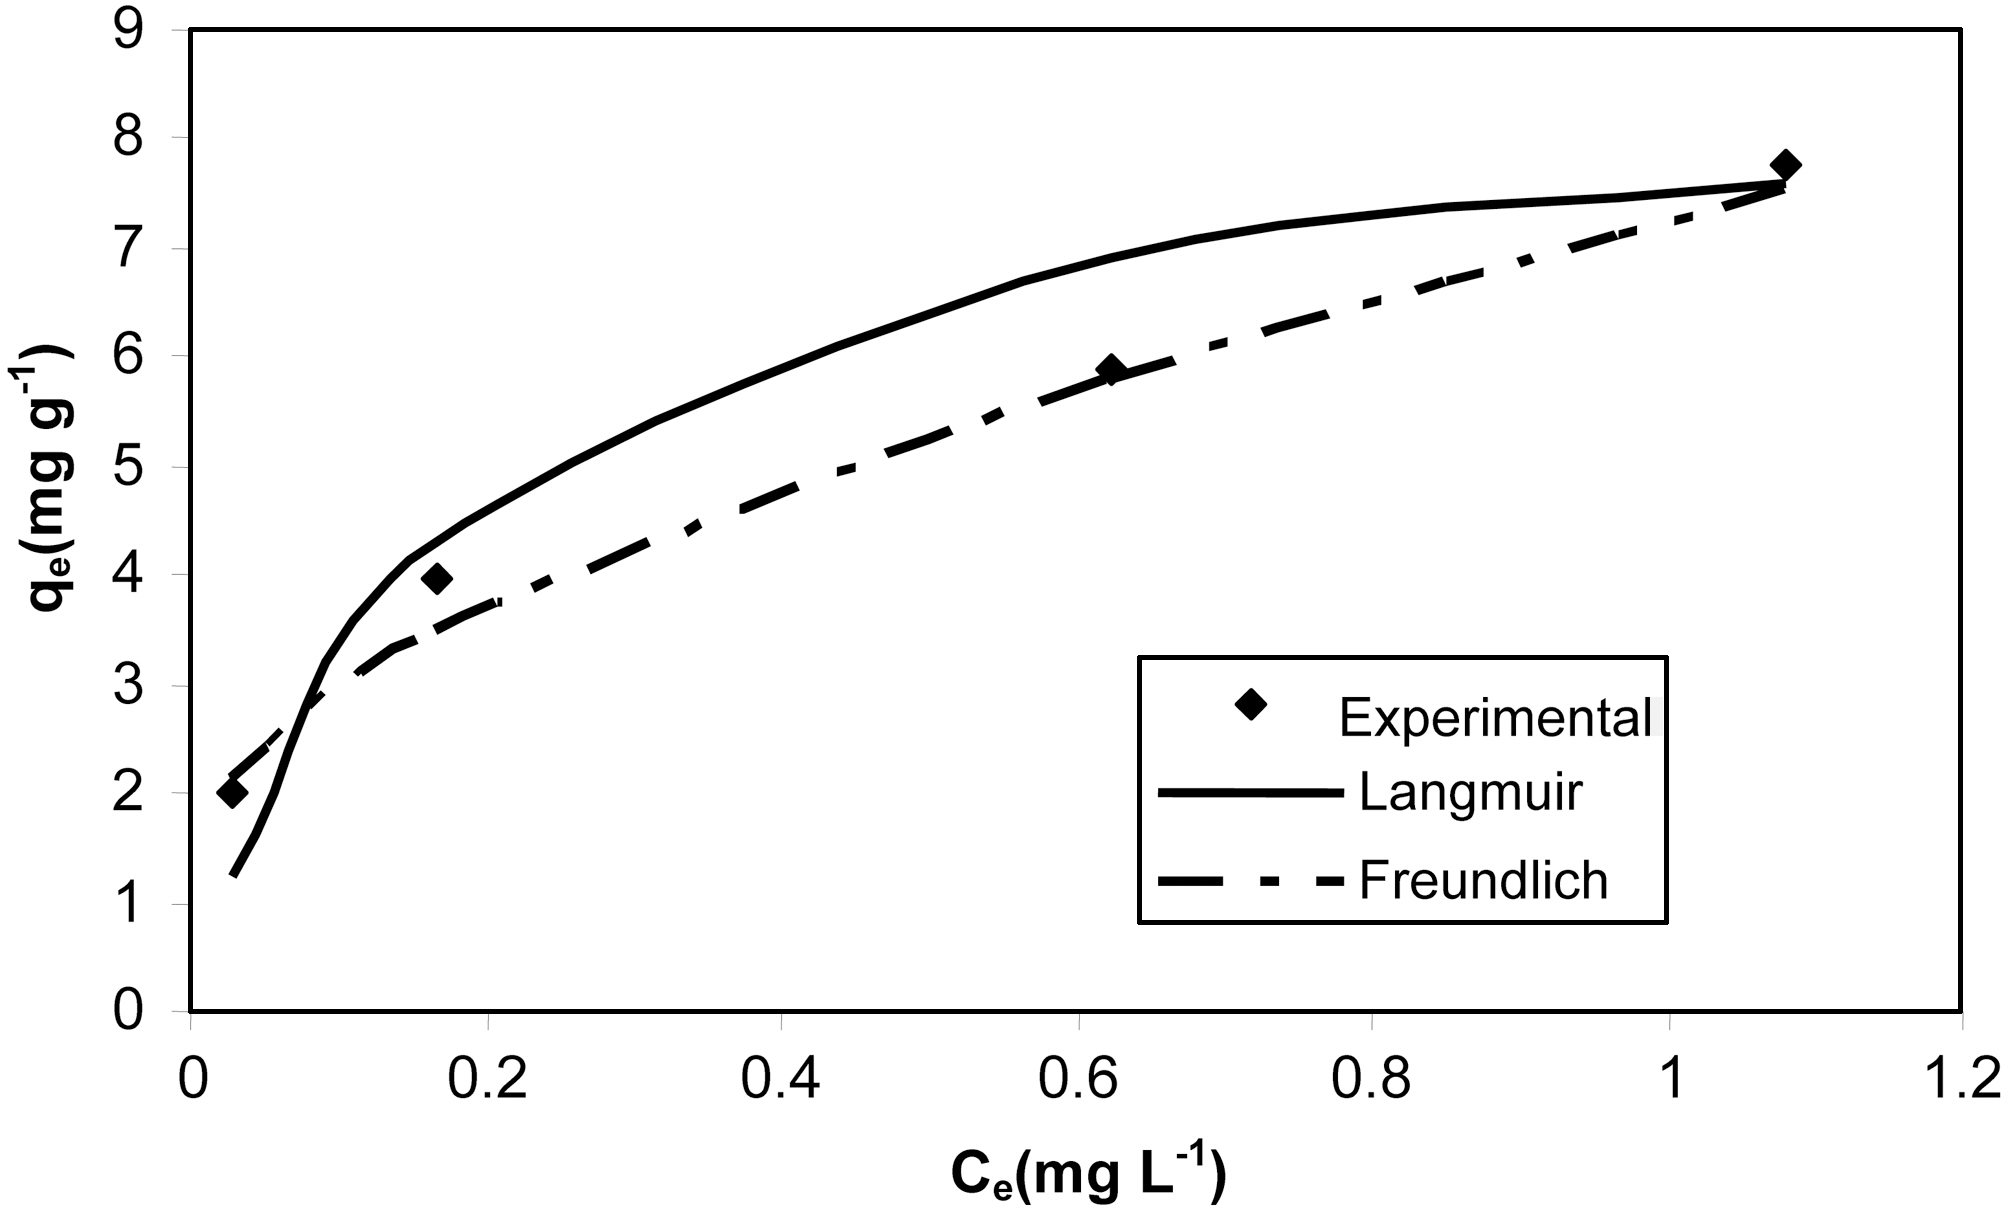
Since adsorption is one of the fundamental surface phenomena,it is important to have a satisfactory description of equilibrium data. In this work, well known isotherms were employed to represent equilibrium data of resorcinol on activated carbon, they are Langmuir and Freundlich isotherms.
3.6.1. Langmuir isotherm
The Langmuir isotherm is based on mono layer adsorption on the active sites of the adsorbent. The Langmuir isotherm is given by [22].
qe = qm KLCe /(1 +KLCe)
The linear form of the Langmuir isotherm is given by,
Ce /qe = (1/qm KL) + Ce/qm
Where, Ce is the equilibrium concentration (mg L?1), qe is amount of Resorcinol adsorbed at equilibrium, qm and KL are the Langmuir constants related to saturated mono-layer adsorption capacity (mg g?1) and the binding energy of the adsorption system.
Graphs were plotted between Ce/qe Vs Ce. The Langmuir constants were obtained from slope and intercept of the plot.
3.6.2. Freundlich isotherm
Freundlich isotherm gives the relation between equilibrium liquid and solid phase capacity based on the multi layer adsorption. The isotherm is derived from the assumption that the adsorption sites are distributed exponentially with respect to heat of adsorption and is given by [23].
qe = Kf Ce(1/n)
The linear representation of Freundlich isotherm is given as,
log qe = log Kf + (1/n)log Ce
where, Ce is the equilibrium concentration (mg L?1), qe is amount of Resorcinol adsorbed at equilibrium, n and Kf are the Freundlich constants related to adsorption capacity (mg g?1) and the adsorption intensity.
Graphs were plotted between log qe Vs log Ce. The Freundlich constants were obtained by slope and intercept of the plot.
The Langmuir and Freundlich adsorption isotherm equations were fitted with experimental equilibrium data for different concentrations. The isotherm plots are shown in Fig. 7 and Fig. 8. The adsorption parameters are given in Table 4. It was observed that both Langmuir and Freundlich isotherms
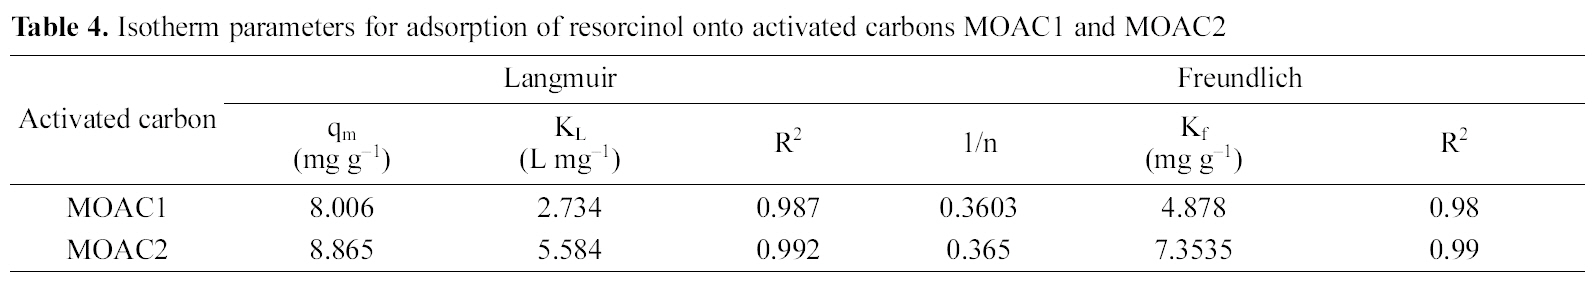
[Table 4.] Isotherm parameters for adsorption of resorcinol onto activated carbons MOAC1 and MOAC2

Isotherm parameters for adsorption of resorcinol onto activated carbons MOAC1 and MOAC2
[Table 5.] Comparison of adsorption capacity of other adsorbentswith the present work
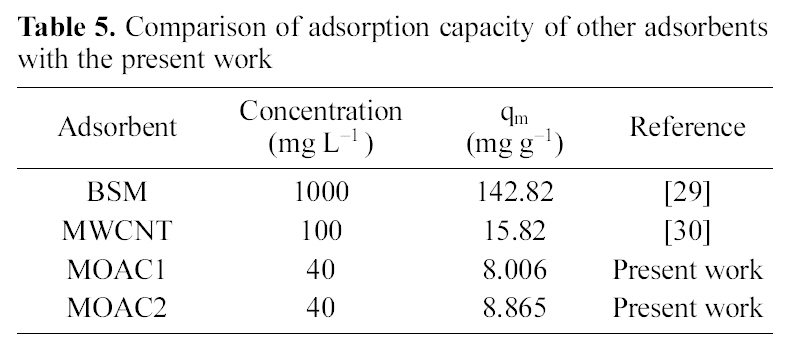
Comparison of adsorption capacity of other adsorbentswith the present work
fit well with the equilibrium data for both the activated carbons MOAC1 and MOAC2.
The performance of adsorbents can be compared by considering adsorption capacities qm and Kf of MOAC1 and MOAC2 impregnated carbons. It was observed that MOAC2 impregnated activated carbon had higher adsorption capacity when compared to activated carbon MOAC1 as reported in Table .4 Comparison of adsorption capacity of MOAC1 and MOAC2 with other adsorbents are shown in Table 5.
The prediction of rate limiting step is an important factor to be considered in the adsorption process [24]. It is governed by the adsorption mechanism, which is generally required for design purposes. For a solid-liquid sorption process, the solute transfer is usually characterized by external mass transfer (boundary layer diffusion) or intra particle diffusion,or both. The three steps analyze the mechanisms of adsorption as follows.
(1) Transport of the solute from bulk solution through liquid film to the adsorbent exterior surface;
(2) Transport of the adsorbate with in the pores of the adsorbent (Particle diffusion).
(3) Adsorption of the adsorbate on the exterior surface of the adsorbent.
Generally, the last step is the equilibrium reaction and it is very rapid; the resistance is hence assumed to be negligible.The slowest step determines rate controlling parameter in the adsorption process. However, the rate controlling parameter might be distributed between intra particle and film diffusion mechanisms. Whatever the case, external diffusion will be involved in the sorption process. The adsorption of resorcinol onto activated carbon impregnated with phosphoric acid may be controlled due to film diffusion at earlier stages
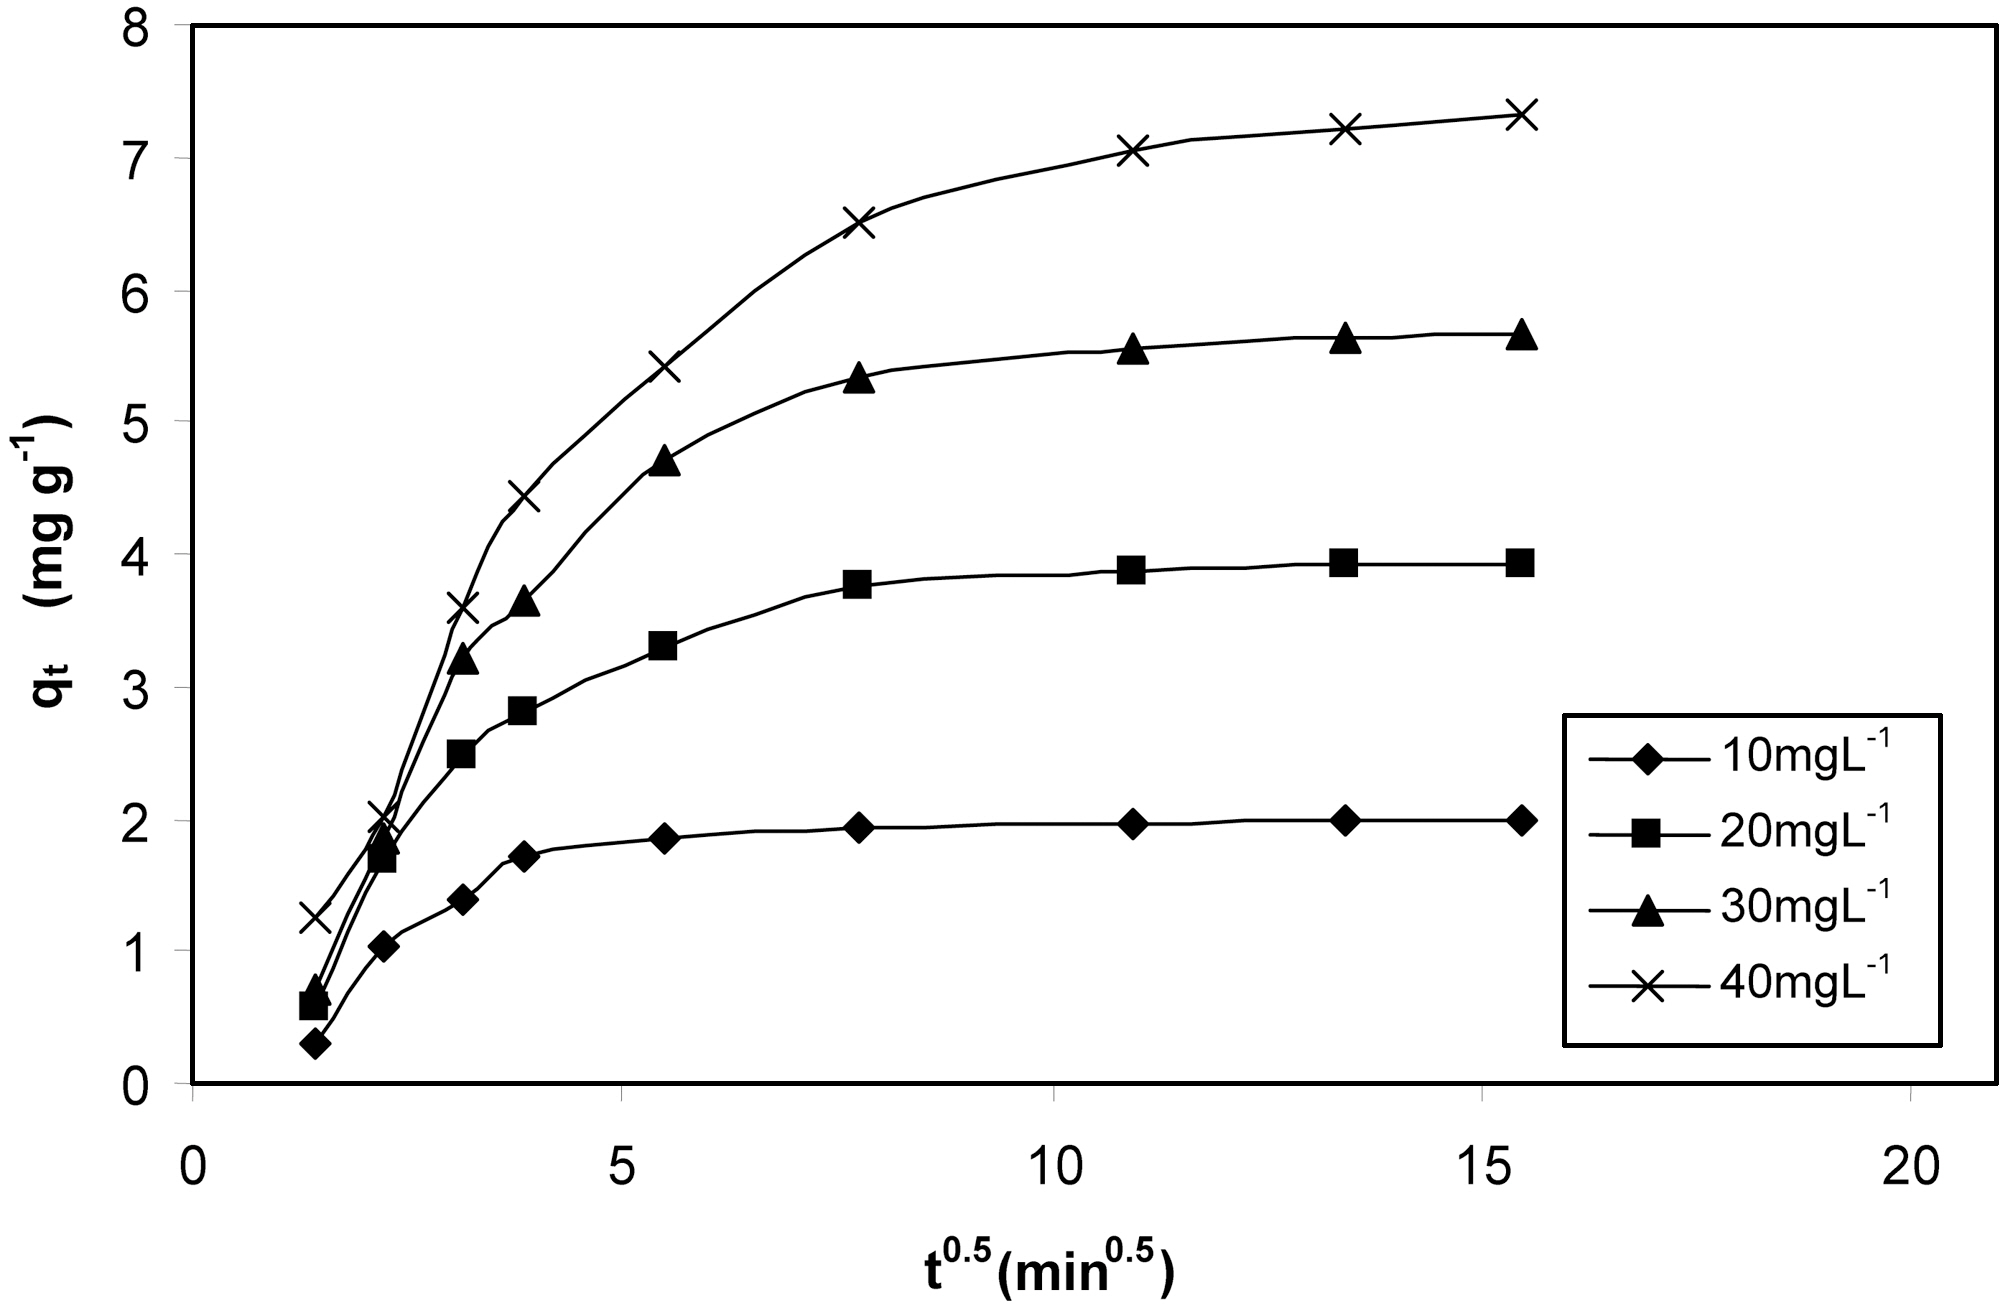
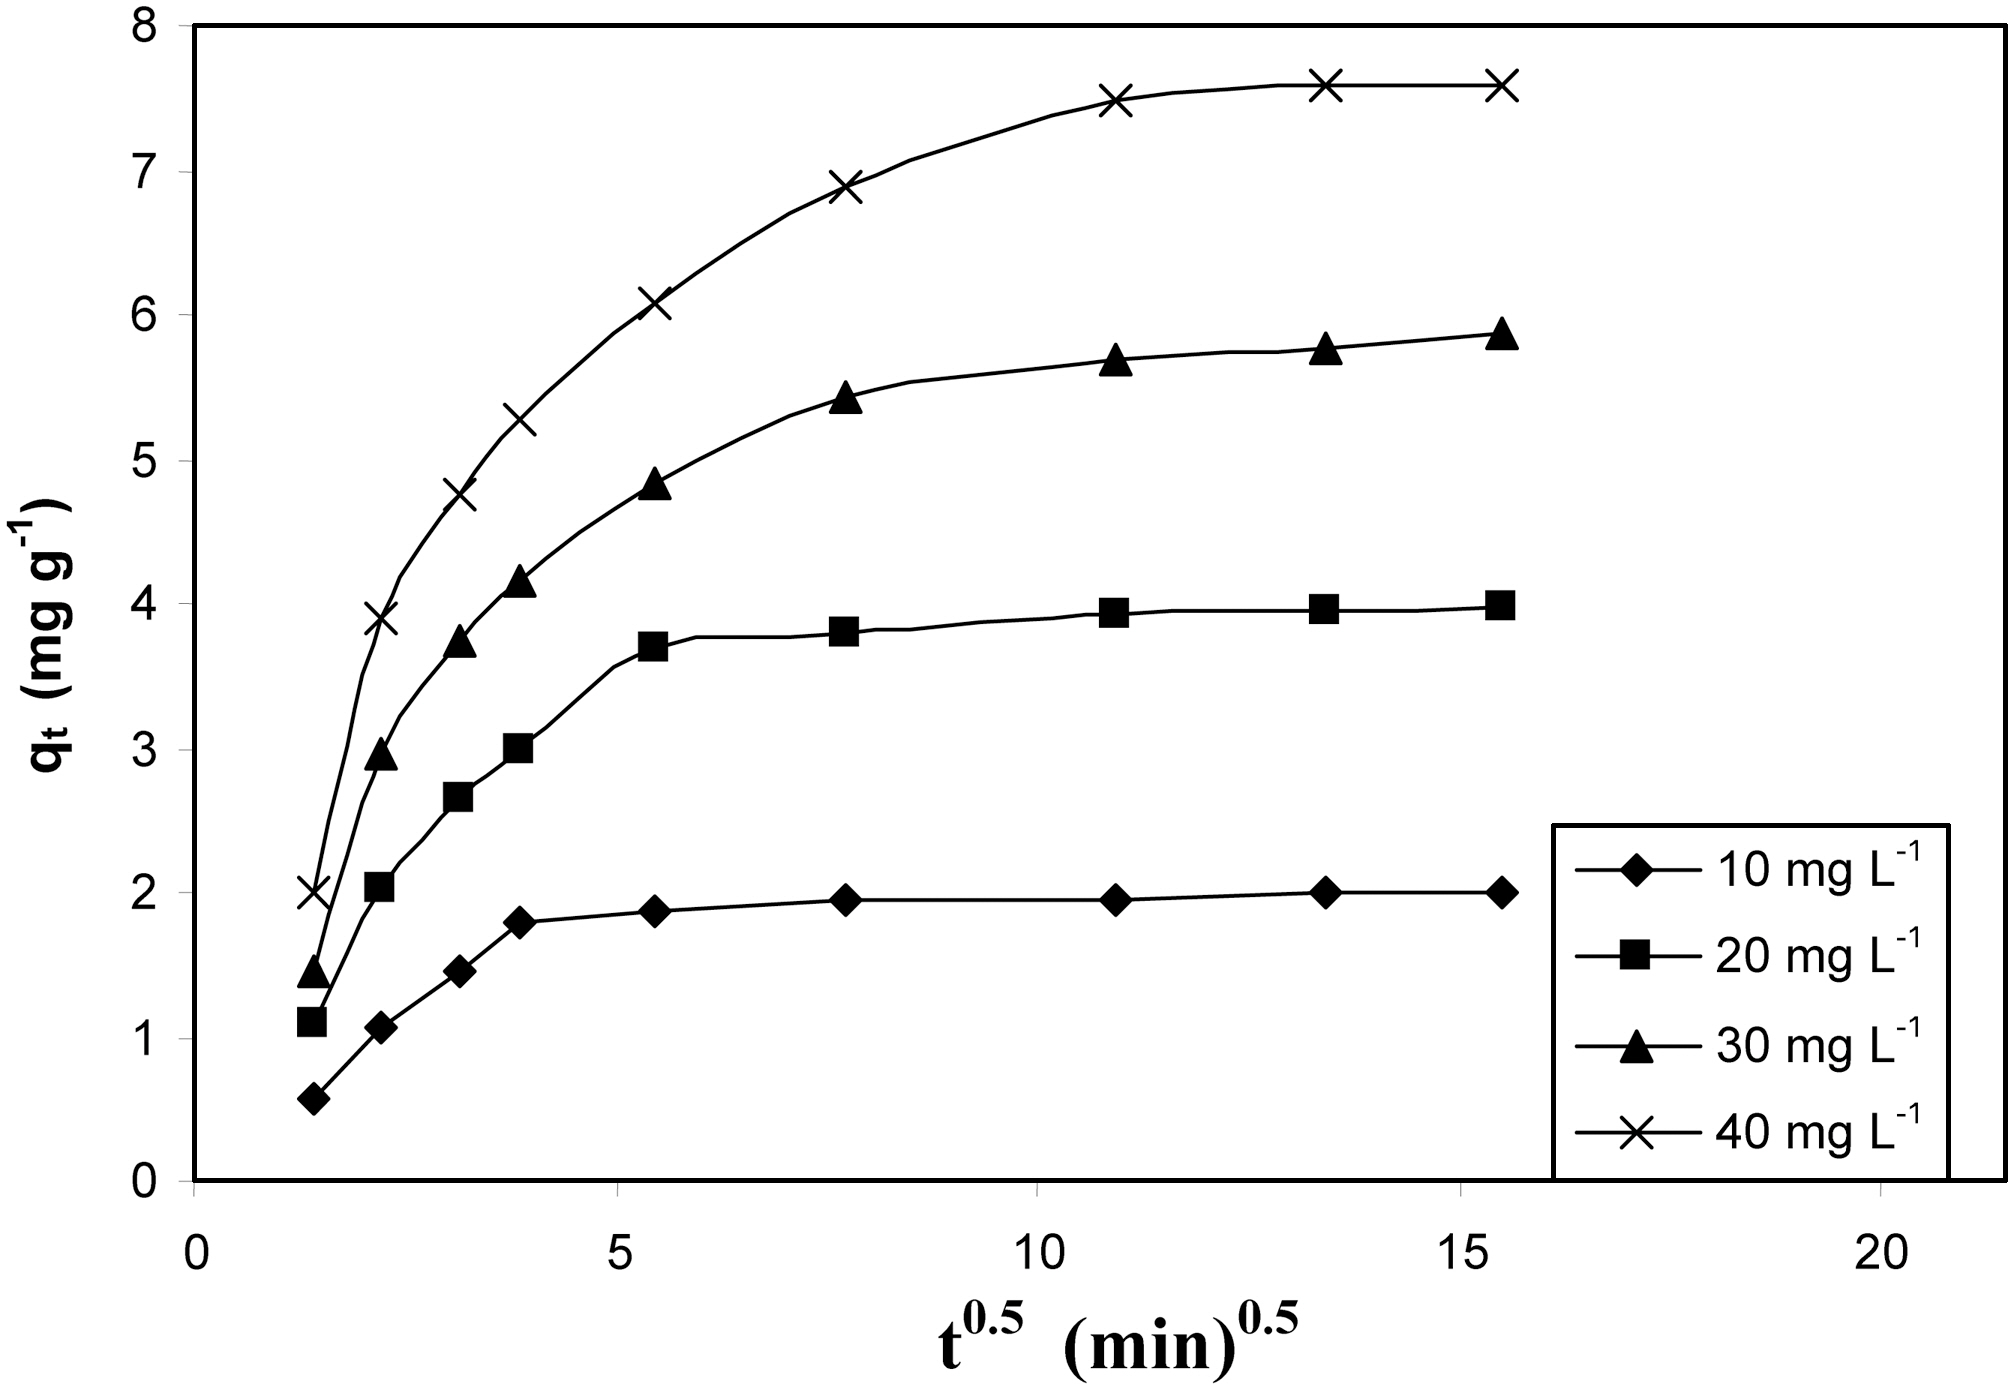
and later by the particle diffusion. The most commonly used technique for identifying the mechanism involved in adsorption process is by fitting an intra particle diffusion plot. According to Weber and Morris [23], an intra particle diffusion coefficient Kid is given by the equation
qt = Kid t0.5
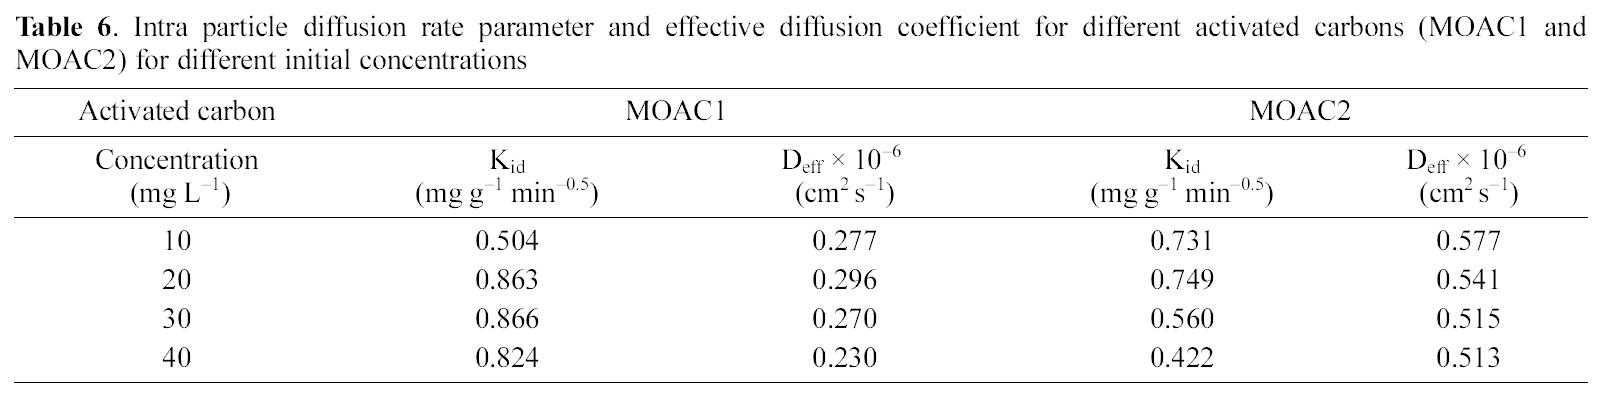
Intra particle diffusion rate parameter and effective diffusion coefficient for different activated carbons (MOAC1 and MOAC2) for different initial concentrations
The plot of qt Vs t0.5 as shown in Fig. 9 and 10 represents different stages of adsorption for both MOAC1 and MOAC2 activated carbons. The initial curved portion relates to the boundary layer diffusion (film diffusion) and the latter linear potion represents the intraparticle diffusion [25, 26]. The slope of the second linear portion of the plot has been defined to yield the intraparticle diffusion parameter Kid (mg g?1 min?0.5). On the other hand, the intercept of the plot reflects boundary layer effect. The larger the intercept, the greater the contribution of the surface sorption in the rate controlling step. The calculated intraparticle diffusion coefficient Kid values are listed in Table 6.
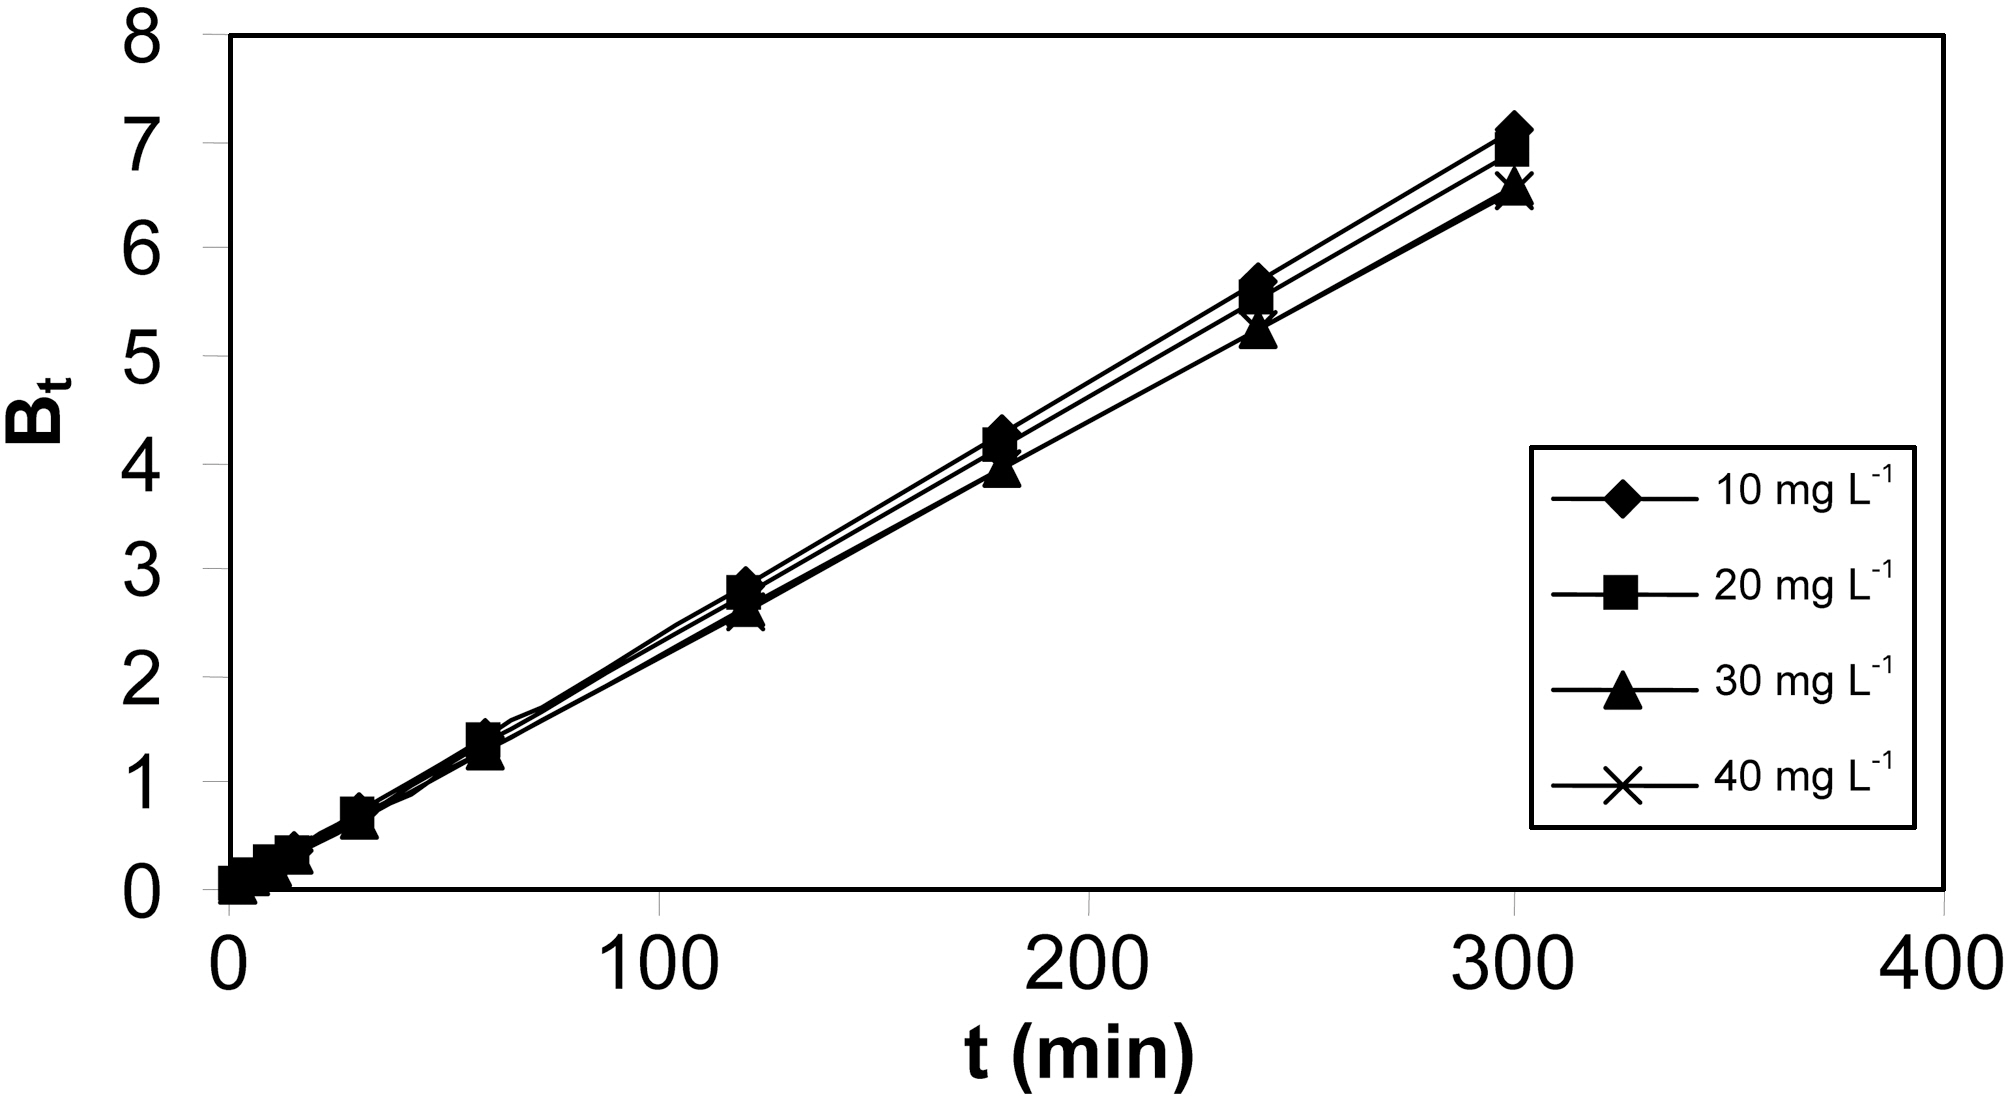
Adsorption kinetic data were further analysed by the procedure given by Reichenberg [27] and Helfferich [28] in order to determine the rate controlling step of resorcinol onto activated carbon made from drumstick bark impregnated with phosphoric acid. Assuming the adsorbent particle to be a sphere of radius ‘a’ and the diffusion follows Fick’s law,the relation between weight uptake and time is given by
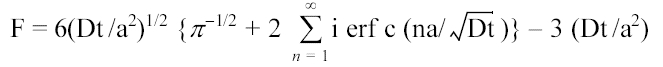

F = qt/qe
where F is the fractional attainment of equilibrium at time t,
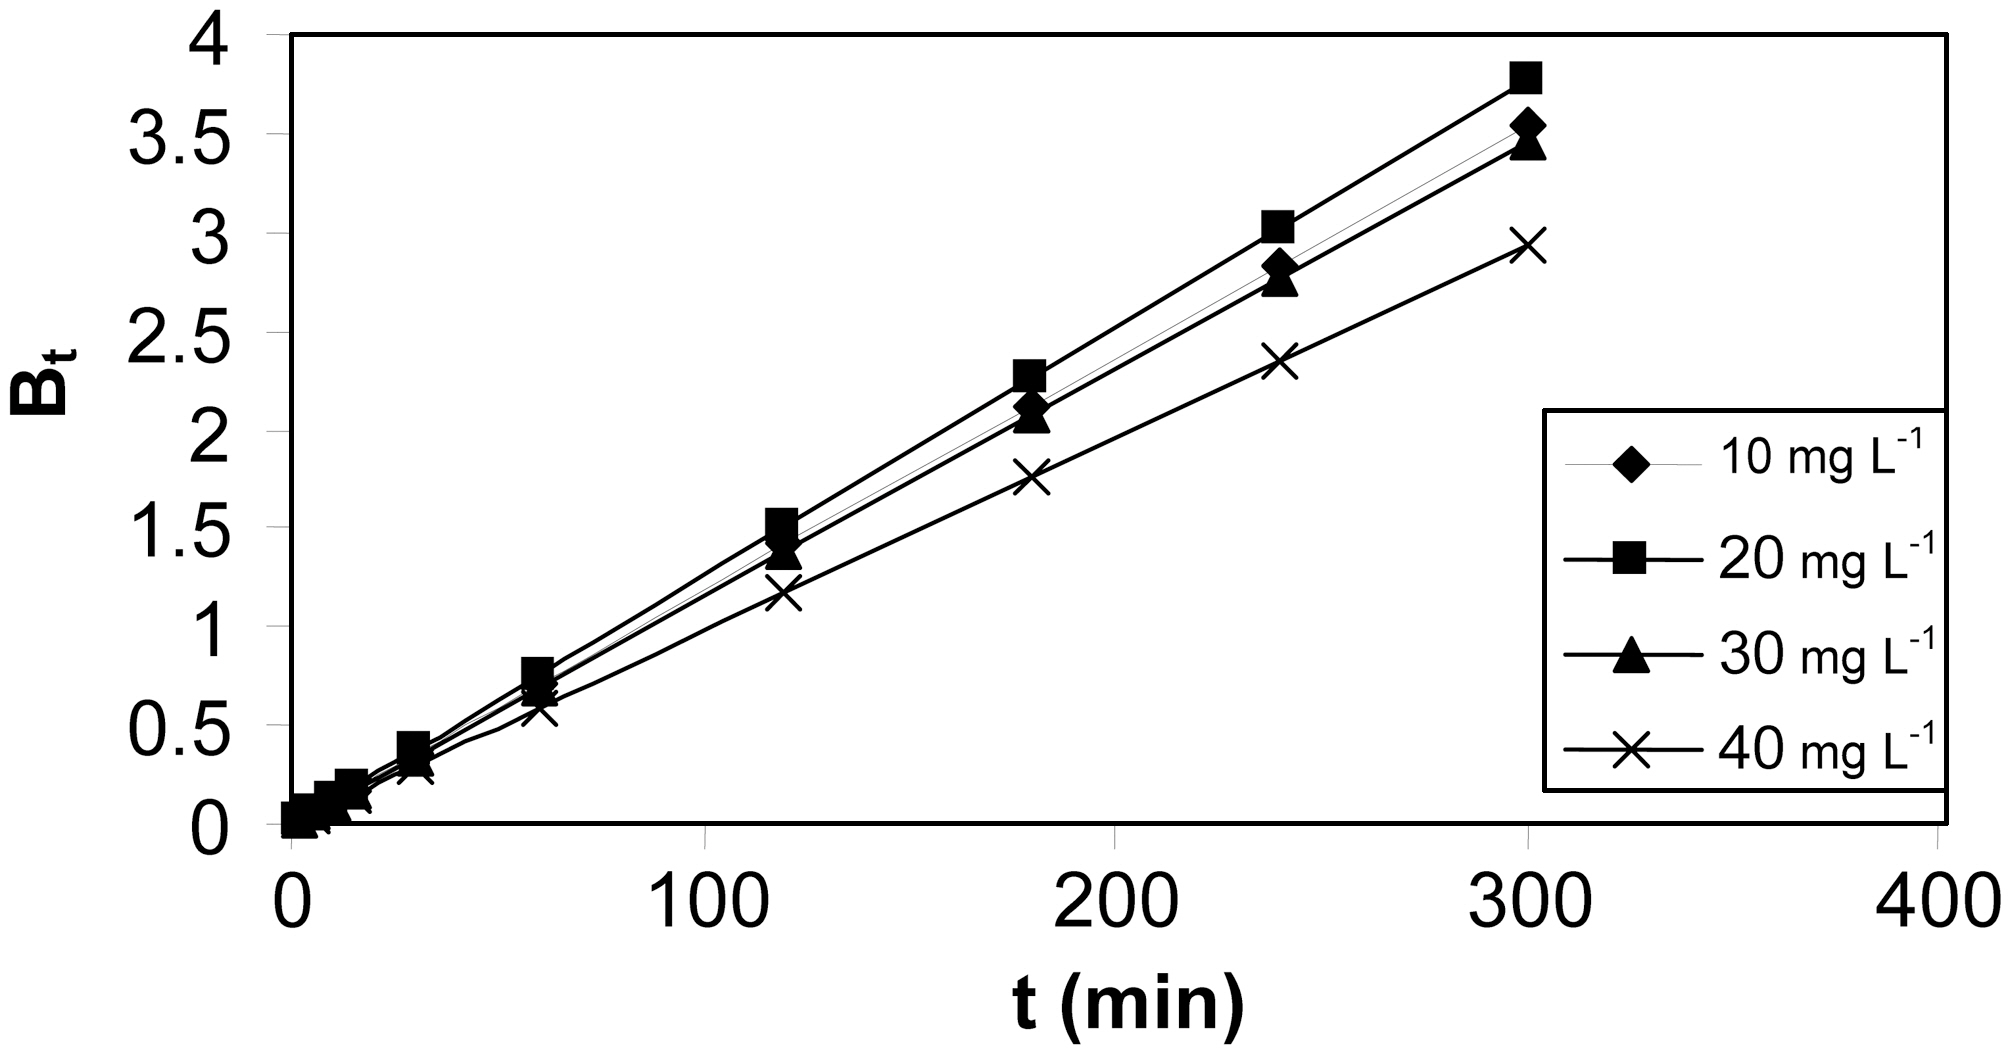
B = π2 Deff/a2
where Deff (cm2/s) is the effective diffusion coefficient.
Linearity test of the Bt Vs t plot was employed to distinguish between the film diffusion and particle diffusion controlled adsorption. The Bt Vs t plot for initial concentrations is shown in Fig. 11 and 12 for both the activated carbons.From the Fig. 11 and 12 it is clear at all concentrations, the Bt Vs t plot pass through the origin, which indicates the particle diffusion to be the rate controlling parameter and film diffusion to be negligible for both the activated carbons.The effective diffusion coefficients for different initial concentrations were found from the slope of Bt Vs t plot and are listed in Table 6.
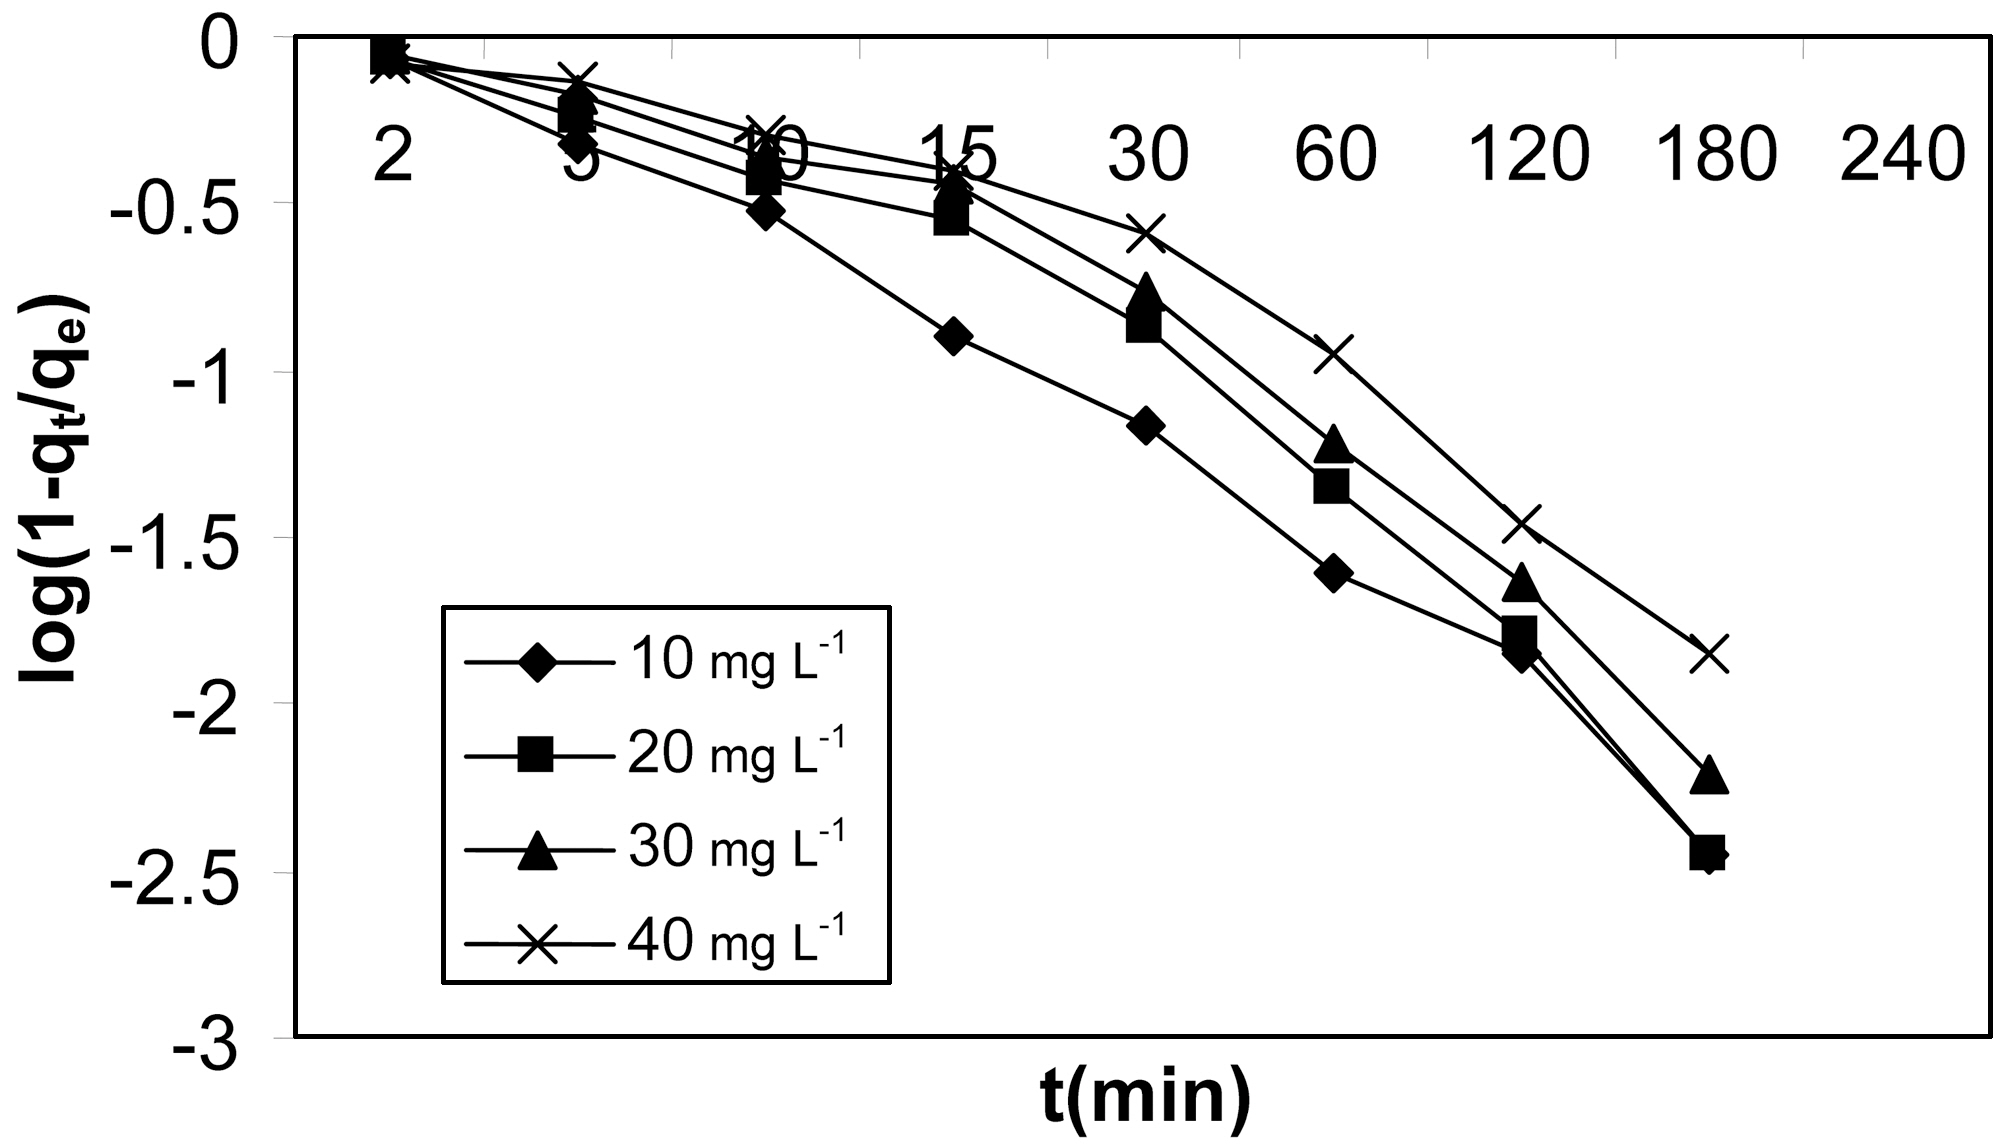
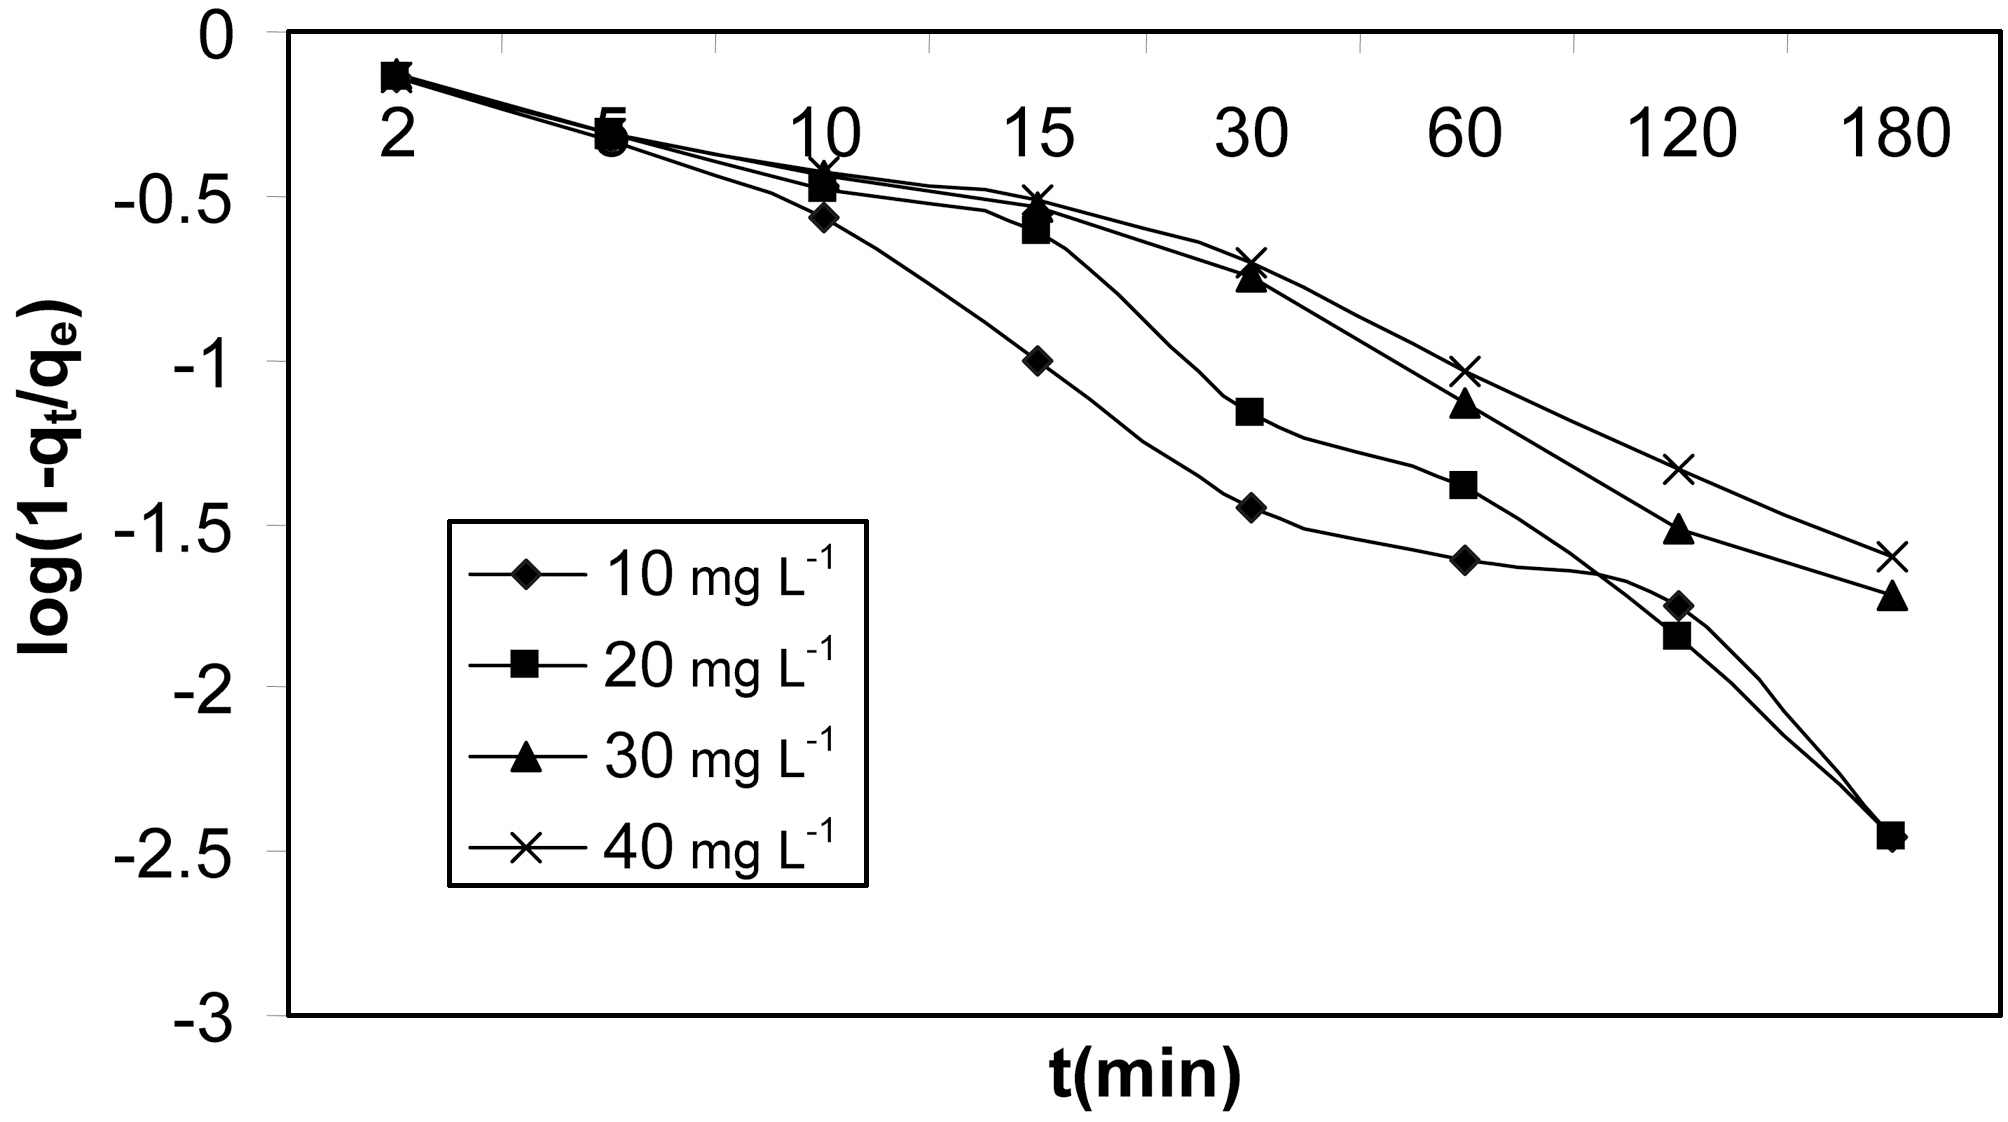
To further verify the above observations, McKay plots of
log(1?F) Vs t at different initial concentrations are shown in Fig. 13 and 14 for activated carbons made from Moringa oleifera impregnated with phosphoric acid in different ratios.These plots are based on the assumption that adsorption follows Fick’s law. At longer times of adsorption,
log (1?qt/qe) = log 6/π2 + (?D2 π2/a2)t,
where D2 is the particle diffusion coefficient.
The rate controlling mechanism was analysed for different initial concentrations using this plot. It can be seen clearly
from Fig. 13 and 14 that for both the activated carbons plots were scattered, which suggests that particle diffusion is rate controlling at all concentrations for both the activated carbons.
The activated carbon prepared from Moringa oleifera with different ratios of phosphoric acid impregnations has been used for removal of resorcinol. Various experimental parameters such as effect of contact time, effect of initial concentration, effect of dosage have been investigated. It was found that the adsorption process reached equilibrium at 4 h for both MOAC1 and MOAC2 activated carbons. The kinetics of resorcinol was described well by the pseudo second order equation. Langmuir and Freundlich isotherms were used to describe the adsorption process and both the isotherms fits the equilibrium data well. The adsorption process of resorcinol onto both activated carbons was found to be controlled by particle diffusion at all concentrations. It was concluded that the activated carbon with 1:2 impregnation of phosphoric acid has better adsorption capacity of resorcinol than 1:1 impregnated activated carbon.
Co : Initial concentration of resorcinol (mg L?1)
Ce : Equilibrium concentration of resorcinol (mg L?1).
W : Weight of the adsorbent (g).
V : Volume of resorcinol taken (L).
qe : Equilibrium adsorption capacity (mg g?1).
qt : Adsorption capacity at time t (mg g?1).
qm, KL : Langmuir constants.
Kf, n : Freundlich constants.
K1 : Pseudo first order rate constant (min?1).
K2 : Pseudo second order rate constant (g mg?1 min?1).
Kid : Intra particle diffusion parameter (mg g?1 min?0.5).
Deff : Effective diffusion coefficient (cm2 s?1).
F : Fractional weight uptake.
a : Radius of the adsorbent (cm).