Activated carbons are profusely used as adsorbents for depollution processes because of their extended surface area, high adsorption capacity, porous structure and specific surface reactivity [1]. Activated carbon adsorbs molecules from both liquid and gaseous phases depending upon the pore size and pore size distribution of the adsorbent. However, the control of pore sizes in the synthesis of activated carbons is an important aspect but not much literature is available. The type of raw material used usually defines the type of porosity to be generated on pyrolysis. For adsorption from gas phase, mainly micro porous carbon is used whereas, meso porous carbon is applied in liquid phase process. In general both large surface area and wide pores are desirable. Large surface area allows large adsorption amounts and wide pores enhance diffusion, which influences the overall kinetics of adsorption. It has been shown that activated carbon can be successfully produced from a wide range of agricultural wastes such as apricot stones, bagasse, grain sorghum, nutshells, plum kernel, and rice husk [2-10] and from various municipal wastes such as PET waste, sewage sludge, discarded tires, and refuse derived fuel [11-15]
Two general methods are used for the preparation of activated carbon [16-18] one, the “physical activation”, consists of heating at a high temperature (e.g. 800℃) under a carbon gasification reactant (H2O or CO2). The other method, “chemical activation”, consists of heating at a relatively lower temperature (e.g. 500℃) with addition of dehydration agent. (e.g.H3PO4).
The production of activated carbon with desired pore size distribution and surface chemistry from low cost precursor and at low temperatures is an important challenge. Laine and Yunes [19] studied changes in pore size distribution in activated carbons, prepared from a coconut shell employing the three activation process, i.e. physical activation, chemical activation and physical-chemical activation method. According to Jagtoyen et al. and Benaddi
Pine wood was shaped, dried at 100℃ for 2~4 days and subsequently, carbonized under inert nitrogen atmosphere at 750℃ for 6 h in an electrically heated furnace with slow heating rate 10℃/h up to 350℃, 15℃/h up to 550℃ and higher rate of 20℃/h up to peak temperature, resulting in a crack free bio carbon template (charcoal). Monolithic porous carbon materials were characterized by the physical parameters such as, dimensional changes, true density and bulk density. Reduction in dimensions (shrinkage) along axial and radial direction of the sample caused by heat treatment was determined using correlation between sample size measured before (Db) and after carbonization (Dc).
RD%= (1 -Dc/Db) ×100%
In this pyrolysis approximately 70±5% of the starting weight of wood was lost and volume was also reduced at the same time by about 60±5%. After pyrolysis percentage axial, radial and tangential shrinkages were 28.47, 20.93, and 11.9 respectively. Before pyrolysis the density of pine wood was 0.51 g/cm3, and it reduced to 0.44 g/cm3 after pyrolysis. Pine wood contains 24.2% carbon and 0.38% of ash. After pyrolysis, samples were activated at 750℃ in a steam atmosphere to increase their surface area and micro porosity. The thermal characterization (TGA) was carried out by using Mettler TG 50. The thermal analysis was carried out in nitrogen as well as in air from ambient to 1000℃. The thermal degradation of wood was studied by carrying out analysis in nitrogen while ash content was determined in air. The surface area of samples and surface characteristics of the samples were determined by Using BET 2375 (Micromeritics-Gemini) apparatus. The structure of raw, carbonized and activated wood was observed using scanning electron microscope (SEM), Hitachi S-3000N.
3.1. Conversion of wood in to carbon template
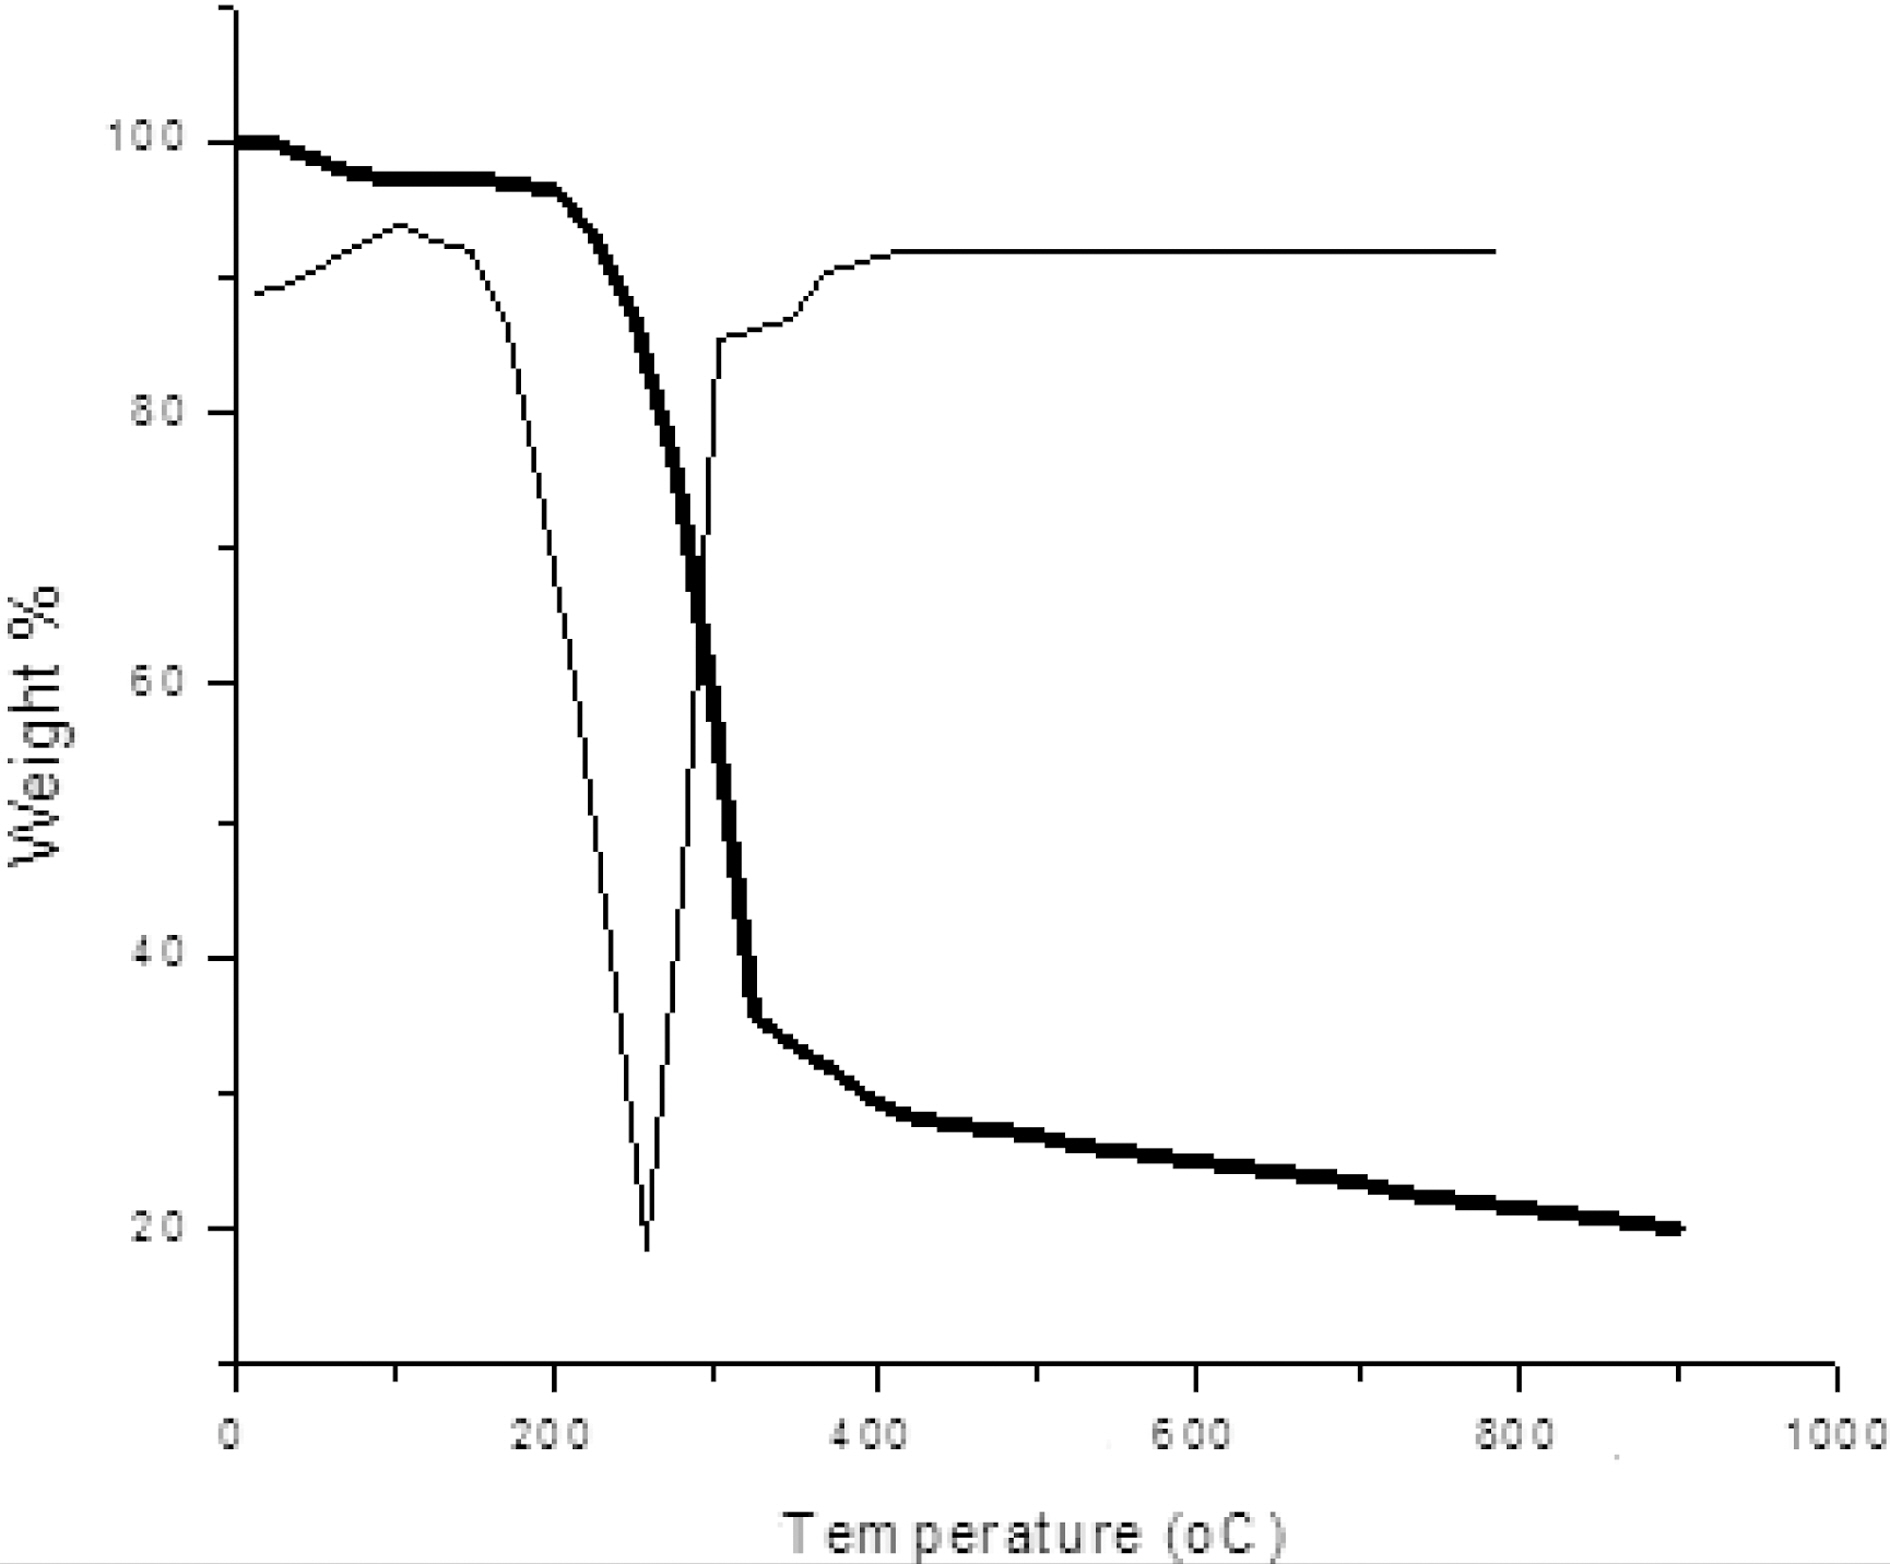
Fig. 1 shows TGA-DTG curve of pine wood carried out in nitrogen atmosphere. The initial weight loss begins at around 100℃ due to presence of moisture. Further weight loss was observed in temperature range between 240~350℃ due to
decomposition of hemicelluloses and also volatile present in the wood. A major weight loss occurred in the temperature range of 280~500℃ due to decomposition of cellulose and lignin leaving behind a carbon preform. After 500℃, very little weight loss occurred as shown in Fig. 1.
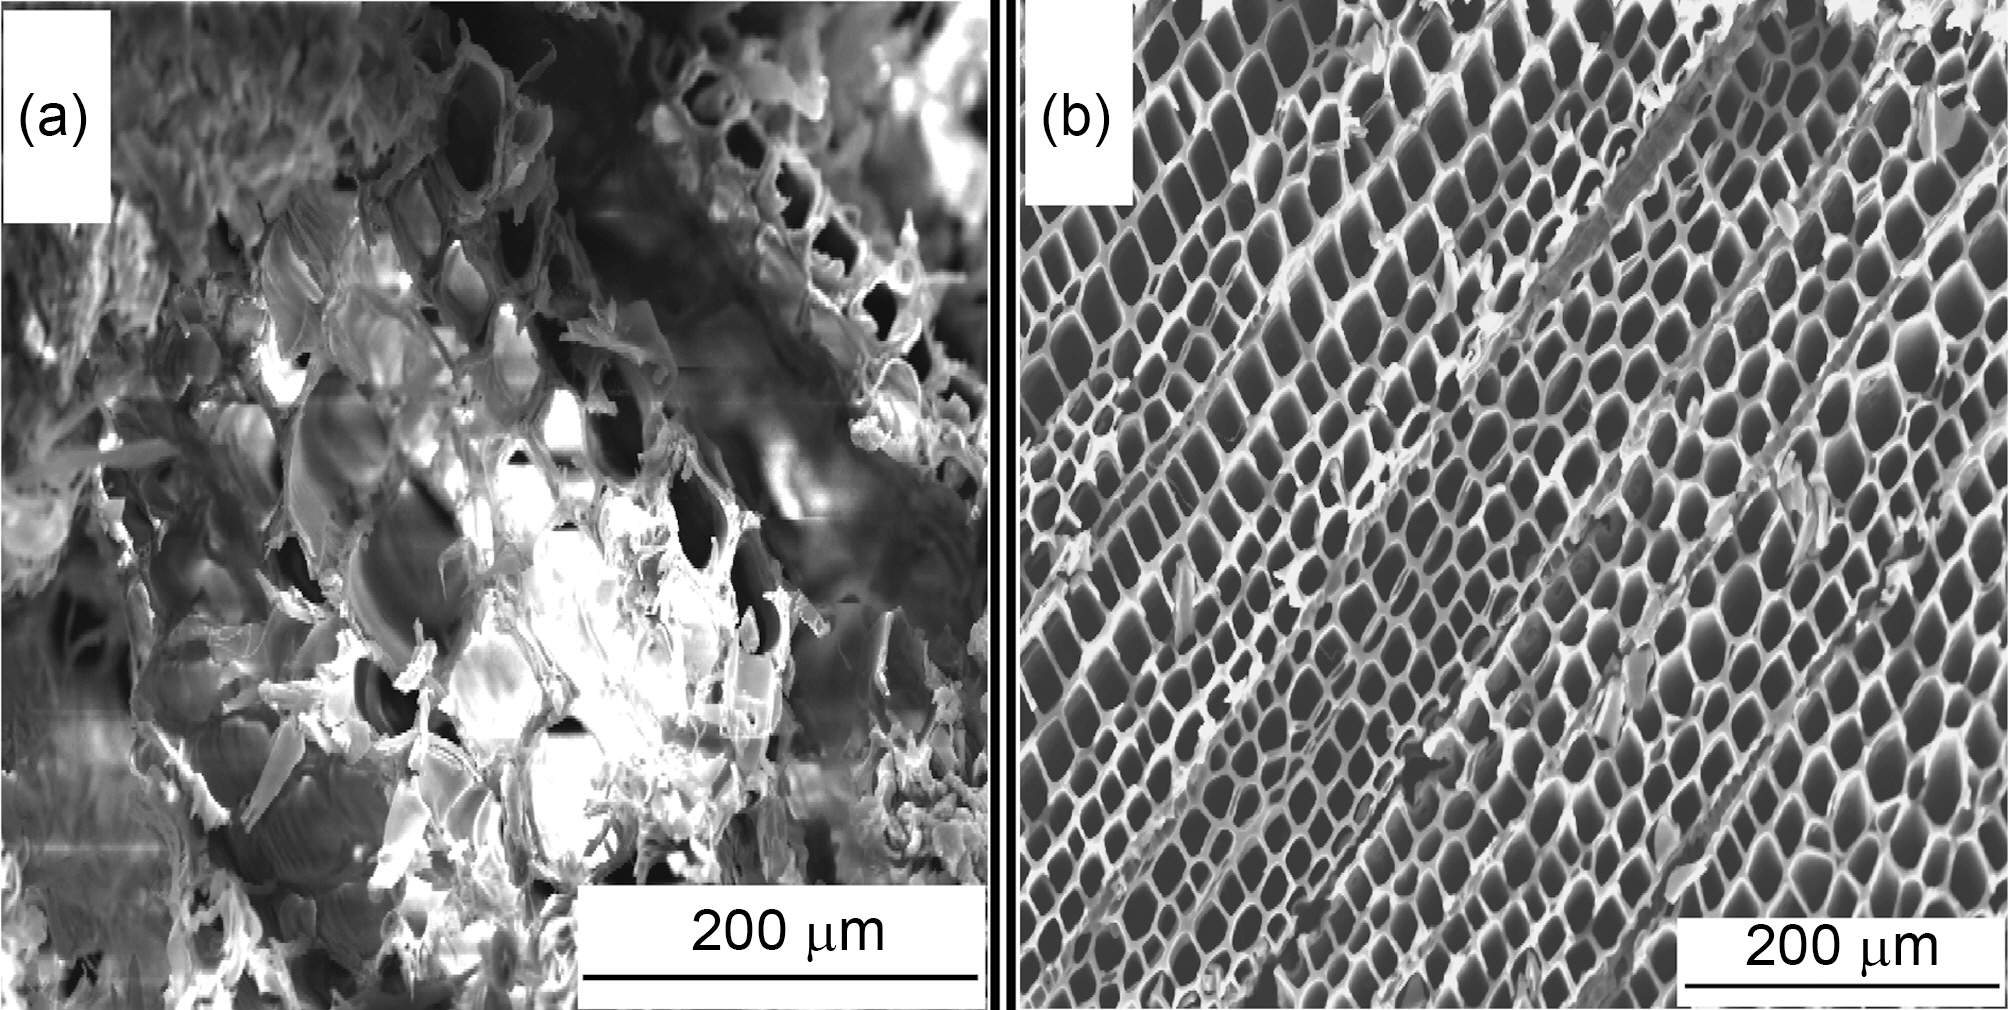
The micrograph of pine wood as such is shown in Fig 2(a). It shows a porous network. But the pores are not clear. These contain certain cellulosic products. On pyrolysis, the wood gets decomposed into smaller molecules, while the walls of the struts retain their morphology. The filled mass gets highly decomposed resulting in clear pore structure. (Fig. 2(b))
The pyrolysed wood was characterized for its surface are by BET methods using adsorption of nitrogen at liquid nitrogen temperature. The condensation of nitrogen did not take place into the pores of pyrolysed sample. Therefore to clean the pores activation with steam was carried out.
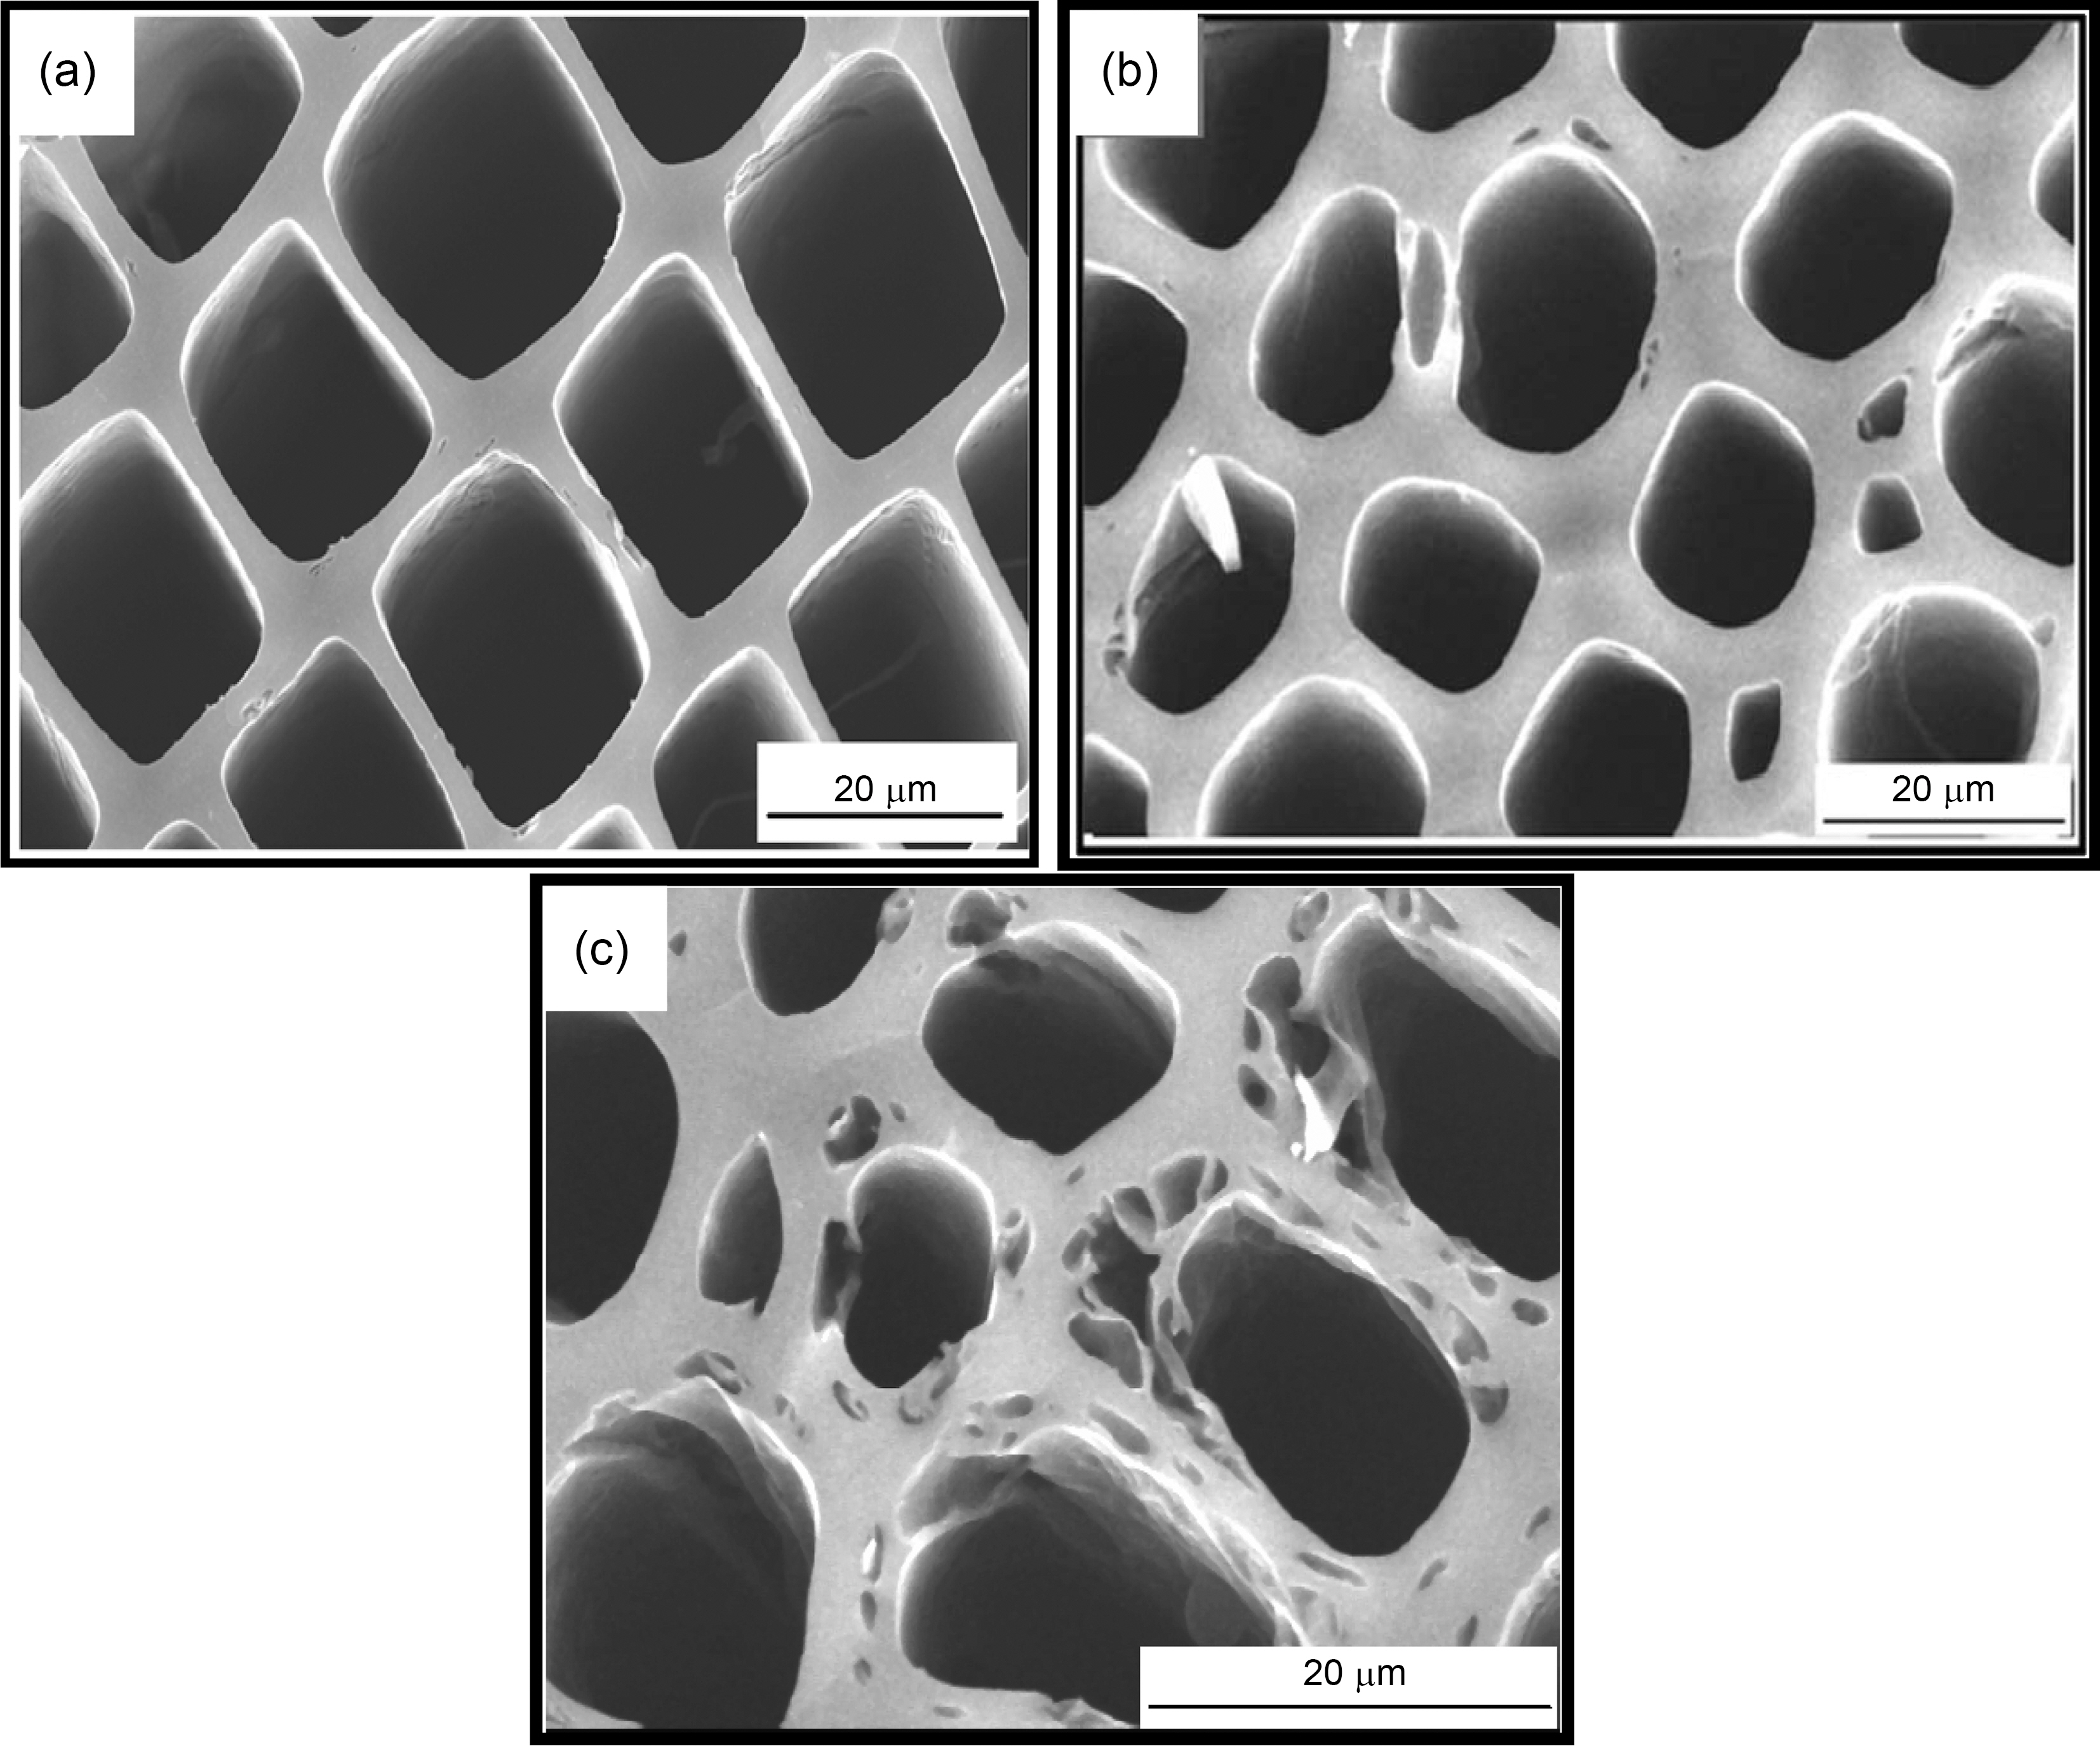
The carbonized samples were activated at 750℃ by using steam. The steam was preferred for activation because the water molecule has smaller dimension and it leads to faster diffusion in to porous network, easier access in to micro pores, i.e. approximately three times faster than the carboncarbon dioxide reaction, at a temperature of 800℃ and a pressure of 10 kPa [30]. During reaction steam removes carbon atoms from the network within solid carbon. As a result either new pores are created or clogged pores gets opened up Fig. 3 shows SEM micrograph of activated carbons. It is well known that reaction of carbon with steam is thermodynamically endothermic [18] and the mechanism can be expressed as


[Table 1.] Physical properties of activated carbon derived from pine wood under different steam rate
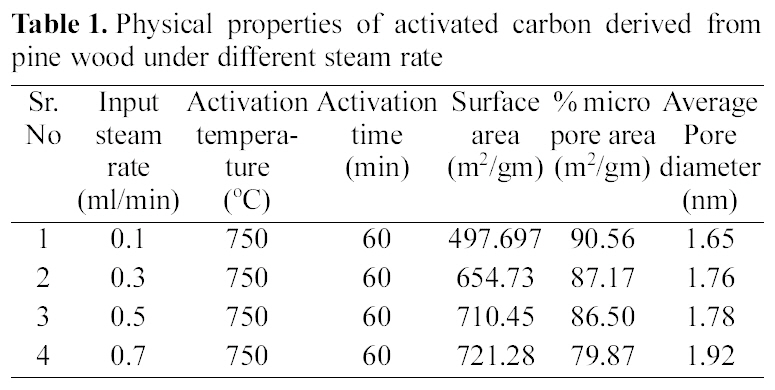
Physical properties of activated carbon derived from pine wood under different steam rate
The pyrolysed samples were activated with steam at 750℃ for one hour with diffrent flow rate of steam varying between 0.1~0.7 ml/min. The activated samples were characterised for surface area, microporosity and average pore diameters. The reults are shown in Table 1.
These results show that on activation with steam passing from 0.1~0.7 ml/min, surface area goes on increasing. The Fig. 3 (b and c) shows well distributed pores in activated carbon a with flow rate of 0.1 and 0.7 ml/min of steam. With increasing flow rate, not only the original voids get enhanced
[Fig. 5.] Correlation of effect of steam rate versus percentage micropore and average pore diameter.
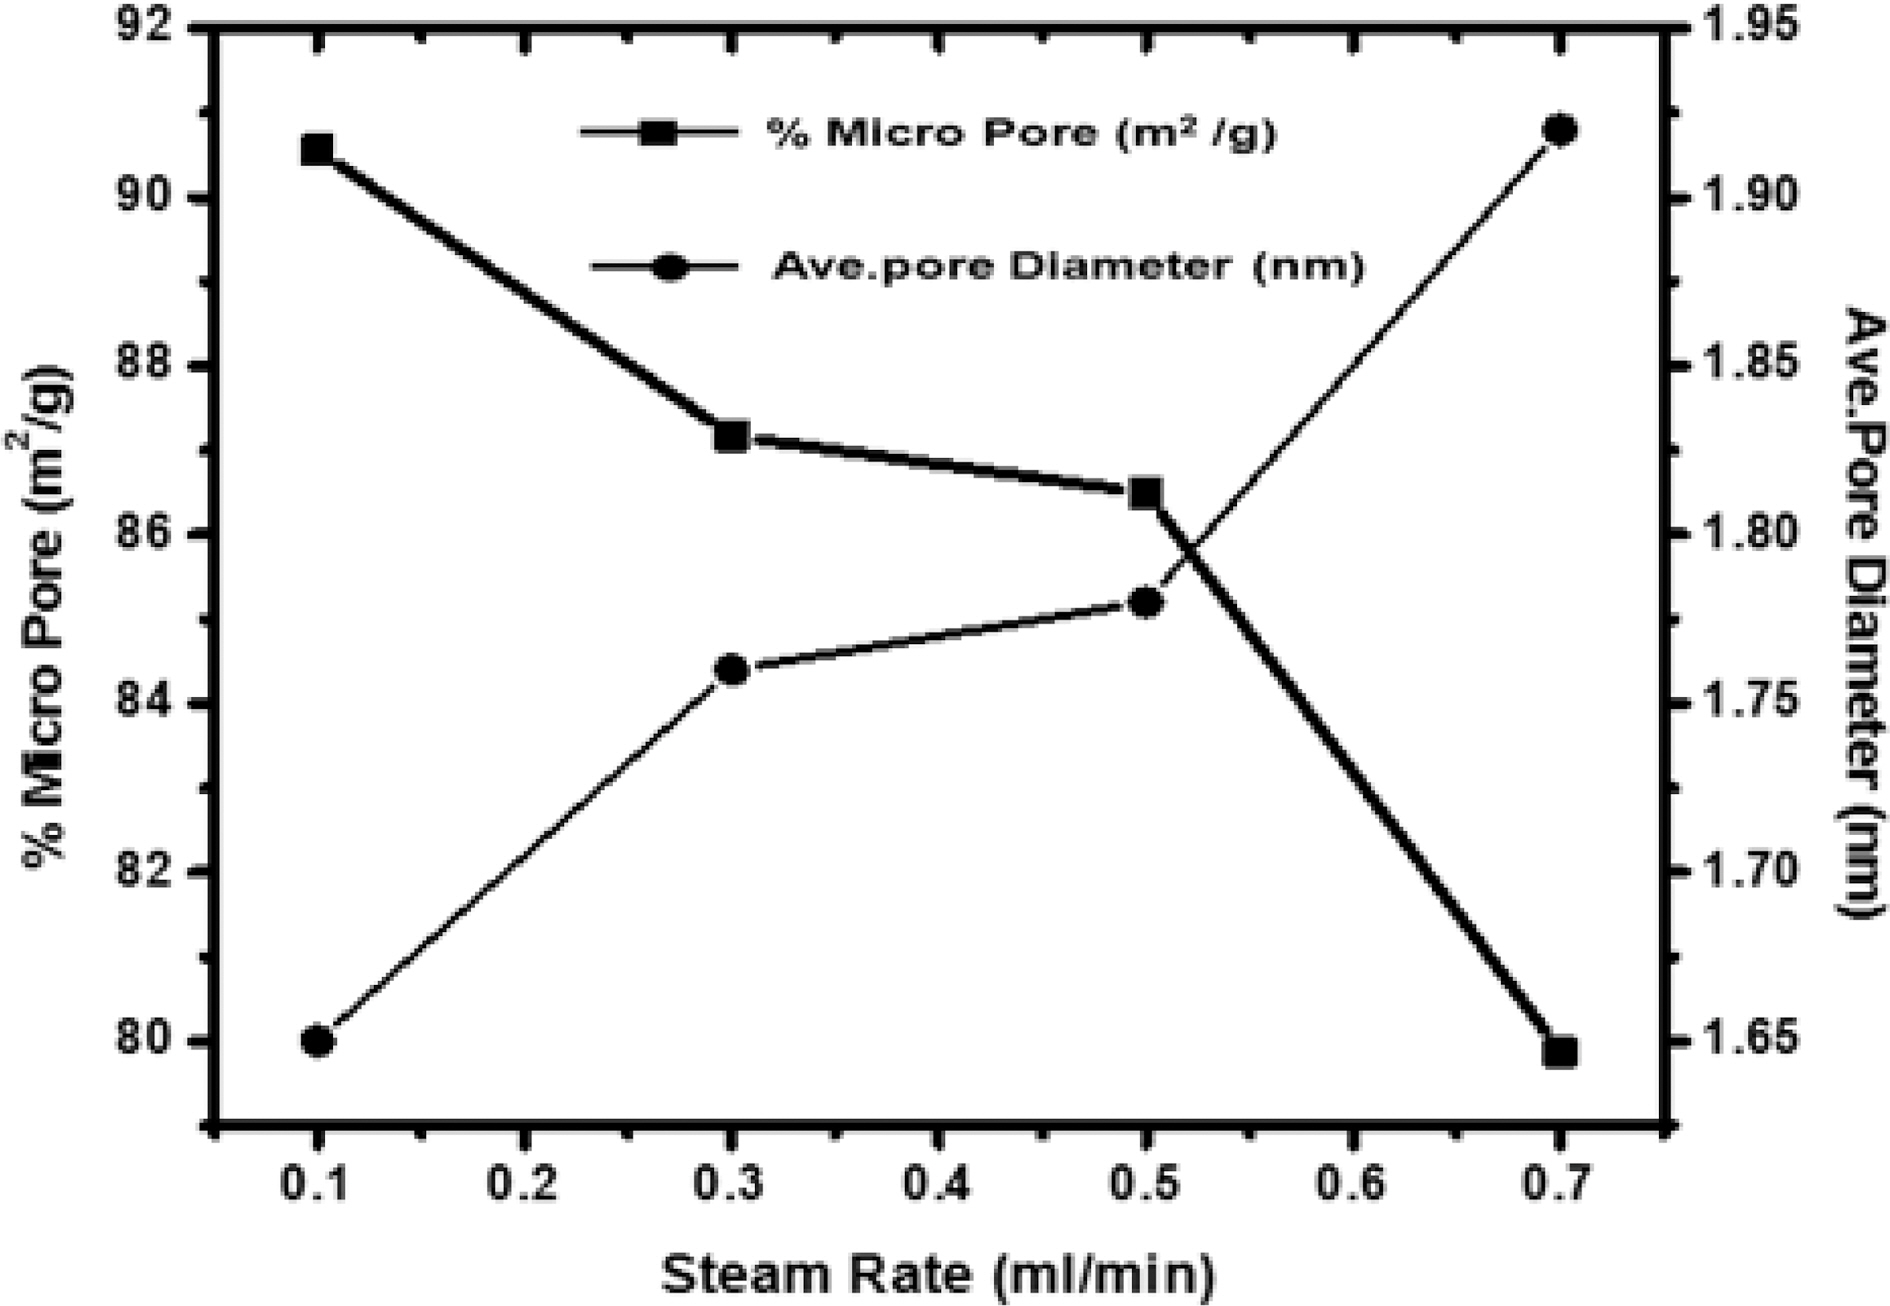
but the carbon constituting the walls of the pores get removed resulting in new pores. Though the surface area of all samples increases on increasing the flow rate of steam, but due to higher flow rate, diffusion is faster resulting in collapsing of pore walls, hence the micropores get widened [Fig. 3 (b and c)] and average pore diameter increase from 1.65 nm to 1.92 nm, also % microporosity also falls from 90% to 79%
These results show that on activation with steam with increasing flow rate, not only the original voids get enhanced but the carbon constituting the walls get burnt to carbon dioxide leaving behind pores.
3.4. Surface area analysis by BET method
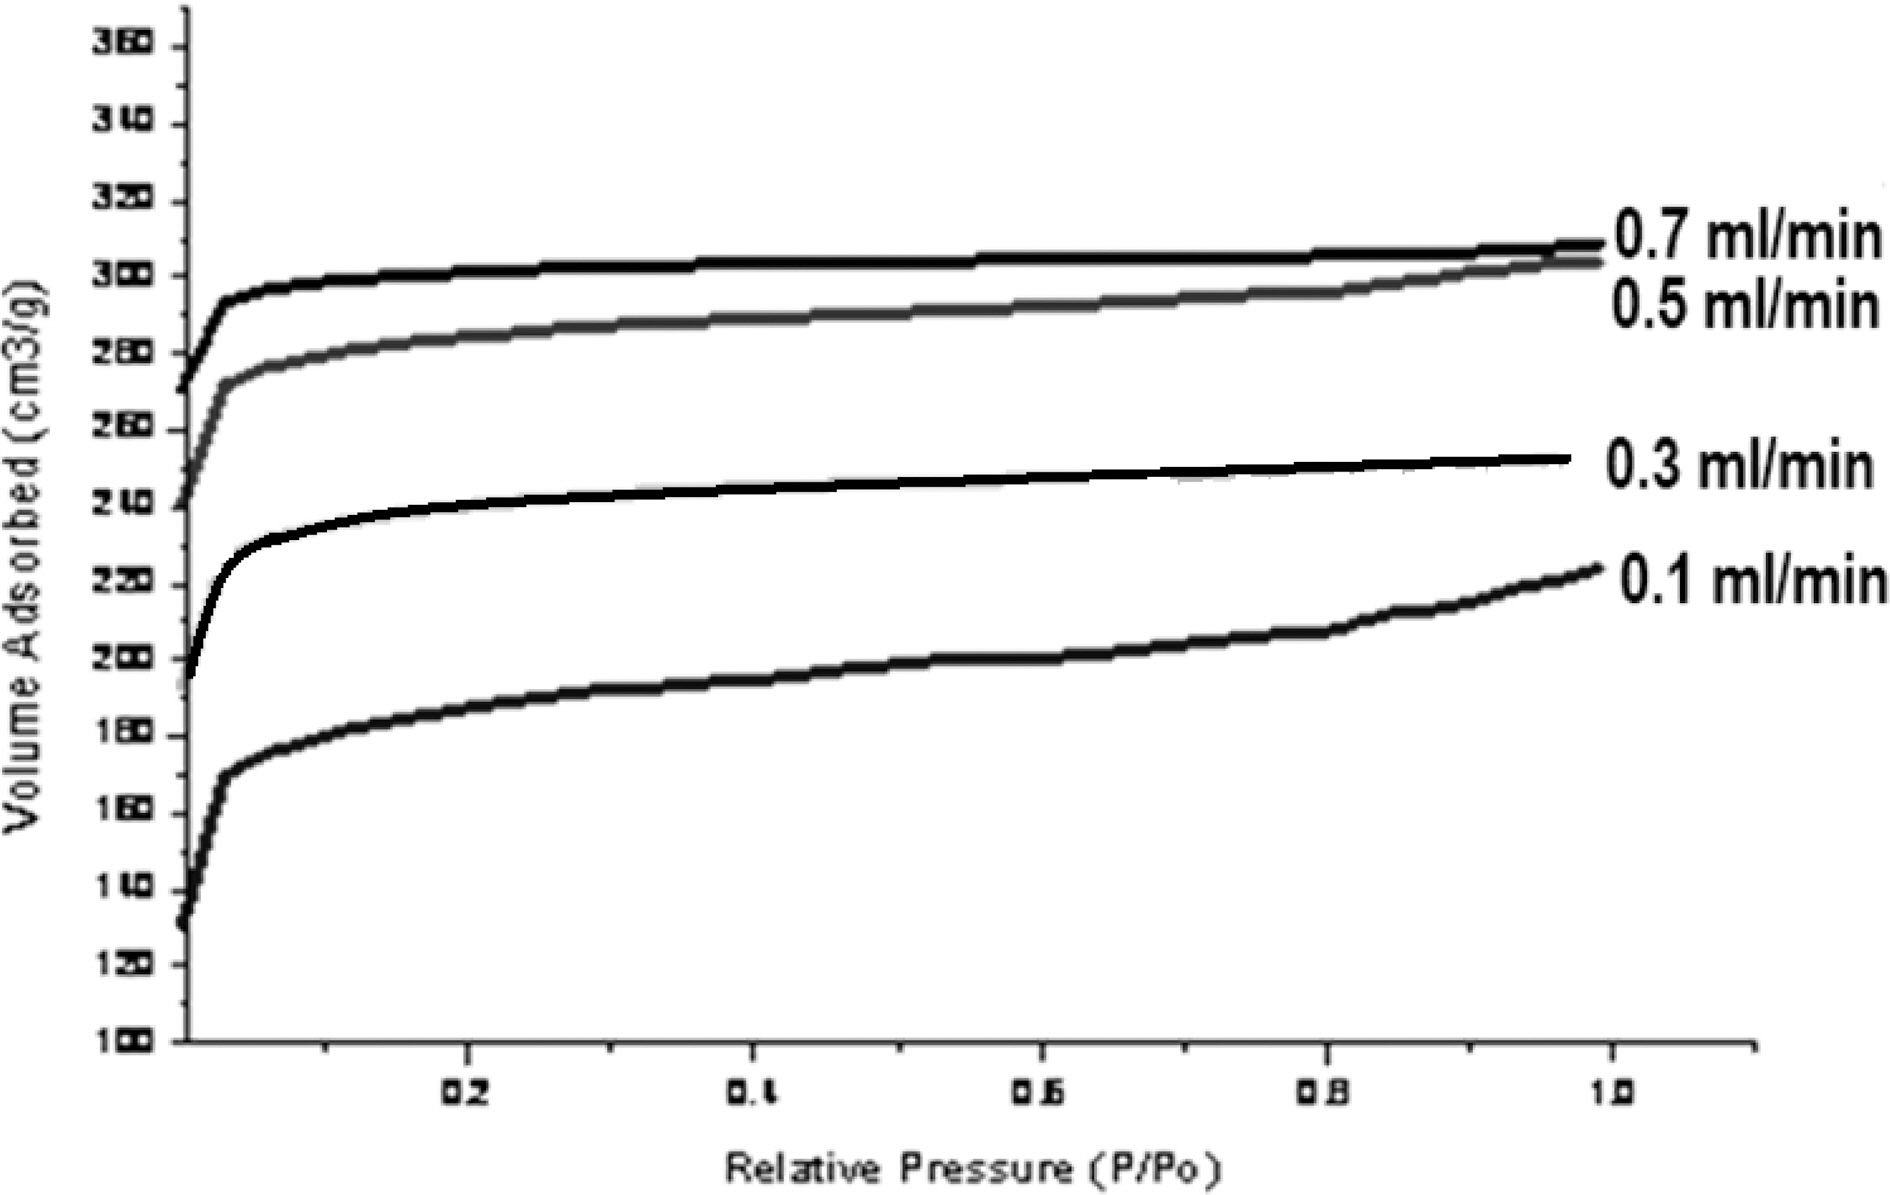
Macro pore enable the molecule of the adsorbate to pass rapidly to smaller pore situated deeper within the particles. The adsorption in macropore is insignificant, while the micro pore have large internal surface area and contributes significantly to adsorption. Since the average micropore area increase due to activation process, adsorption capacity of carbon also gets increased. Fig. 4 shows nitrogen adsorption isotherms of activated carbons.
All samples show type I adsorption isotherms, i.e. microporous carbon. The volume of nitrogen adsorbed is seen to be increasing with increase in steam flow rate, being hightest for sample activated by 0.7 ml/min and minimum for sample activated by steam at flow rate of 0.1 ml/min. The comparison of surface characteristic of activated carbons complied in Table 1 further show that the surface area shows an increase with increasing flow rate of steam, while percentage micro porosity decreases with increasing the flow rate of steam during activation process. Hence the micro porosity and surface area can be controlled by controlling the flow rate of steam during activation process.
Fig. 5 shows the variation of microporosity and pore diameter with changing the flow rate of steam. Though micro-porosity, shows an increase with increasing flow rate of the steam up to 0.3 ml/min. Further increase in the flow rate, decreases the microporosity as higher rate results in high rate of oxidation of carbon to carbon dioxide leading to fall of pore walls and widening of pores. Any further increase up to 0.7 ml/min, decrease the microporosity while the surface is found to increase. Due to high rate of oxidation beyond 0.7 ml/min leads to fracture of the materials and entire structure collapse. Though, the average pore diameters in all samples were less than two nano meter show samples were microporous. Also, the sample activated with steam flow rate 0.1 ml/min has smaller pore volume than sample activated with steam flow rate 0.7 ml/min. Thus though with higher flow rate of steam higher surface area can be achieved but the flow rate of steam can generate pores of specific size for specific adsorption. i.e. small pores for small molecules and bigger pores for bigger molecules which is quite evident from the Fig. 5.
Activated carbon of known pore size and % microporosity can be developed by controlling the flow rate of steam during activation process. By controlling the parameters of activation process tailor made porous material can be developed from cellulosic materials. Hence cellulosic wastes can be used as a potential precursor for activated carbon with known pore size and microporosity by controlling the flow rate of activating agent.

![Scanning electron micrograph of (a) as such pine wood and (b) pyrolysed pine wood [both micrographs are in axial direction].](http://oak.go.kr/repository/journal/10396/HGTSB6_2010_v11n3_201_f002.jpg)