Titanium dioxide (TiO2) is the most widely used photocatalyst, mainly because of its photostability,nontoxicity, low cost, and insolubility in water under most of the environmental conditions. TiO2 has been demonstrated to be an effective degradation method for many organic pollutants especially for the detoxification of water and air [1-4]. Most of the studies have been carried out with spherical TiO2 nanocrystals, which show higher photocatalytic efficiency subsequent to a reduction in the particle size, resulting in a large surface-to-volume ratio.However, in the practical process of photocatalysis, the separation of these fine-powdered photocatalysts from solution after completion of the reaction could be very difficult [5]. Moreover, under certain experimental conditions,nanoparticles have a strong tendency to agglomerate into larger particles, thus decreasing the photocatalytic activity [6]. TiO2 fibers can be easily separated from solution, and thereby the disadvantages arising due to the use of spherical TiO2 catalysts can be overcome.Especially, non-woven TiO2 fibers can be suitable for surface area-dependent materials such as photocatalyst. An electrospinning method has been widely studied because of its efficiency and simplicity for the production of nonwoven fibrous structures with microscale to nanoscale dimensions [7]. The morphologies and properties of the fibers depend on the properties of the polymer and the process parameters such as the average molecular weight of the polymers, solvents, viscosity and conductivity of the solution, strength of the applied electric field, and deposition distance [8].
In order to improve removal of pollutants, TiO2 complex has been studied using binary semiconductor oxide system,such as TiO2/SnO2, TiO2/ZrO2, and TiO2/MoO3[9], and carbon material/TiO2 complex [10]. Especially, presence of activated carbon (AC) with TiO2 enhances photoefficiency of TiO2 catalyst and AC has the high adsorption capacity with organic molecules [10]. Furthermore, the synergistic effect between powdered TiO2-AC has been observed of organic pollutants such as phenol and 4-chlorophenol [11,12]. One important consideration in the solid-photocatalyzed reactions is the adsorption of the organic compounds on the surface of photocatalyst particles. It has been often reported that adsorption is a prerequisite for highly efficient degradation of organic pollutants [13,14].
In this study, TiO2-Activated carbon (AC) complex fibers were prepared by electrospinning for the synergetic effect of adsorption and degradation of organic pollutant.Electrospun TiO2-AC complex fiber with adsorptivity of activated carbon was investigated by changing AC/TiO2 ratio.
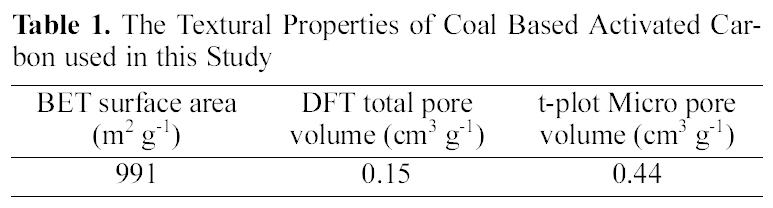
[Table 1.] The Textural Properties of Coal Based Activated Carbonused in this Study

The Textural Properties of Coal Based Activated Carbonused in this Study
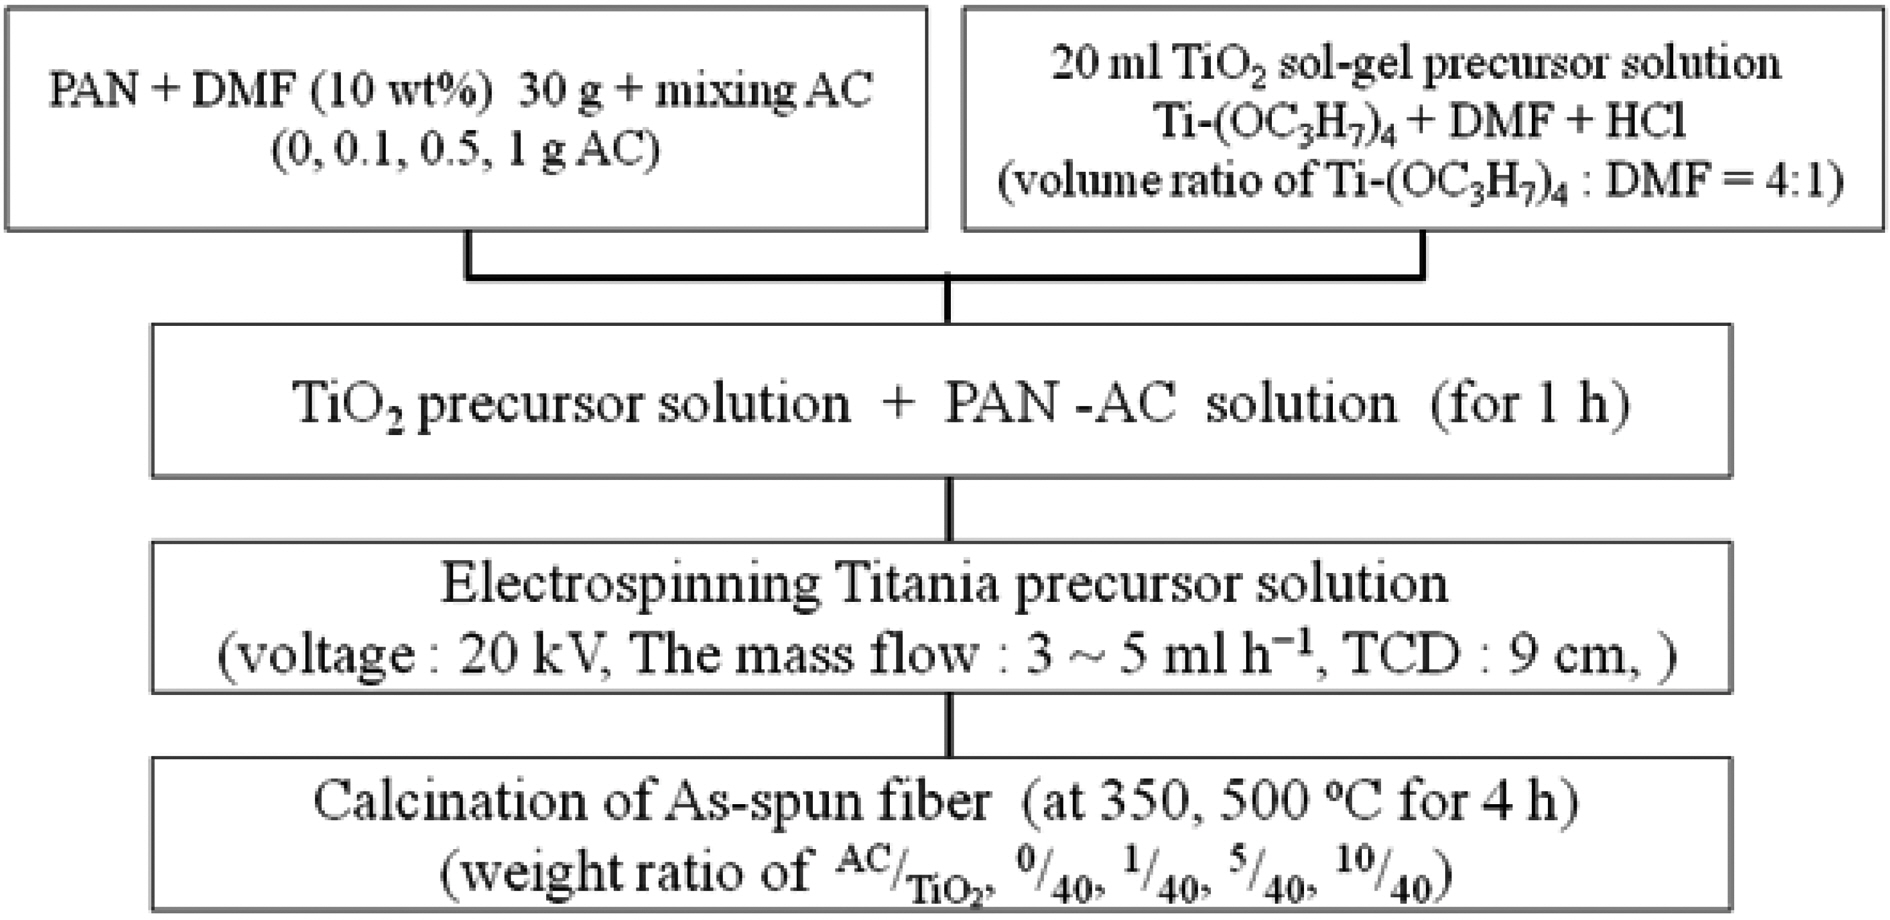
2.1. Preparation of TiO2-AC complex fibers by electrospinning
In a typical experiment, polyacrylonitlile (PAN, Aldrich)was solved in
While preparing polymer solutions, Ti(OC3H7)4 was mixed with a DMF solution at a ratio of four to one to prepare a 20 ml TiO2 sol-gel precursor solution containing a
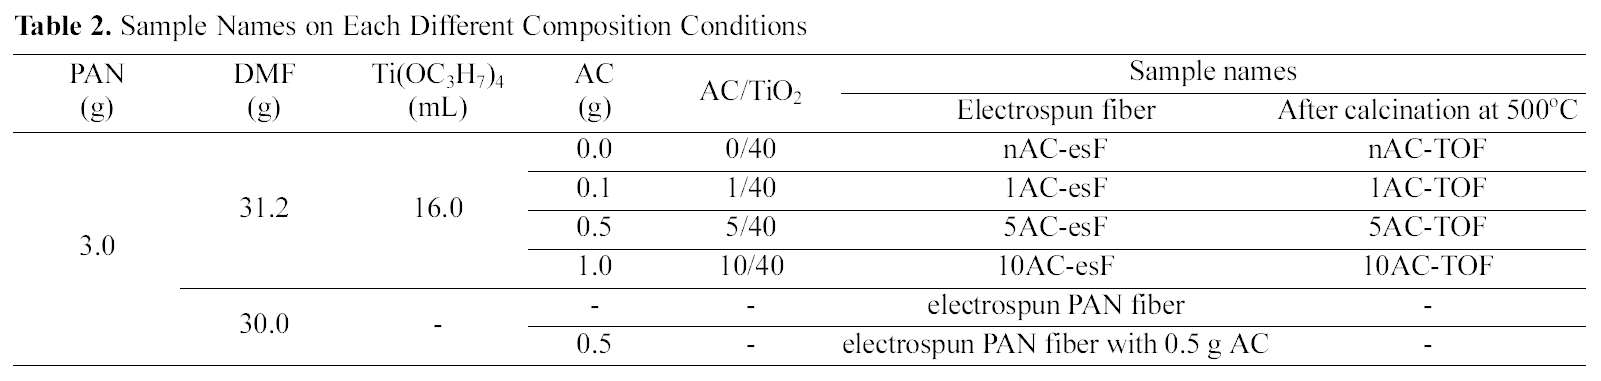
[Table 2.] Sample Names on Each Different Composition Conditions
Sample Names on Each Different Composition Conditions
corresponding volume of HCl. After the PAN was dissolved completely into the DMF, TiO2 precursor solution was dripped slowly into the PAN solution and subsequently the incorporated solution was stirred further for 1 h before electrospinning. The incorporated solution was then transferred into a syringe. The syringe needle was connected to a high-voltage supply that is capable of generating DC voltages up to 30 kV. At room temperature and in air a potential of 20 kV was applied for electrospinning. The feed rate of the solution was kept at 3~5 ml h1. After electrospinning, the fibers were heated at a rate of 1oC min-1 up to 350oC or 500oC in air and the temperature was maintained for 4 h. In conclusion, TiO2-AC complex fibers prepared have AC/TiO2 ratios of 0/40, 1/40, 5/40, and 10/40,depending on the amount of AC added. The names of prepared samples are shown in Table 2.
2.2. Characterization of TiO2-AC complex fibers
The morphologies of TiO2-AC complex fibers were studied with scanning electron microscope (SEM, JSM-6300, JEOL, Japan). Phases and crystal structures of TiO2-AC complex fiber on calcination temperature were investigated with X-ray diffraction (XRD, D/MAX-2200 Ultima/PC, Rigaku, Japan). Thermal properties of as-spun fibers were evaluated by the thermogravimetric analysis(TGA, 2960SDT, TA Instruments, USA) in air from room temperature to 500oC with heating rate of 10oCmin-1 and then maintaining the temperature for 30 min.
2.3. Photocatalytic activity of TiO2-AC complex fibers
In order to investigate the photocatalytic activity of the TiO2-AC complex fibers, the photodegradation of procion blue dye (PB, Aldrich) in an aqueous solution was used.Natural solar light (average 35600 lx) was used for the activation of photocatalyst. An amount of 0.1 g of photocatalyst was suspended in a 100 mL aqueous solution of 10 ppm PB and mixed well and then, exposed to solar irradiation. The concentration of PB was monitored (lmax of 660 nm) by UV?vis spectrophotometer Mecasys (Optizen 2120 UV, Mecasys, Korea) at regular interval of time.
3.1. The physicochemical properties of the TiO2-AC complex fibers
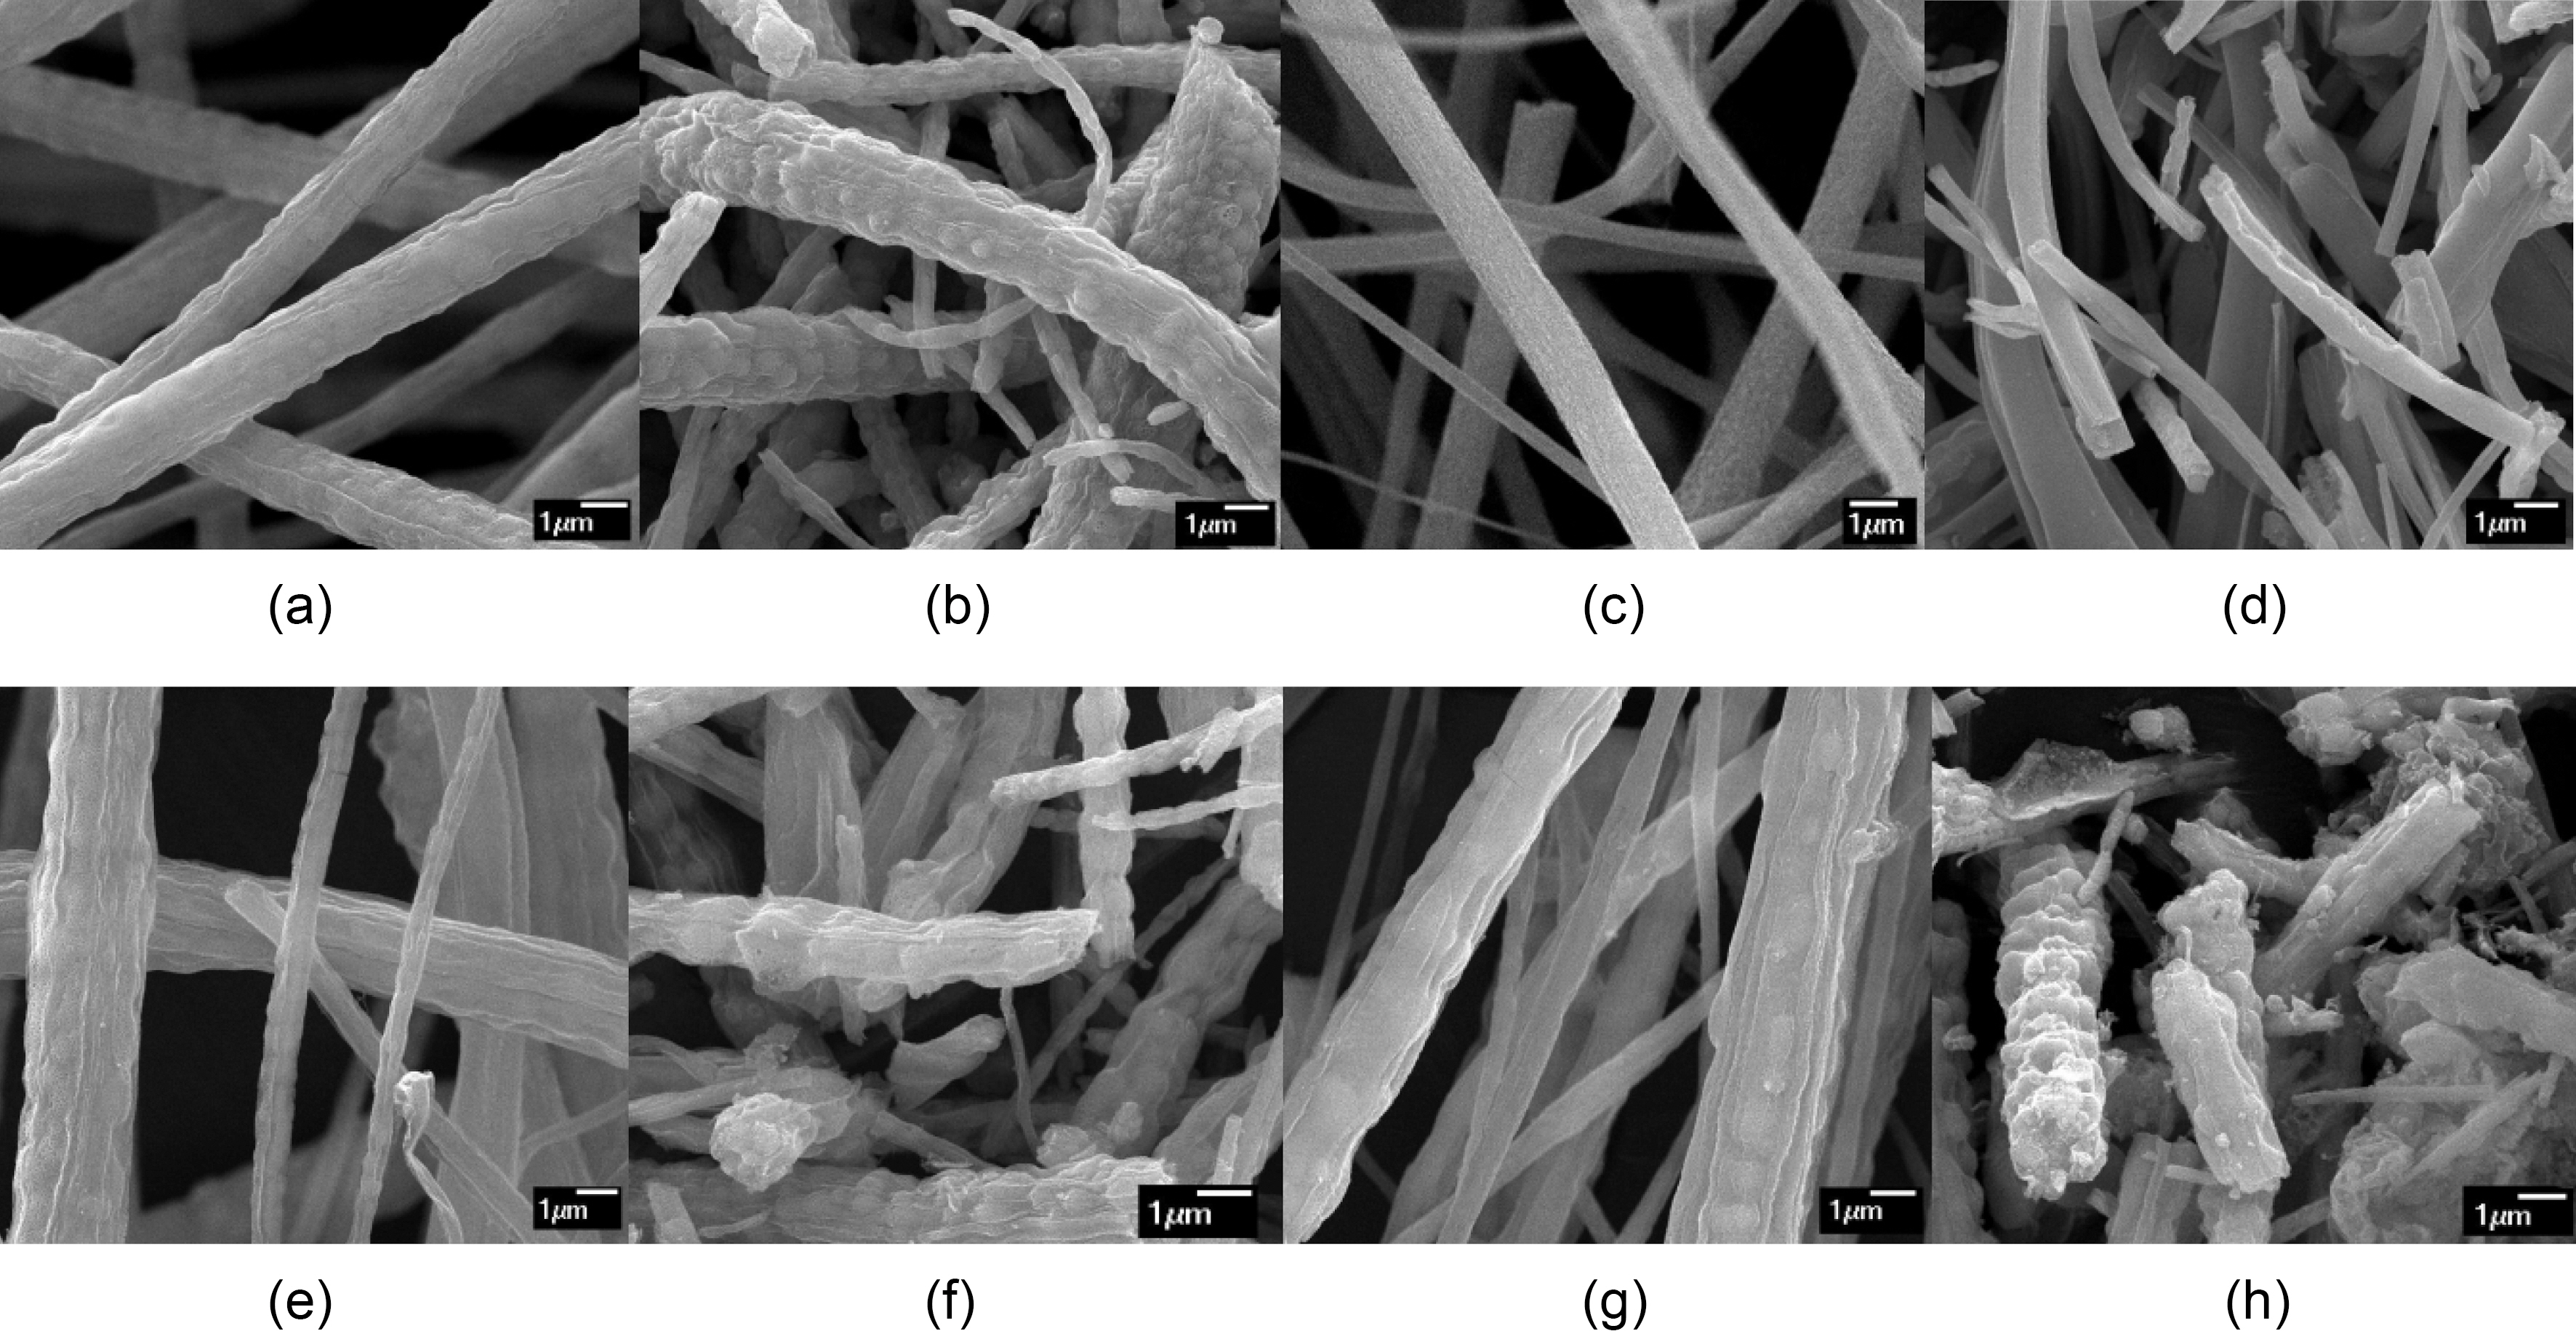
The surface morphology of the TiO2-AC complex fibers has been studied by SEM. The SEM images of as-spun fibers and the calcined ones were shown in Fig. 3. After calcination at 500oC, long as-spun fibers were broken and their average diameter was decreased due to decomposition of PAN. The calcined TiO2 fibers and TiO2-AC complex fibers had also burl like wavy surfaces and sphere shapes inside the fiber. It was expected to be due to crystallization of TiO2 and decomposition of PAN.
In this study, the addition of AC had an impact on fiber thickness and uniformity. The average diameter of these fibers was increased and the uniformity of them was
decreased, the amount of AC added increased, except for 1AC-TOF. In case of 1AC-TOF, the addition of AC helped to increase electric conductivity of electrospinning solution.As activated carbon is a polarizable material [15], addition of AC might be influenced on conductivity of the electrospinning solution. However, in case of the other two TiO2-AC complex fibers, the amount of AC added increased viscosity too much and it affected the uniformity of the complex fibers, even with increased conductivity.
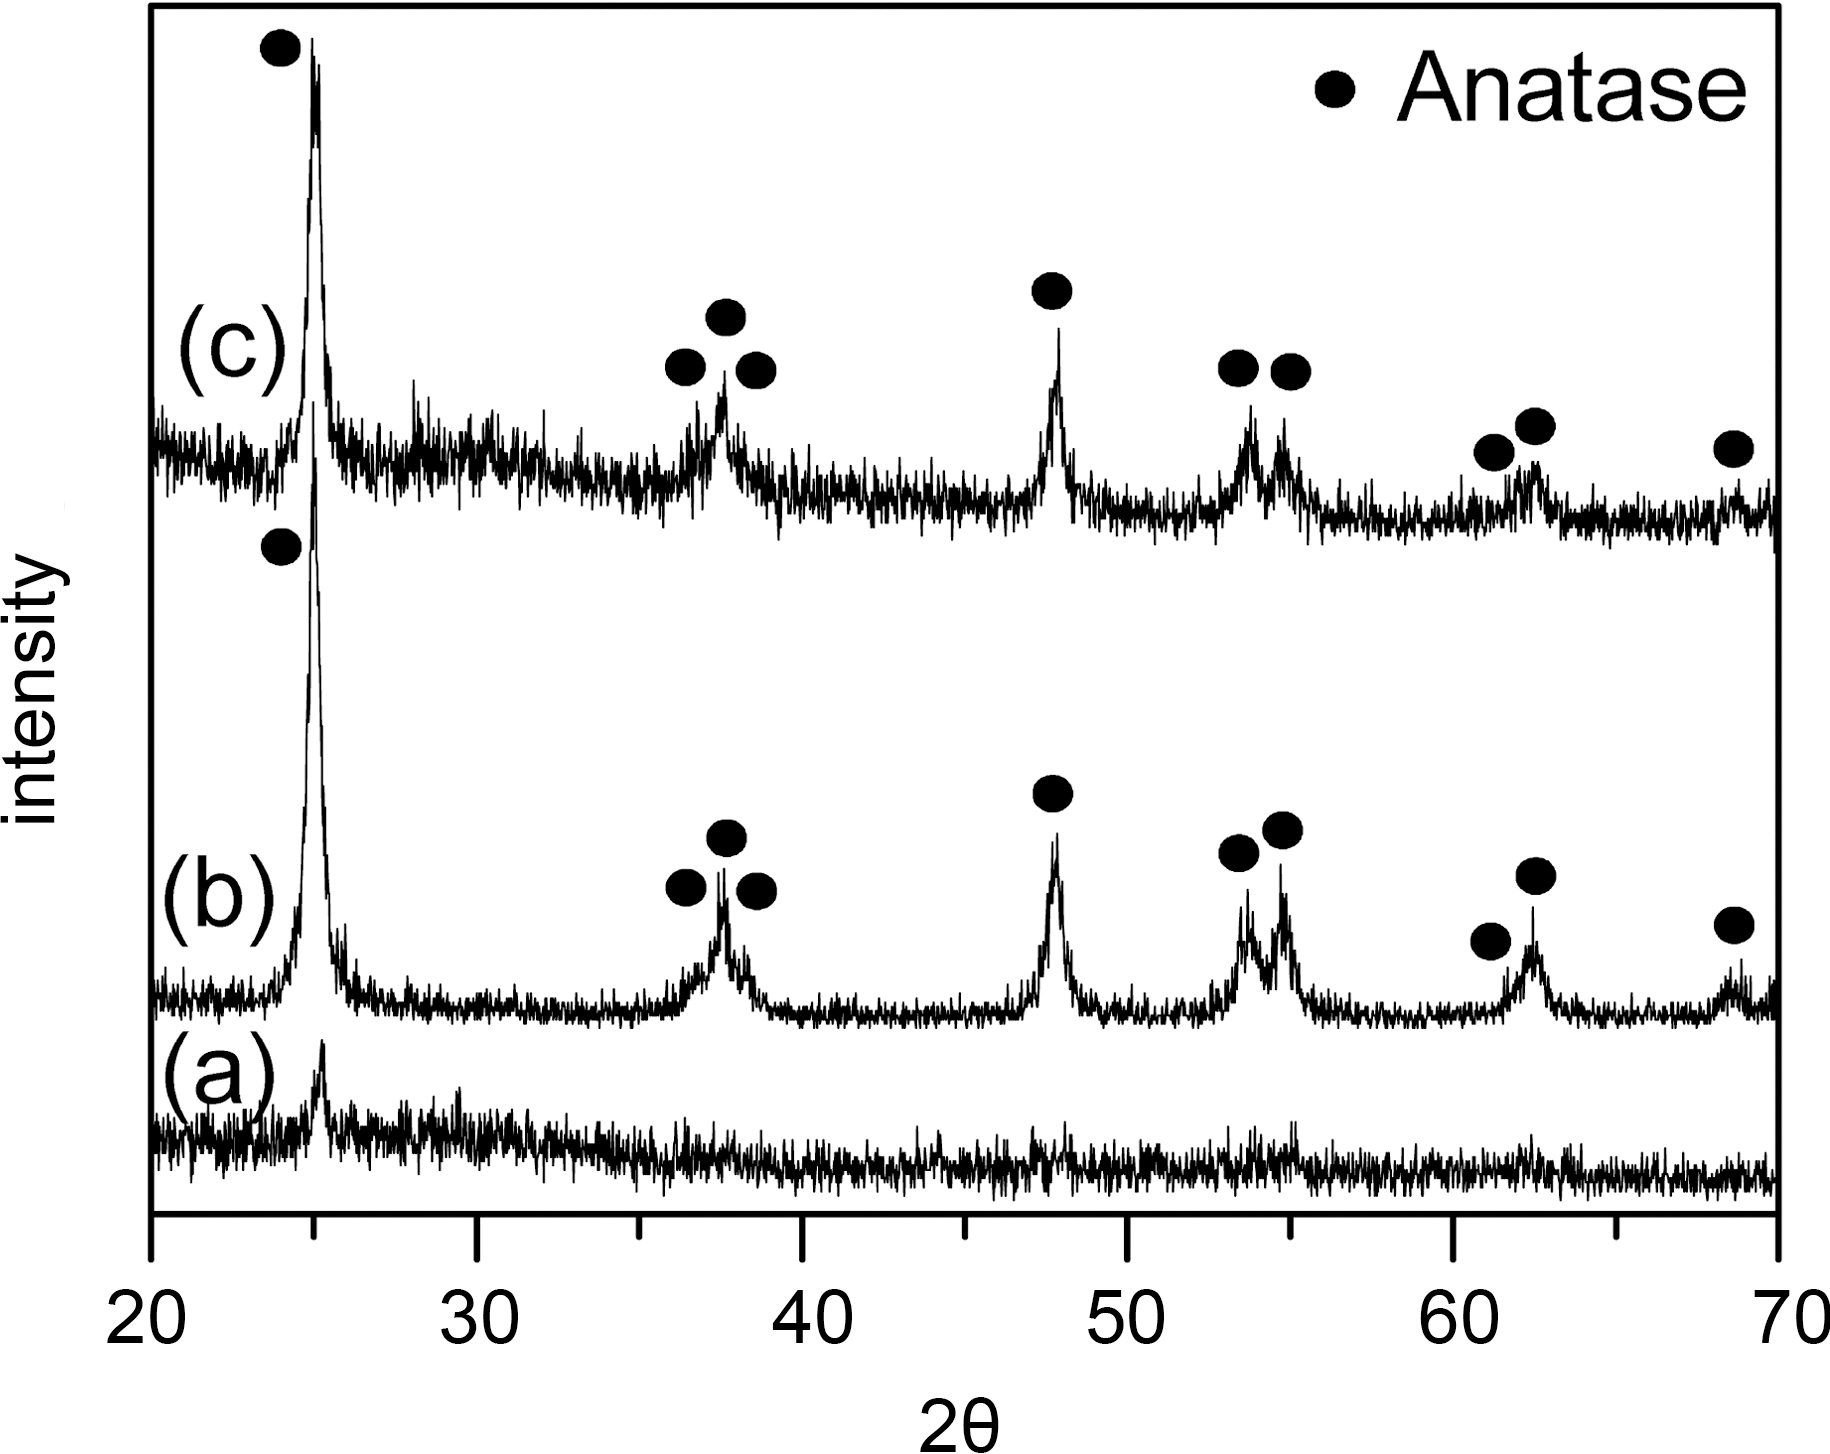
The XRD patterns of prepared TiO2 fibers were shown in Fig. 4. After calcination at 500oC (nAC-TOF and 5AC-TOF,Fig. 4(b) and (c), respectively), amorphous TiO2 of as-spun
fiber was changed to anatase type TiO2 and PAN was removed by pyrolysis. However, calcinated nAC-esF at 350oC (Fig. 4(a)), it was not changed due to low calcination temperature for preparation of crystalline TiO2. The XRD peaks of nAC-TOF and 5AC-TOF at 25.3o, 38.6o, 48.1o,55.1o correspond to anatase (101), (112), (200), (211) crystal planes, respectively [16]. And XRD pattern of 5AC-TOF had small carbon (002) plane peak at 26o due to added AC[17]. The XRD patterns of 1AC-TOF and 10AC-TOF were also similar to 5AC-TOF. In addition, addition of AC does not affect TiO2 crystal structure when comparing nAC-TOF with 5AC-TOF. Hence, XRD patterns of 1AC-TOF and 10AC-TOF were omitted here.
The formation of anatase TiO2 in TiO2-AC complex fibers are expected to work as photocatalyst for degradation of the pollutants and their photodegradation will be discussed in the later sections.
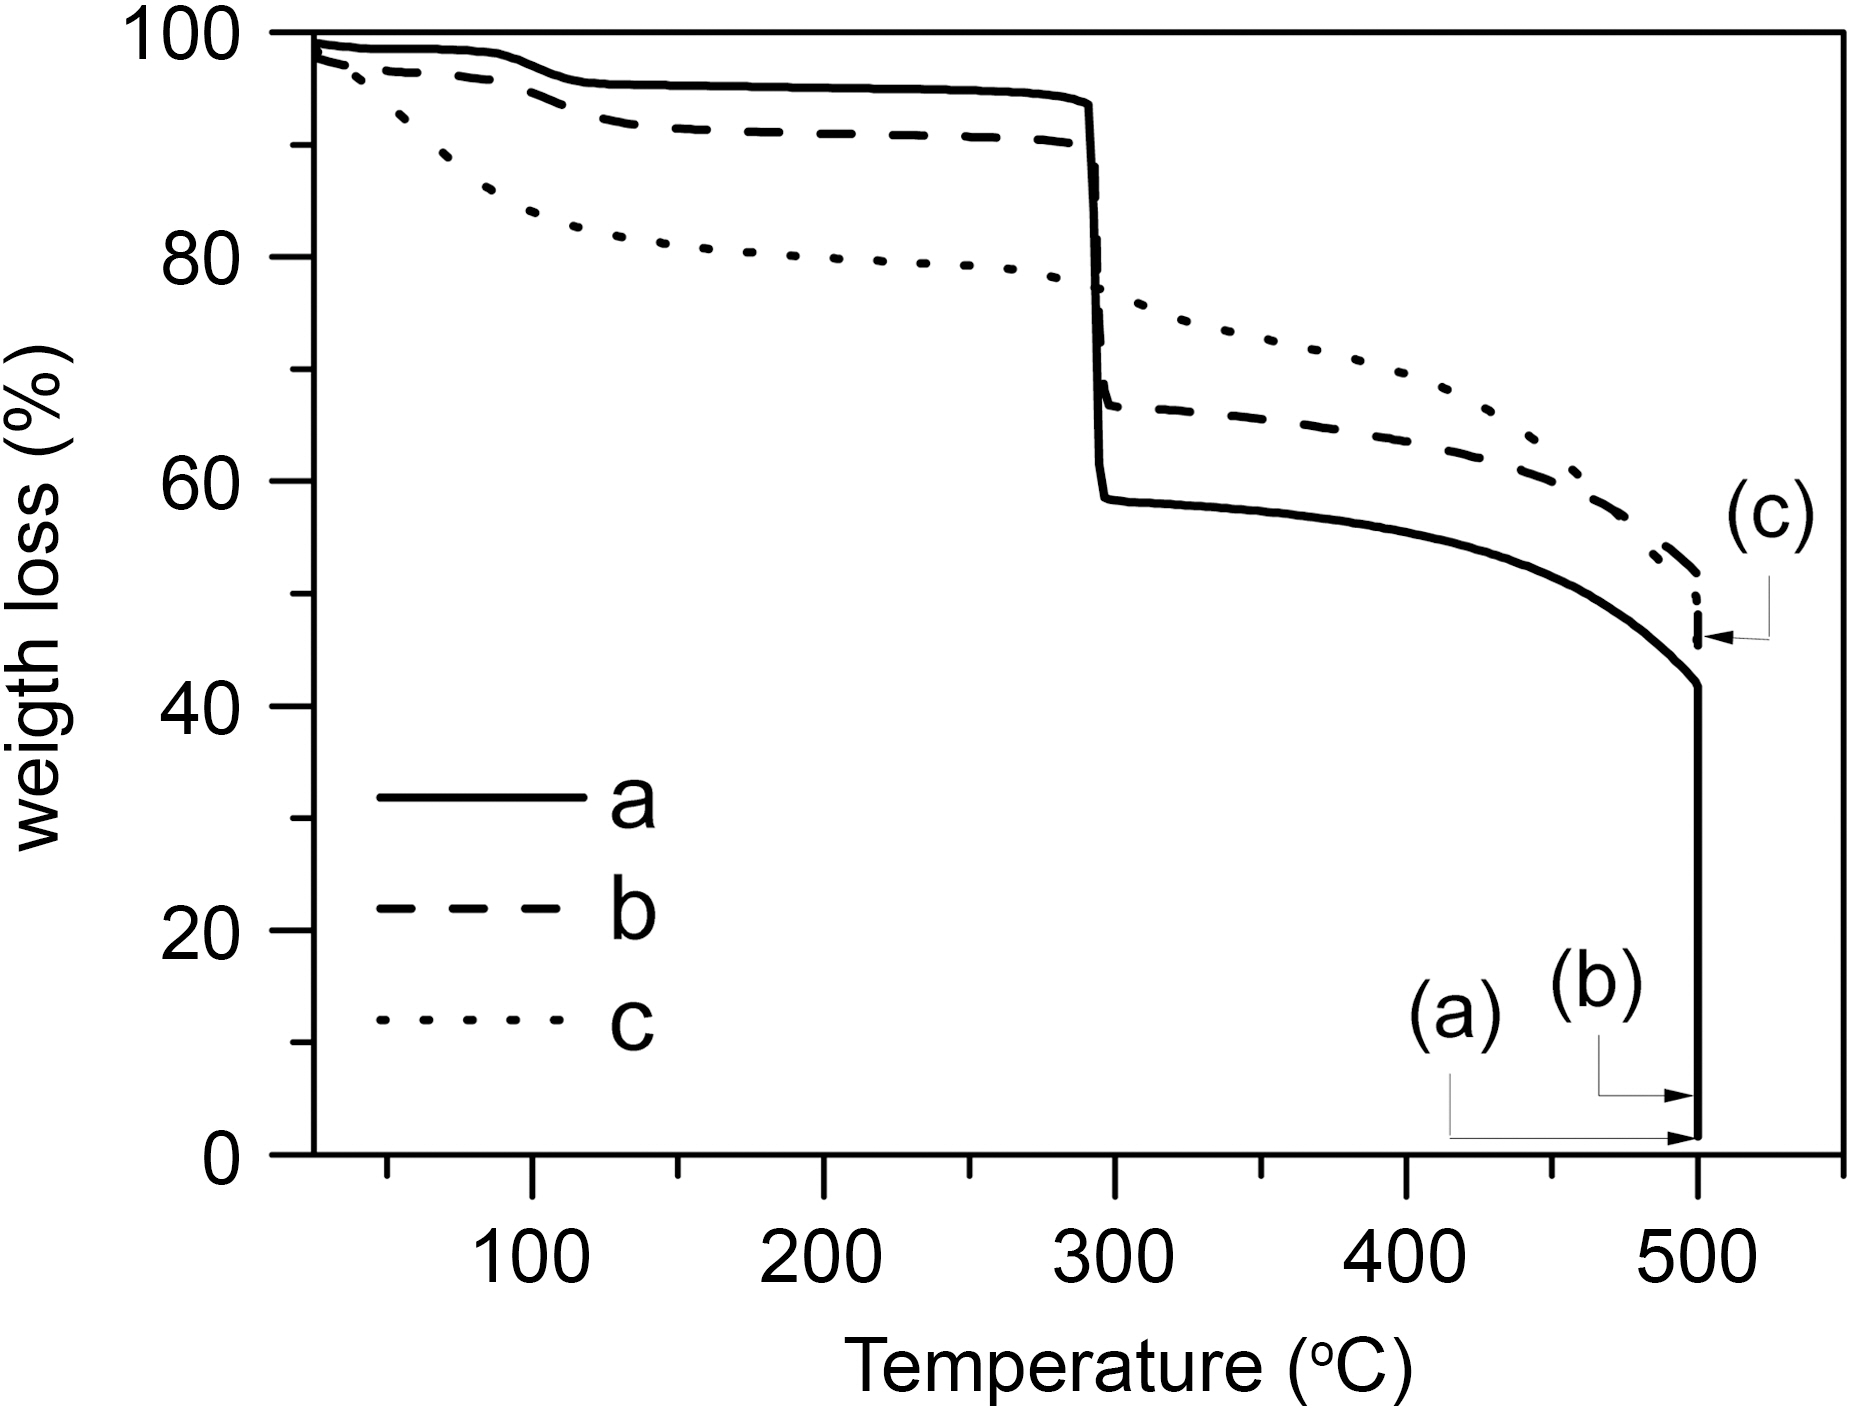
3.2. Thermal analysis of as-spun fibers by electrospining
Thermal stabilities of the electrospun PAN fiber samples were determined by the thermogravimetric analysis (TGA)by recording the thermograms in air atmosphere at the heating rate of 10oCmin-1. The thermal stability of electrospun fiber with titanium isopropoxide was also investigated to compare with these electrospun PAN fibers and was shown together in Fig. 5. In accordance with the different slope of the curve for electrospun PAN fiber, TG curve can be generally divided into three zones, which are called respectively micro weight loss zone (I), dramatic weight loss zone (Ⅱ ) and slow weight loss zone (Ⅲ). The first weight loss zone was observed at around 100oC and associated with the loss of absorbed water molecules. The second weight loss zone was observed at around 298oC and associated with decomposition of PAN. The third major weight loss zone is due to combustion of as-spun PAN fiber by heat and oxygen [18].
These three zones of the TiO2-AC fibers prepared are also shown in the Fig. 5. From the results of Fig. 5(a), the water evaporation of the electrospun PAN fiber mainly occurred in the zone Ⅱ (temperature<298oC) and almost no thermal decomposition of PAN was taken place. Due to inner molecular cyclizing, inter-molecular cross-linking, oxidation and dehydrogenation reaction going on, small molecule gases would release and volatilize from fibers in zone Ⅱ, the weight of electrospun PAN fiber lost dramatically. The weight loss speed of that in zone Ⅲ (temperature>298oC)was slower than that in zone Ⅱ, because only oxygenolysis happened in this zone.
In the case of electrospun fiber with 0.5 g AC (Fig. 5(b)),the trend of thermal stability is nearly similar to that of electrospun fiber. The weight loss in the zone I is somewhat larger than that of electrospun fiber due to the evaporation of water embedded in AC. On the other hand, the weight loss in the zone III is a little bit smaller than that of electrospun fiber, which is believed to be related to the AC onto the PAN fiber.
It can be also seen in Fig. 5 that as-spun nAC-esF sample,which is the one prior to the calcination without AC is decomposed slowly according to elevated temperature in air atmosphere. This is probably attributed to the decomposition of other compounds in this sample such as organic matters of titanium isopropoxide and residual of solvent into as-spun fiber.
3.3. PB dye removal property and kinetic analysis of TiO2-AC complex fibers
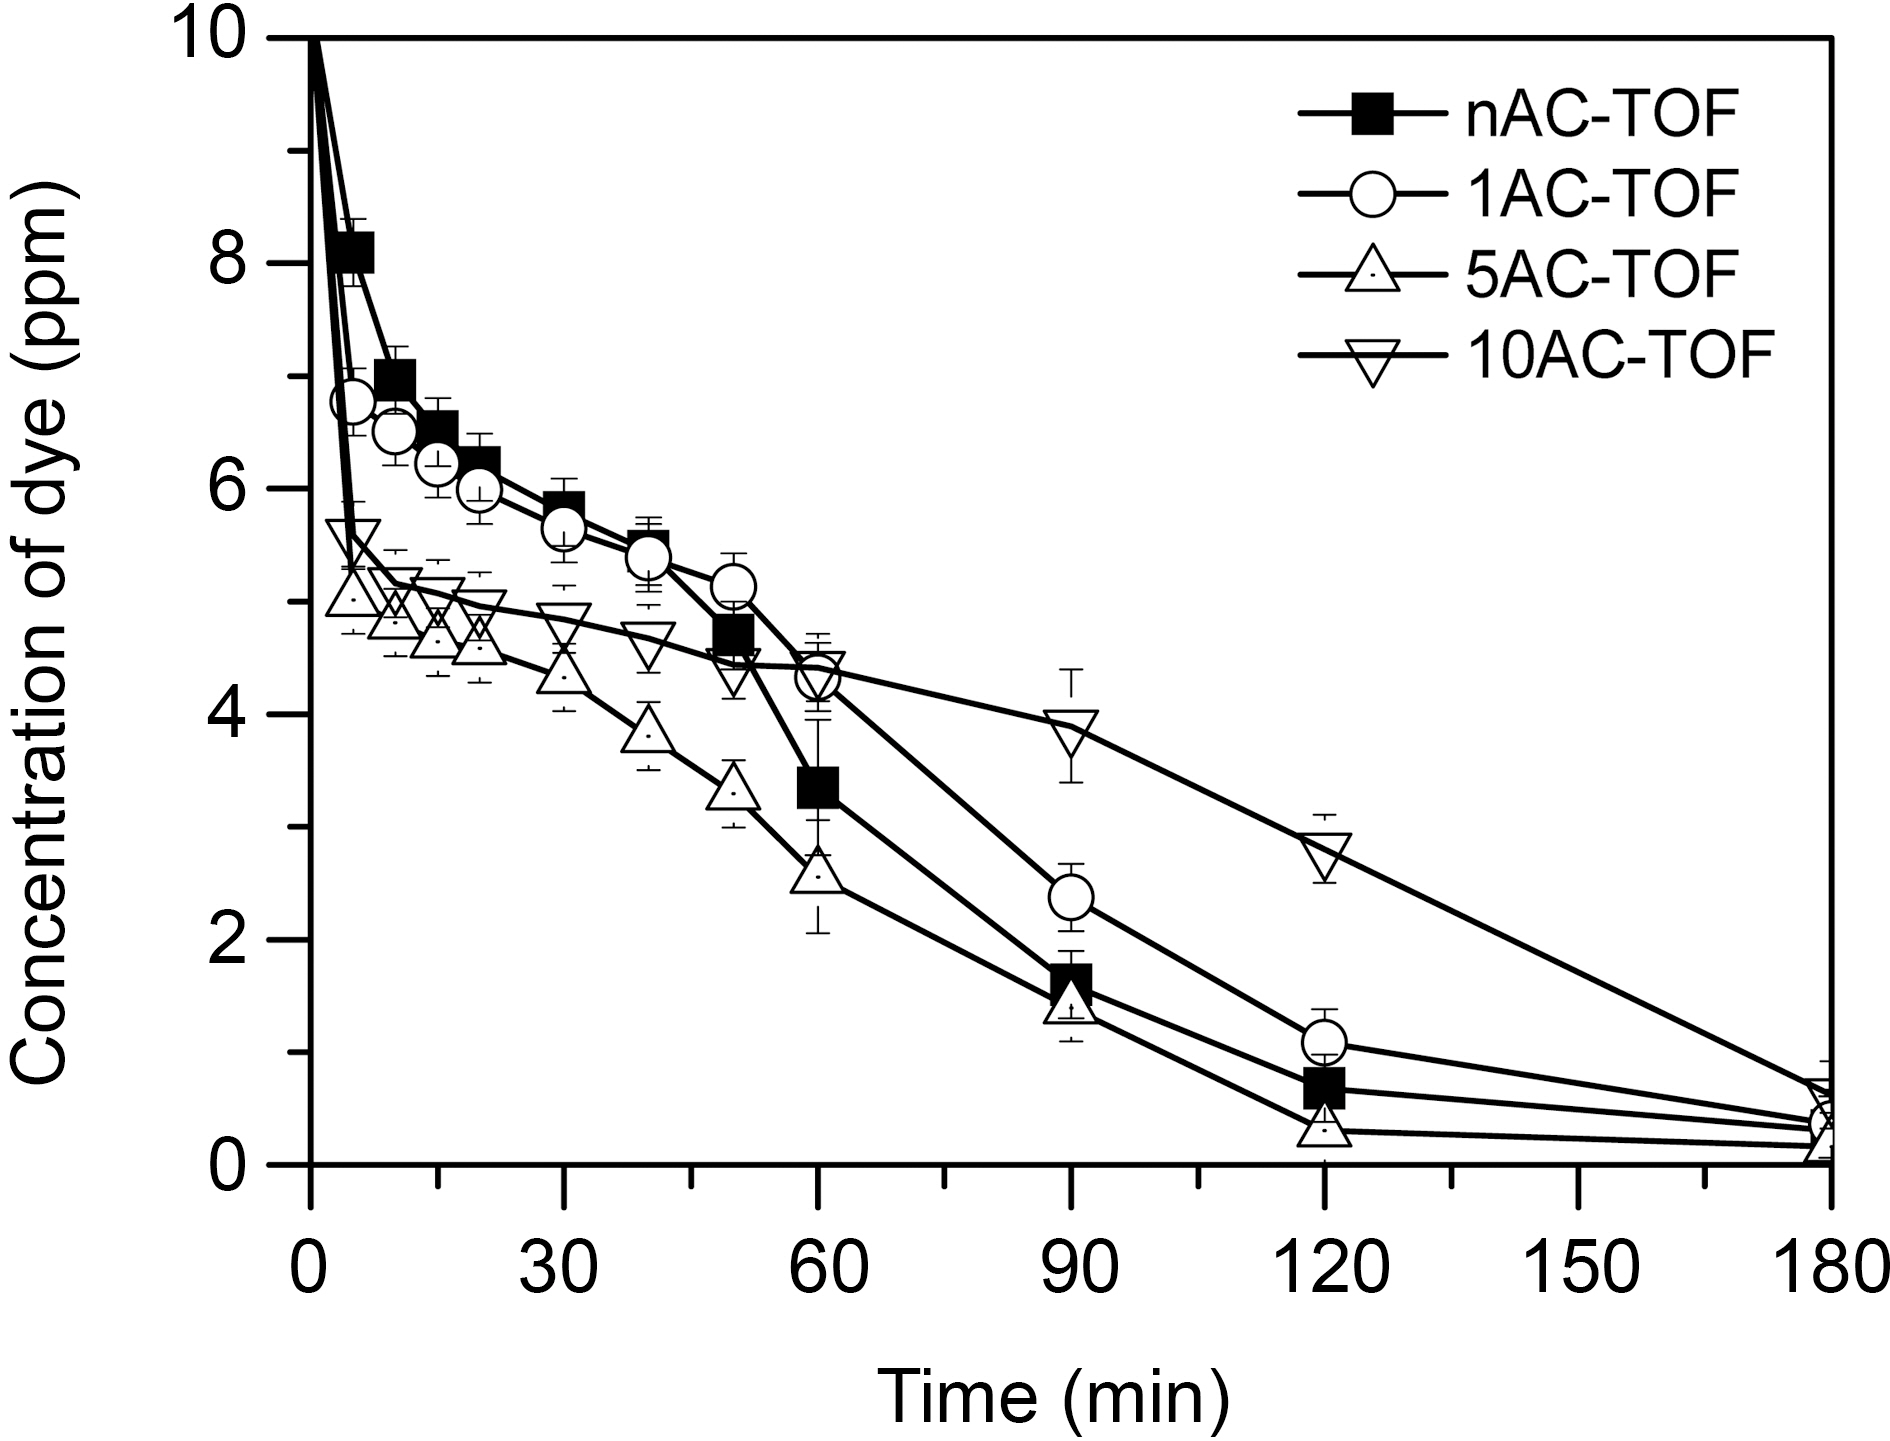
The efficiency of the PB dye removal using TiO2-AC complex fibers was examined with solar light and the results was shown at Fig. 6. Generally, photo-catalytic degradation of TiO2 for organic materials is wrought under UV irradiation because of the relatively wide electronic band gap(3.2 eV) of TiO2 [19]. However, PB dye could be degraded by prepared electrospun TiO2 fiber (nAC-TOF) and TiO2-AC complex fibers in spite of solar light irradiation. More studies to reveal its reason need to be done.
In Fig. 6, the prepared samples has good dye removal property of 94~99% after 180 min. 5AC-TOF had best dye removal efficiency of 99% but 10AC-TOF had lowest dye removal efficiency of 94%. From these results, AC/TiO2 ratio of 5AC-TOF was optimum condition to remove PB dye for synergetic effect of adsorption and photodegradation. In case of nAC-TOF, the PB dye was removed by photodegradation. TiO2-AC complex fiber samples, as distinct from nAC-TOF, PB dye was rapidly removed during the initial 5 minutes due to PB dye adsorption effect of AC.And then, the photodegradation of the PB dye was examined after 5 minutes. The adsorption effect was generally
increased with increasing of AC amount in TiO2 fibers.However, although 10AC-TOF had more AC than 5ACTOF,the adsorption of PB dyes was almost similar at initial 5 minutes.
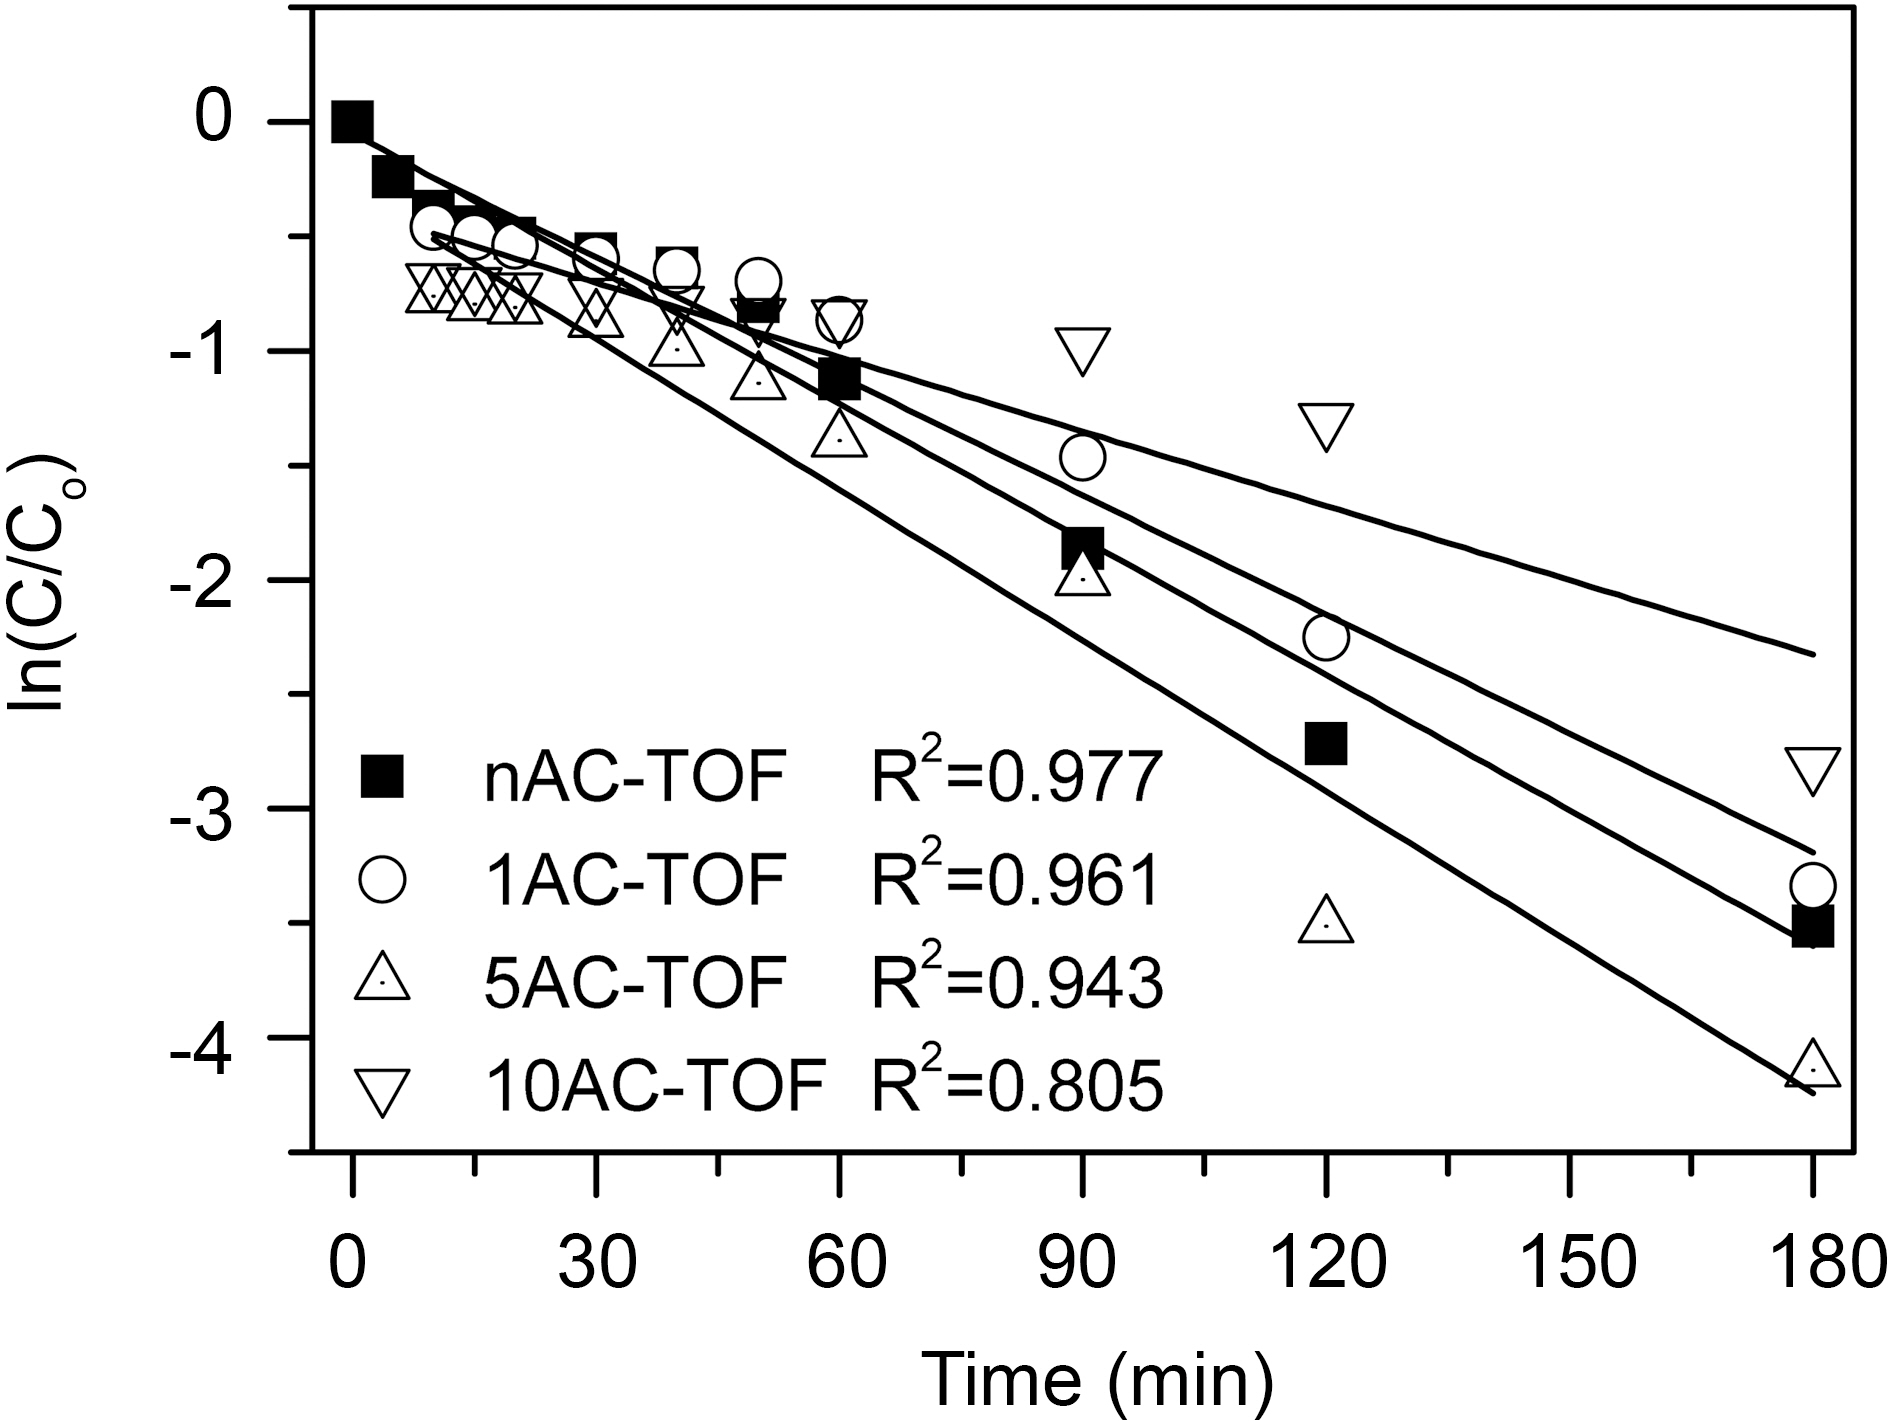
In case of TiO2-AC complex fiber samples, the kinetics of photodegradation of the PB dye was enacted the dye removal after 5 minutes. The photodegradation of the PB dye irradiated by solar light followed pseudo first order kinetics (Fig. 7) as per the following equations [20]:

where
In this study, electrospun TiO2-AC complex fibers were prepared for synergetic effect with adsorption and degradation of pollutant. The addition of AC had an impact on fiber thickness. The average diameter of fibers was increased with increasing the amount of AC added, except for 1AC-TOF. The addition of appropriate amount of AC helped to increase electric conductivity of electrospinning solution and decrease average diameter and increase uniformity of fibers. After calcination at 500oC, as-spun fibers were broken and their average diameters were slightly decreased. The resultant fibers after calcination had rough and burl like wavy surfaces. And as-spun fibers contained TiO2 anatase after calcination at 500oC. The prepared TiO2-AC complex fibers could remove procian blue dyes by solar light irradiation with high removal property of 94~99%.TiO2-AC complex fiber samples, PB dye was rapidly removed during the initial 5 minutes by adsorption and 5ACTOF and 10AC-TOF showed the best adsorption with similar adsorption. But after 5 minutes, dye removal of 5ACTOF was better than that of 10AC-TOF, suggesting that the amount of AC added in 10AC-TOF was too much, reducing the contact between TiO2 and PB dye and decreasing the photocatalytic activity of the complex fiber. Therefore, in this study, the most efficient AC/TiO2 ratio of TiO2-AC complex fibers was 5/40, showing the synergetic effect of adsorption and photodegradation. It is expected that the TiO2-AC complex fibers can be used as removal of organic pollutants in water system.