The presence of heavy metals in water systems is a serious environmental problem due to their toxic, cumulative and nonbiodegradable characteristics. Lead (Pb) is considered one of the most toxic heavy metals, which has been increasingly introduced into water bodies. According to the Ministry of Environment in Korea, the permissible limit for Pb in drinking water is 0.05 mg/L [1]. Human exposure to Pb from different sources, such as storage batteries, lead manufacturing, tire wear and mining, causes several illnesses, and unlike most organic pollutants, it is generally refractory and difficult to biologically detoxify [2]. Various treatment processes, such as chemical precipitation, ultra-filtration and electrochemical deposition, have been developed for the removal of heavy metals [3]. However, the application of such methods is limited due to technical or economical constraints, which has lead to the search for cheaper and more easily obtainable materials for adsorption of heavy metals. Numerous studies have assessed the use of recycled materials, such as sawdust [2], rice hull [4], coconut hull [5], fly ash[6] and maize husk [7], for the effectiveness in the removal of Pb from wastewater.
The rising generation of coal-burning power plants in Korea has resulted in increased disposal of the associated by-products,such as boiler slag, fly ash and bottom ash. These coal-fired power plants have generated about 5 million tons of coal bottom ash [8]. This huge amount of ash requires large areas for its disposal, which may eventually become a source of pollution. Therefore, alternates for the utilization of these by-products have to be developed. Bottom ash, which accounts for 5-15% of the by-products produced during coal power generation, has already been used as structural fill, and construction and road base materials. Recently, there has been growing interest in the utilization of bottom ash as a sorbent for various pollutants, especially in water. Several studies have investigated the possible utilization of bottom ash as an adsorbent for the removal of various heavy metals from wastewater [9-11]. The particle size, inherent large surface area and high porosity of bottom ash make it a good choice for use as a low-cost adsorbent. However, appropriate assessments of the material to evaluate its toxicity and the possibility of its recycling and reuse have to be performed.
The objective of this research was to determine the suitability of bottom ash to be used as an alternative medium for the removal of heavy metals in wastewater. In this study, the physical, chemical and mineralogical compositions of bottom ash were analyzed. Moreover, the total heavy metal content was examined and the leaching characteristics of bottom ash were investigated to evaluate the capability of this material to release toxic heavy metals exceeding the Korean regulatory limits. Batch adsorption experiments were performed to assess the potential of bottom ash for the adsorption of Pb. Hereafter, the kinetic and equilibrium constants of adsorption were established and modeled.
The bottom ash samples were obtained from a coal incinerator in Korea. It has a combination of various sizes depending on the incineration process. Representative weighted samples were sieved, with the samples grouped as follows: <1.19 mm, 1.19-2.00 mm and 2.00-4.75 mm size ranges for the analysis of its physical, chemical, leaching and adsorption characteristics. The pH, loss on ignition (LOI) and organic matter content of the samples were determined. The specific surface area of the bottom ash samples were measured using an ASAP 2000 analyzer (Edwards High Vacuum International, Crawley, W.Sussex, UK) with N2 adsorption.
2.2. Elemental and Morphological Analysis
The scanning electron microscopy-energy dispersive spectroscope (SEM-EDS) was used to determine the elemental and morphological compositions of the bottom ash samples. The SEM-EDS was operated at an accelerating voltage of 30 keV for the mineral analyses of representative samples in order to provide information on the physical properties of the material. The EDS detector is able to detect elements with atomic number equal to or greater than six.
The bottom ash samples, in powder form, were analyzed using an X-ray diffractometer (XRD) for the qualitative evaluation of the common and predominant phases within the ash. The diffractometer was operated at 40 kV and 40 mA, over the range of 2θ from 0° to 70°, with a detector speed of 1°/min. The unknown substances were identified by comparing the patterns of their diffraction data against a database archived in the Powder Diffraction File of the International Center for Diffraction Data.
2.4. Total Content and Leaching Test
To determine the total heavy metal content of the samples,1.0 g of bottom ash was digested using a microwave oven with Nitric/Hydrochloric acid solution, and analyzed using inductively coupled plasma atomic emission spectroscopy (ICP-AES). The leachability of the heavy metals from the bottom ash was assessed according to the Korea standard leaching test (KSLT). Fifty grams of bottom ash samples were mixed with an extraction fluid (W:V ratio=1:10) composed of 500 mL distilled water and HCl (pH=5.8?6.3). The samples were vigorously shaken (185 rpm) in a water bath shaker at a constant temperature of 20℃ for 6.5 hrs. The leachate was vacuum filtered through a 1.0-㎛ filter paper, and the concentrations of Pb, Copper (Cu), Arsenic(As), Chromium (Cr) and Cadmium (Cd) in the supernatant liquid were then analyzed using ICP-AES.
Batch adsorption experiments were carried out by using 100 g of bottom ash for kinetic adsorption, and 10, 20, 50 and 100 g of bottom ash for equilibrium adsorption, in 500 mL of solution,containing 10 mg/L of Pb. The mixtures were shaken (100 rpm) in a water bath shaker at a constant temperature of 20°C. Small samples of the solution (20.0 mL) were taken out at predetermined time intervals to measure the evolution of the adsorbate concentration. The samples were filtered through a 0.45-㎛ membrane, and the residual metal concentrations of supernatant liquid were determined using ICP-AES.
The physical properties of coal bottom ash vary depending on the type, source and fineness of the parent fuel, as well as the operating conditions of the power plant [12]. Table 1 shows the physical properties of the bottom ash grouped by particle size range. It was apparent that pH, LOI and surface area increased with decreasing particle size. The pH of the bottom ash, when mixed with water (initial pH=7.0), changes to 6.8-7.9. High pH is the major factor controlling the eventual metal leaching of the material. The pH has an impact on the adsorption sites, as these are known to be pH dependent. As pH increases, the electrostatic attraction of the adsorbent for metals is enhanced. Of the three groups, <1.19 mm had the highest surface area. Since finer particles have a greater specific surface area, this will provide an increased effective contact area for the adsorbent and the adsorbate.
3.2. Chemical and Mineralogical Properties
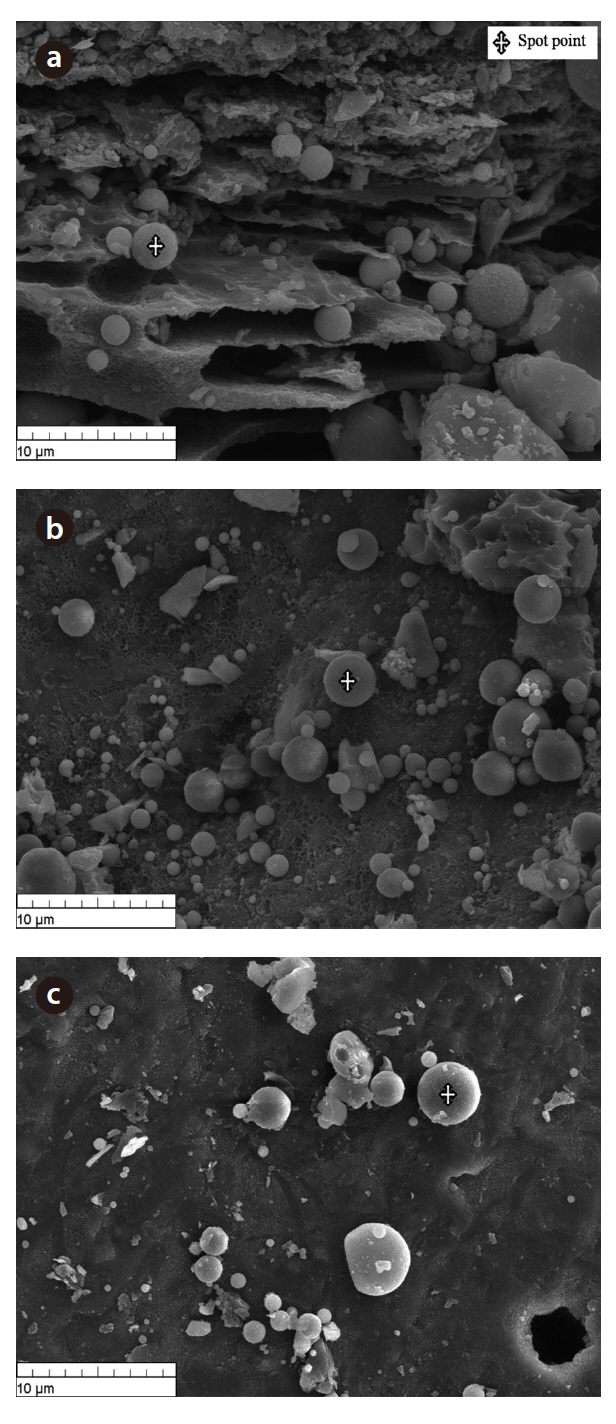
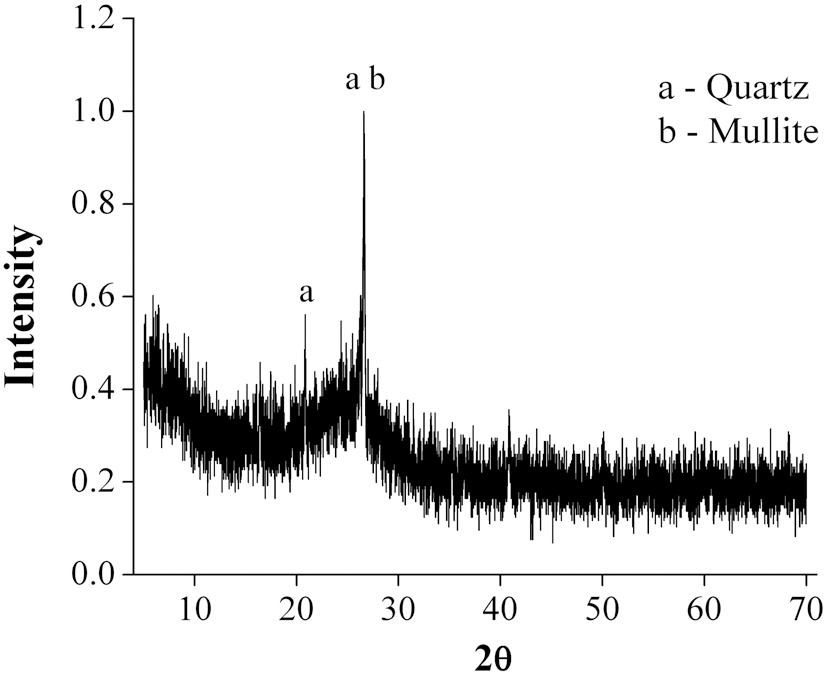
The morphology of the bottom ash samples was affected by the combustion temperature and cooling rate during the incineration process. Fig. 1 shows the SEM photographs taken at 10-㎛ magnification. At this range, hollow cenospheres were detected along the surface of the bottom ash samples. The marking points in the figures represent the spot points during the EDS analyses. The results (Table 2) show that the predominant elements in the bottom ash samples were oxygen (O), silicon (Si), aluminum (Al) and carbon (C). The diffractogram in Fig. 2 shows the XRD pattern of the bottom ash samples. It was found that the material was amorphous in nature, as indicated by the presence
[Table 1.] Physical characteristics of bottom ash
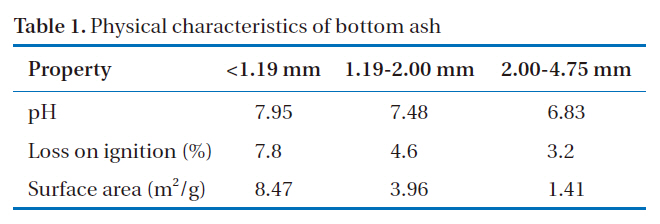
Physical characteristics of bottom ash
of quartz (SiO2) and mullite (Al6Si2O13). Significant amounts of silicon and aluminum were found in the bottom ash samples, which were similar to those found in other materials, such as zeolites, which are known to be good adsorbents for the removal of heavy metals.
3.3. Heavy Metal Content and Leaching Characteristics
A good adsorbent material is considered safe and efficient when it can effectively remove heavy metals, without releasing potentially hazardous substances. The highest attention is paid towards the soluble heavy metals that may migrate into soil and groundwater. The total and leaching concentrations of heavy metals in the bottom ash are shown in Table 3. The results show that the total concentrations of heavy metals in bottom ash were in the order: As > Cr > Pb > Cu > Cd. Bottom ash contains relatively small amounts of heavy metals, particularly volatile metals, such as Cd and Pb [10]. As shown in Table 3, arsenic constituted the largest proportion of the heavy metals present in the bottom ash. United States Geological Survey (USGS) studies indicate that, during coal combustion in modern coal-fired utilities, 90?100% of the arsenic is captured in coal combustion byproducts, which are incorporated into the silicate minerals constituting the bulk of the solid ash [13].
The results from the leaching test showed heavy metal concentrations from the three particle size groups of less than 0.3 mg/L, passing the Korean regulatory limit. The regulatory limit for Pb and Cd is 3.0 mg/L, 1.5 mg/L for As and Cr, and 0.3 mg/L for Cd. The amounts of heavy metals leached from the bottom ash were in the following order: As > Cu > Pb > Cr > Cd. It was also observed that the amounts of Pb, Cr, Cu and As leached from the bottom ash increased with decreasing particle size.
[Table 2.] Elemental composition of bottom ash (%)
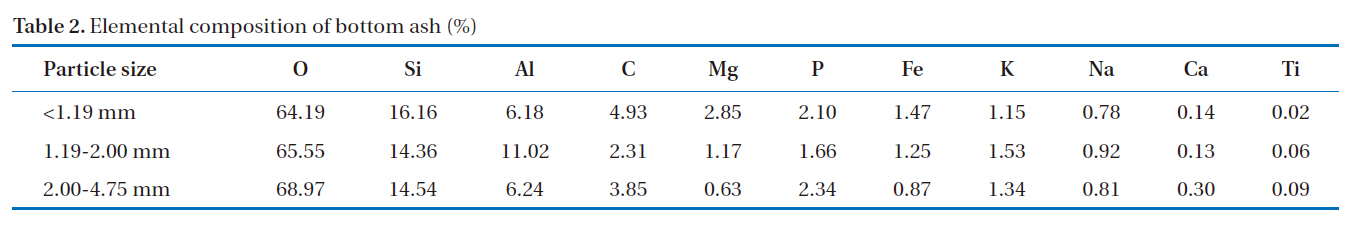
Elemental composition of bottom ash (%)
[Table 3.] Content and leaching concentration of heavy metals in bottom ash
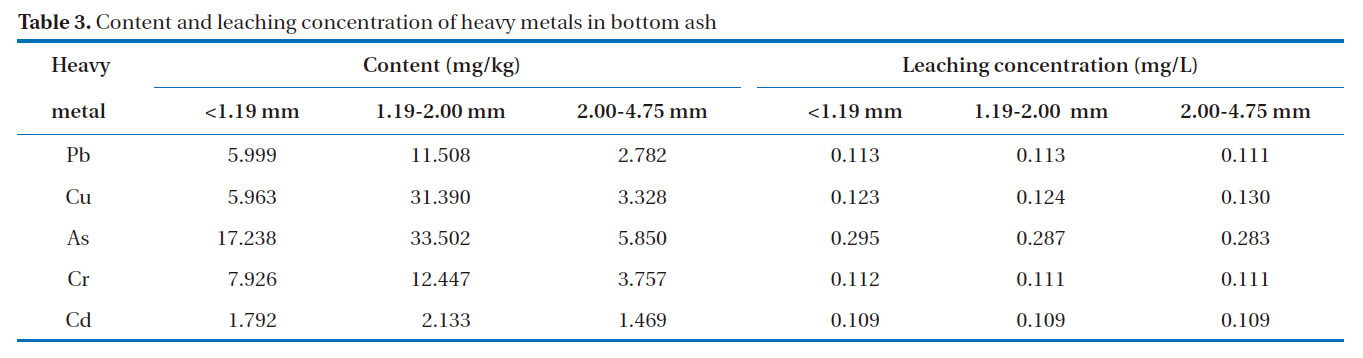
Content and leaching concentration of heavy metals in bottom ash
3.4. Adsorption Characteristics
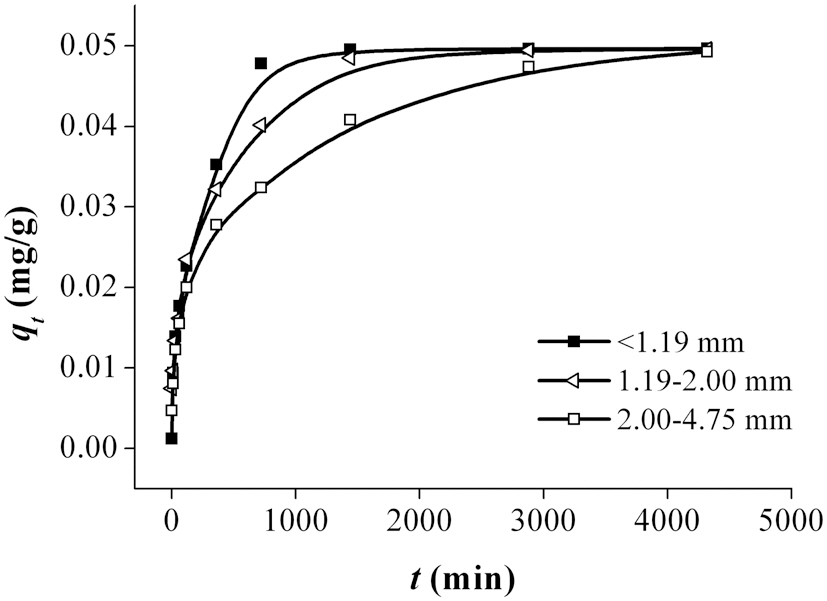
The results obtained from the time-dependent experiments for the removal of Pb using bottom ash are shown in Fig. 3. The trend shows that the amount of metal ions removed increased with increasing contact time. Of the three particle size ranges, <1.19 mm demonstrated the highest and fastest adsorption of Pb. As shown in Fig. 3, the absorption capacity for Pb increased with decreasing particle size of the bottom ash. Since adsorption is a surface phenomenon, the higher adsorption rate was attributed to the great accessibility to pores and the larger surface area. The adsorption of Pb attained equilibrium between 1000 and 4500 min of contact time.
3.4.1. Kinetic Models
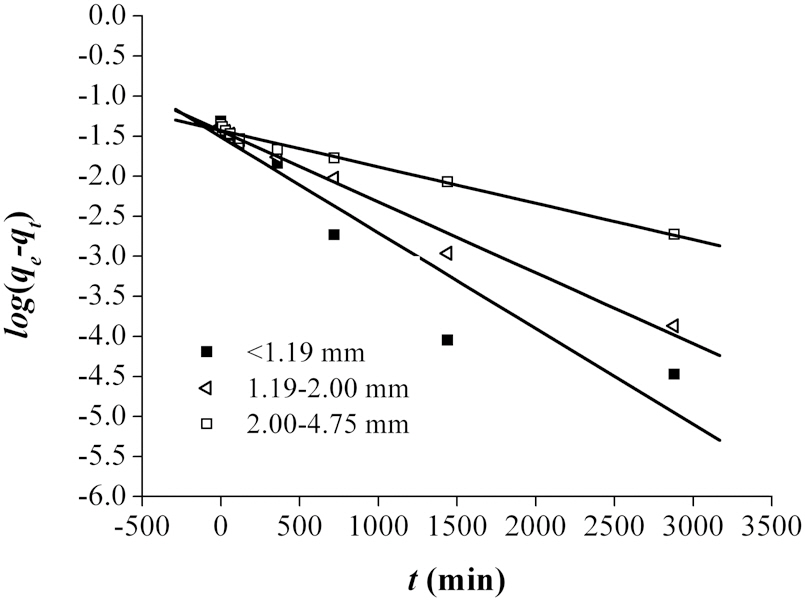
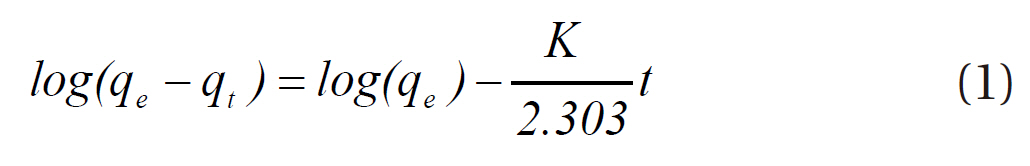
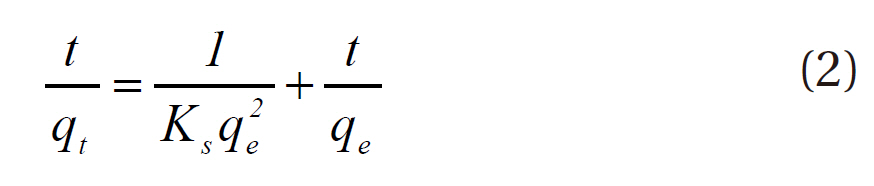
To further explain the adsorption mechanism, kinetic models, such as the pseudo-first and pseudo-second-order models, as well as the Elovich equation were tested to fit the experimental data obtained from the Pb removal experiments. These equations were linearized, and the coefficient of regression (R2) was used to determine the adequateness of the different models to fit the adsorption process. Assuming first order kinetics, the Lagergren Eq. (1) was used to determine the pseudo-first order [14].
where
(min),
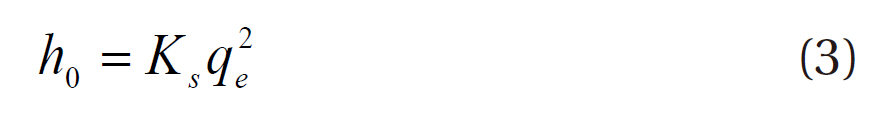
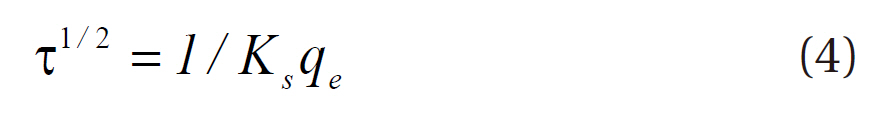
where
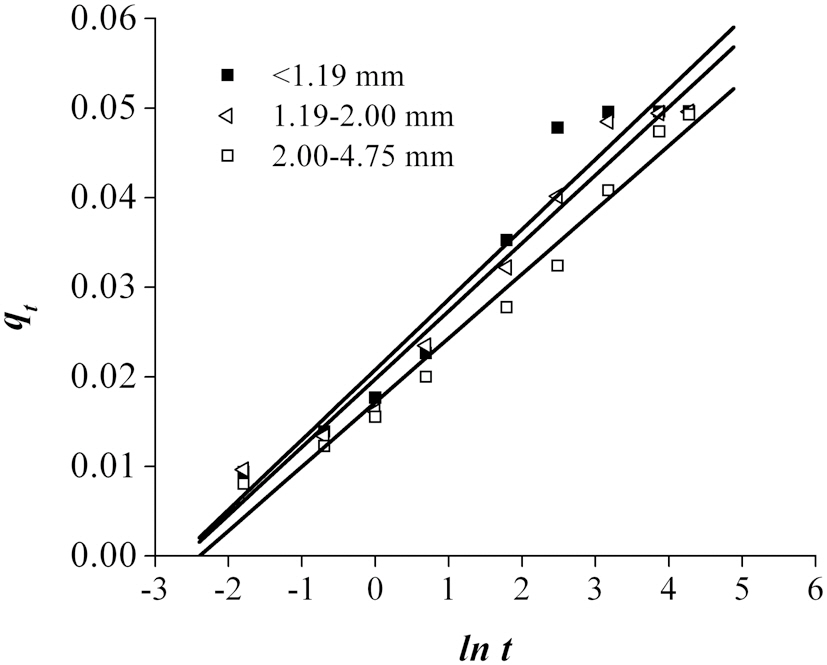
The Elovich model is given by Eq. (5) [16]:
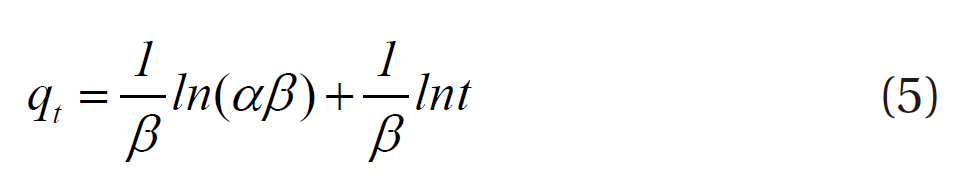
where α and β are the parameters of the Elovich rate equation obtained from the linear regression analysis of the qt = F(t) function.
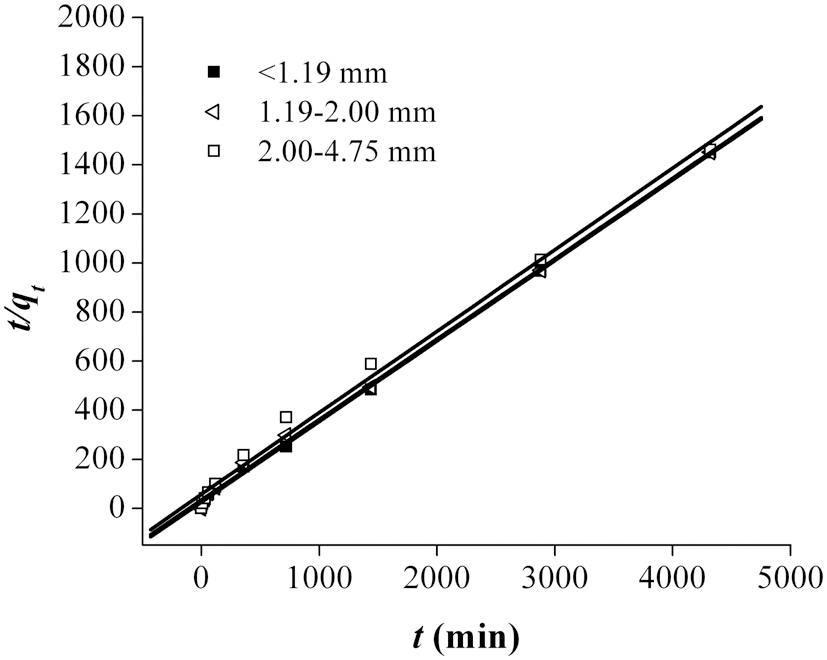
The fitting of the adsorption experimental data to three theoretical models are shown in Figs. 4-6. From the slope and intercept of the straight line of
3.4.2. Equilibrium Isotherm
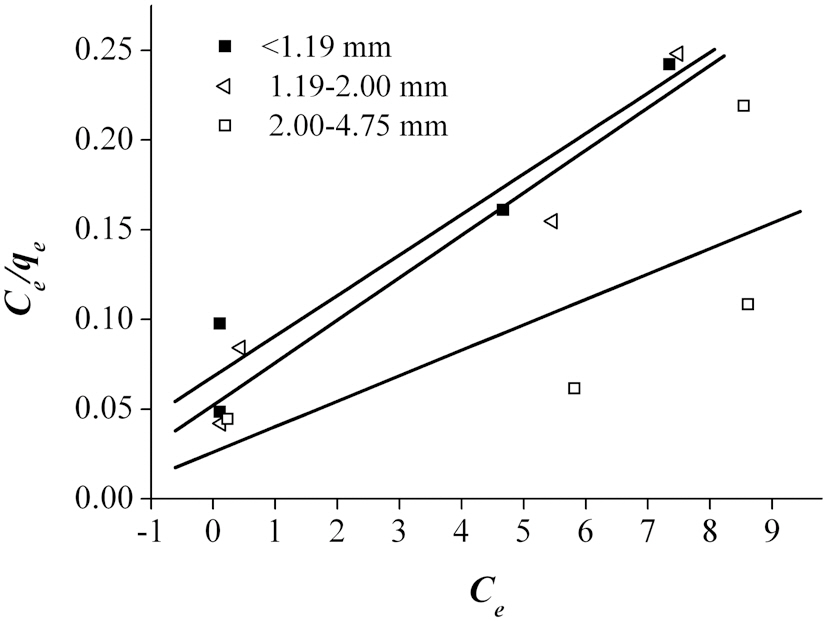
An adsorption isotherm, which is usually the ratio of the quantity adsorbed to that remaining in the solution at a fixed temperature, best describes the equilibrium relationships between the adsorbent and adsorbate. The adsorption data were fitted to three sorption isotherms; namely, the Langmuir, Freun-
[Table 4.] Parameters of the kinetic constants for Pb adsorption
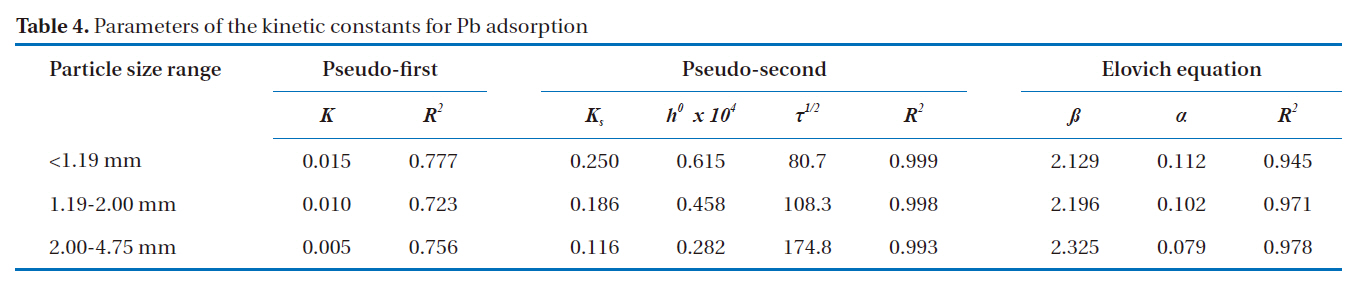
Parameters of the kinetic constants for Pb adsorption
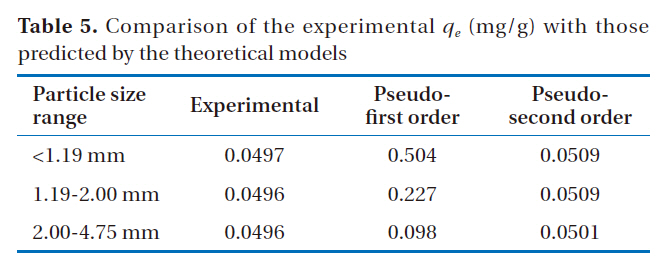
[Table 5.] Comparison of the experimental qe (mg/g) with those predicted by the theoretical models

Comparison of the experimental qe (mg/g) with those predicted by the theoretical models
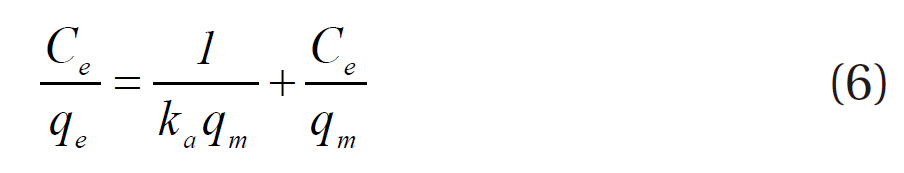
dlich and Dubinin-Radushkevich Isotherms. Langmuir theory is based on the assumption that sorption takes place at homogenous monolayer sites, with no further sorption able to take place at an occupied site. The rearranged linearized Langmuir isotherm is presented as follows Eq. (6) [4]:
where
where
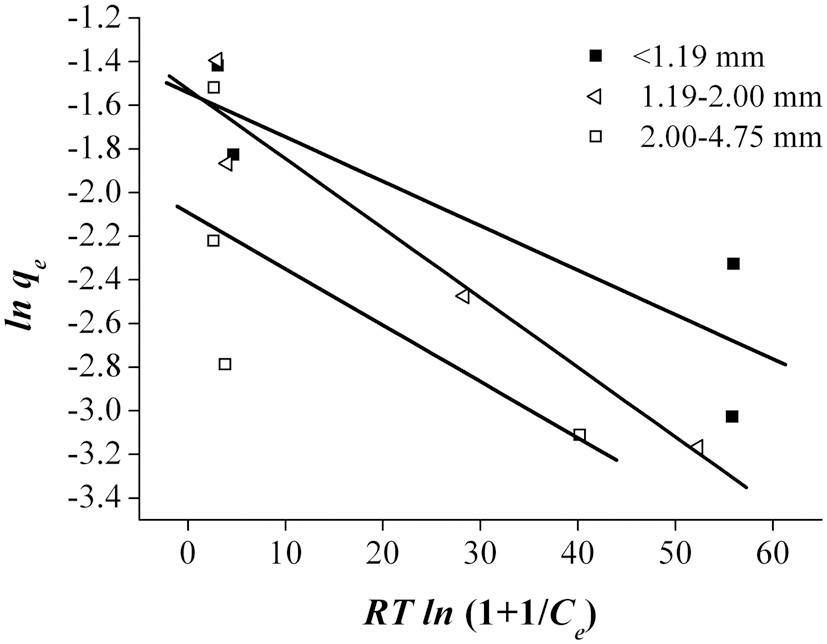
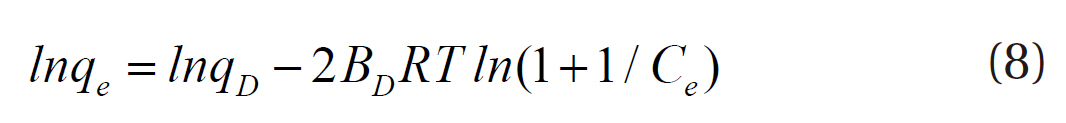
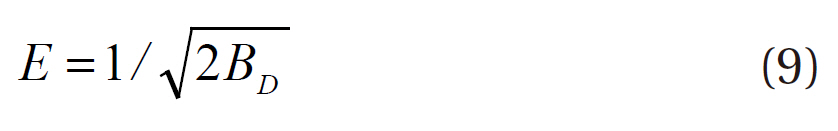
The third model used was the Dubinin-Radushkevich isotherm, which estimates the porosity of a material and the energy of adsorption. The linear form of the equation and the energy of adsorption (E) are presented as follows [7]:
where
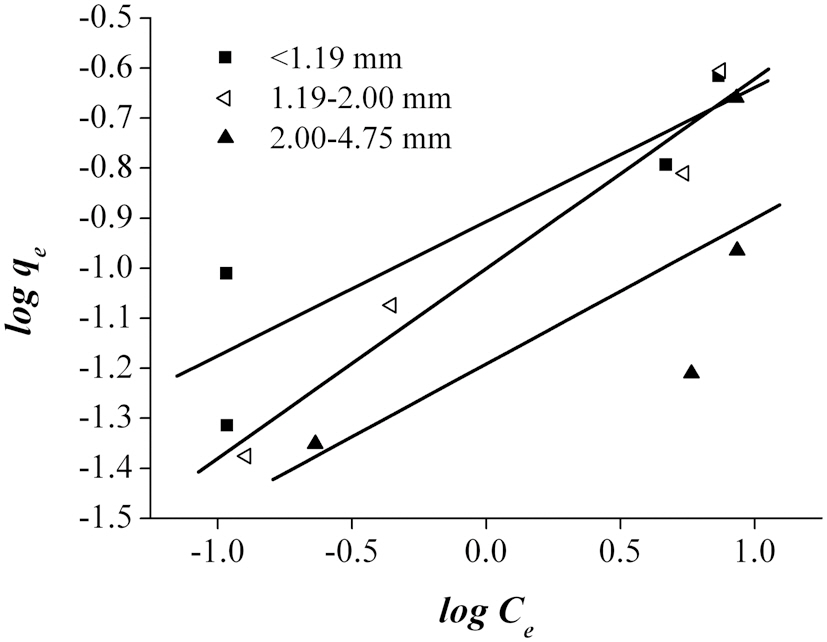
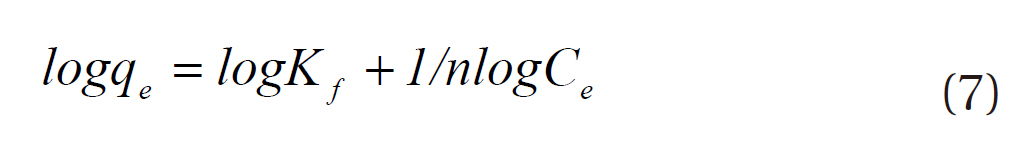
According to Ahmad et al. [2], the Freundlich isotherm is an indication of the surface heterogeneity of the adsorbent, while the Langmuir isotherm only suggests the surface homogeneity of the adsorbent. Based on the equilibrium plots shown in Figs. 7-9 and the equilibrium isotherm constants presented in Table 6, the Freundlich isotherm gave the highest correlation, making this the most suitable model for the sorption of Pb onto bottom
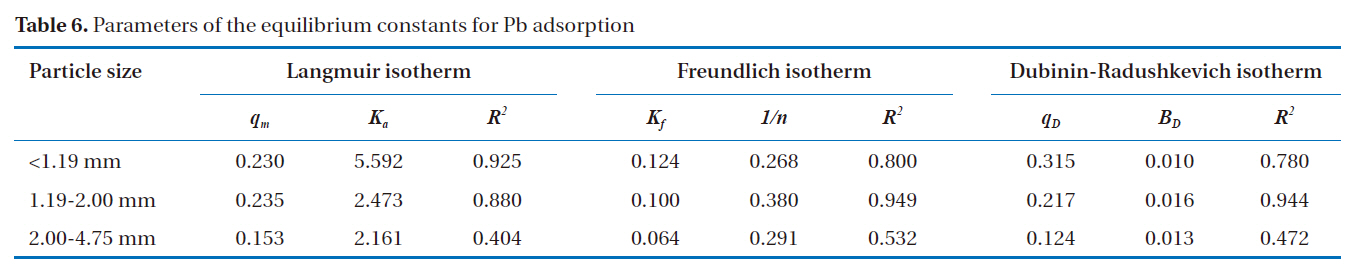
[Table 6.] Parameters of the equilibrium constants for Pb adsorption

Parameters of the equilibrium constants for Pb adsorption
ash. This leads to the conclusion that bottom ash is composed of heterogeneous and multi-layered surfaces, which performed a similar adsorption phenomenon. The higher the value of Kf, the greater the adsorption intensity. Therefore, sizes <1.19 mm have the greatest adsorption capacities, which was similar to the results obtained from the kinetic models. The maximum sorption capacity and energy of adsorption of bottom ash (<1.19 mm size) derived from the Dubinin-Radushkevich isotherm were 0.315 mg/g and 7.008 KJ/mol, respectively.
This study was conducted to assess the effectiveness of the use of bottom ash as a medium for the adsorption of Pb in wastewater. Detailed characterizations of the physical, chemical, leaching and adsorption capacities of bottom ash were performed. Based on the results, the following conclusions were drawn:
The significant amounts of silica and aluminum detected on the surface of the bottom ash should make it a good absorbent of heavy metals.
The KSLT performed on the bottom ash samples indicated that the heavy metals concentrations in all the leachates were incapable of leaching to exceed the Korean limits for safe disposal.
The adsorption and leaching processes were strongly affected by parameters such as the surface area, porosity and contact time .
The adsorption capacity of bottom ash increased with decreasing particle size.
The most suitable kinetic model for providing the best correlation of the adsorption kinetics data was the pseudo-second order model.
Bottom ash is made up of heterogeneous, multi-layered surfaces,which are available for adsorption, as demonstrated by the Freundlich isotherm, the governing equilibrium model.
The maximum sorption capacity and energy of adsorption of bottom ash obtained from the Dubinin-Radushkevich isotherm were 0.315 mg/g and 7.008 KJ/mol, respectively.