In many countries, including Korea, non-point source (NPS)pollution is considered one of the major sources of pollution in agricultural areas1-5). Unlike point source (PS) pollution discharges from defined sources, such as industrial and municipal wastewater treatment plants, NPS pollution originates from many diffuse sources initiated by human activities, such as recreation, road building, logging, intensive forest and agricultural management activities6). In recent years, there has been an increase in the concern related to the serious threat to the quality of downstream environmental due to the movement of eroded sediment due to runoff from agricultural land7,8). As runoff moves downslop, sediments and other pollutant particles are transported to perennial surface water bodies, which impact on water quality and bioadversity9). Agriculture is globally recognized as the leading contributor to nonpoint source pollution of water resources10-12).
In Korea, diffuse pollution from agricultural areas constitutes a source of major NPS nutrients inputs to surface waters, leading to eutrophication and reduced water quality. However, there has been limited research that describes erosion, sedimentation and the water quality dynamic on a watershed scale in Korea. As suggested by the Ministry of the Environment, the total maximum daily load (TMDL) of pollutants was put into practice at all sites, and calculated the pollutant loads due to different land uses13). For the prediction of pollutant loads, a numerical modelling approach is required, which is becoming an increasingly popular tool in the decision making process14, 15). However, to calibrate and validate a useful model, an abundance of monitoring data is required.
Over the last few decades, many researchers have focused on road/highway runoff pollution and the development of appropriate modelling. However, limited research exists describing an impact factor, using accumulated runoff and many monitored events in agricultural sites. The availability of flat, fertile alluvial soils also makes these areas suitable for agricultural production.However, all of these activities result in elevated levels of pollution, which affect the quality of inland fresh water resources.
The aim of the study was to characterize pollutant loads in the runoff from an agricultural plot for the development of TMDL practices. Therefore, the total suspended solids (TSS), biological oxygen demand (BOD), chemical oxygen demand (COD), total nitrogen (TN) and total phosphate (TP), as pollutant loads in runoff, were calculated by measuring their concentrations and the runoff volume per event. The climate condition factors effecting runoff were selected as important factors for a promising model.
2.1. Study area and monitoring period
The study area was located at N36°32′37.8″, E128°47′17.88″, in Andong City, South Korea, which is a sweet potato plot, with a land area of 631 m2 and slope of 8.5%. The study site was a typical agricultural area, where the pollutants caused due to runoff effect the water quality of the adjacent groundwater and rivers. Events were monitored for two years, from Jan. 2008 to Dec. 2009.
[Table 1.] Monitored events vs. rainfall occurrence
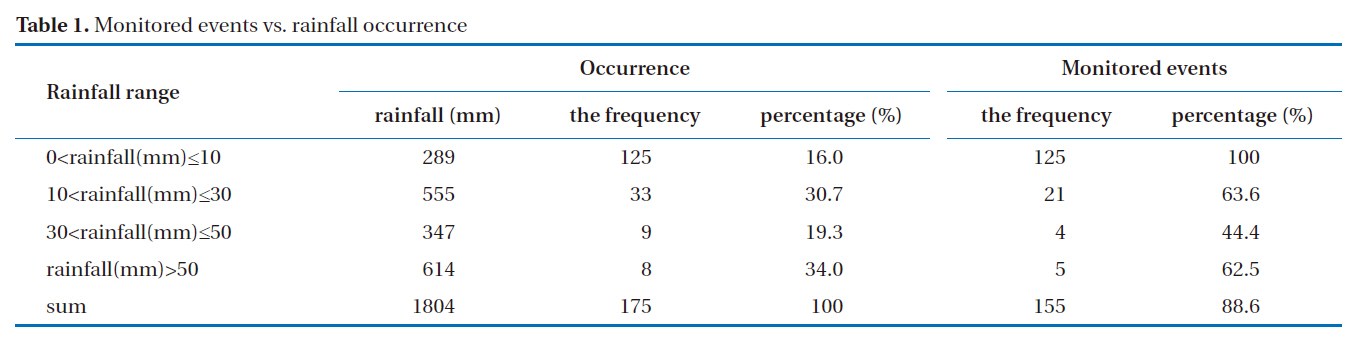
Monitored events vs. rainfall occurrence
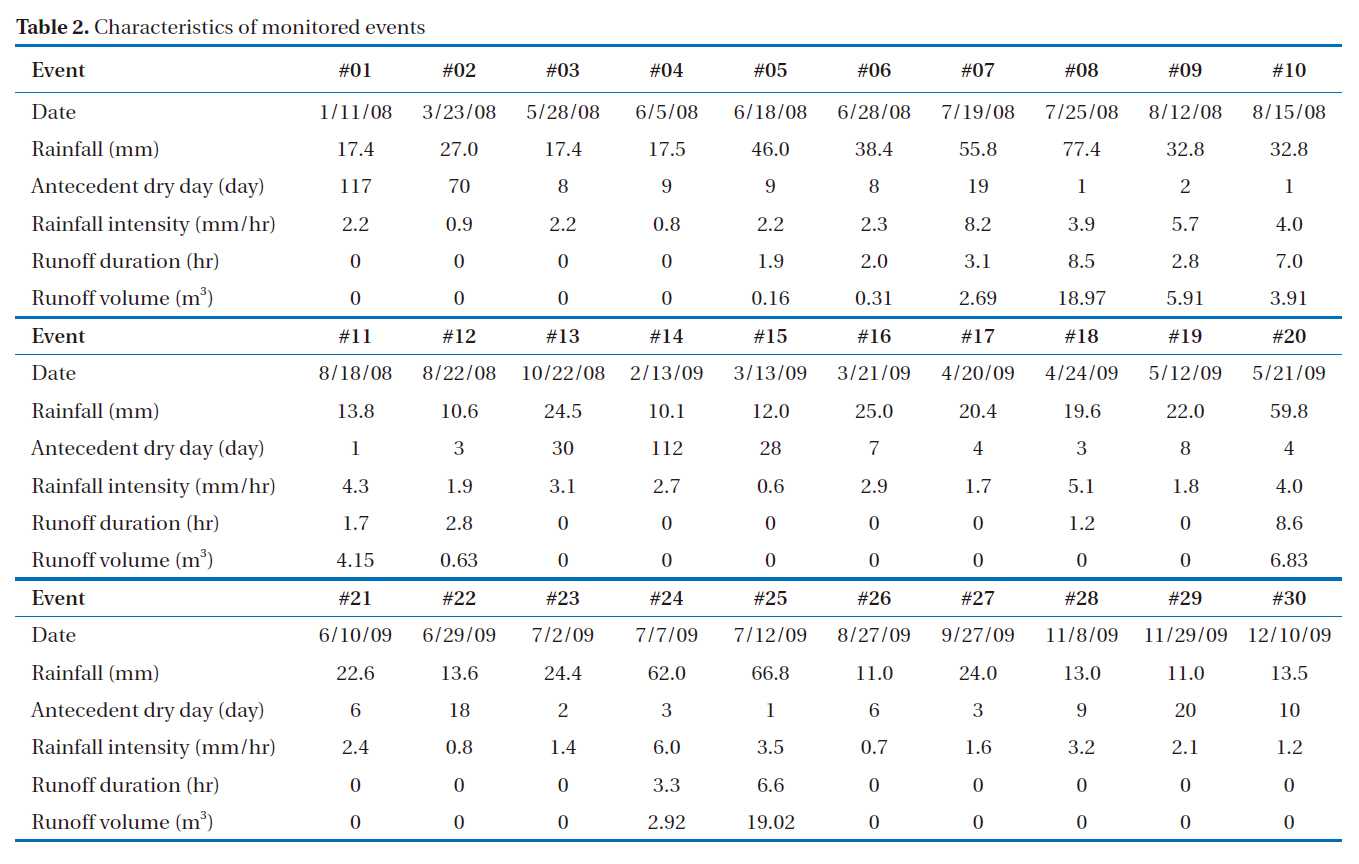
[Table 2.] Characteristics of monitored events

Characteristics of monitored events
Runoff samples were collected from given rainfall events, where the number of samples varied from 5 to 83 due to the characteristics of a given event. Most time intervals for the collection samples were 5 minutes from the initial runoff.
The amounts of precipitation and runoff flow volume were measured directly on site using a Rain gauge, RG20, and Model Flo-tote3 (USA). The TSS, BOD, COD, TN and TP concentrations were measured using standard and Korean water analysis methods. Note: BOD and COD refer to BOD5 and CODMn, respectively.
3.1. Characterization of precipitation and runoff
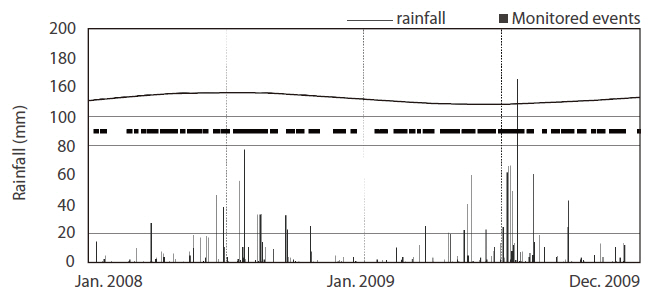
Strong precipitation occurred in summer, accounting for more than 60% of the annual precipitation in Korea. Fig. 1 shows
all the cases of precipitation and monitored events during the research period. The precipitation was monitored throughout the year, with levels ranging from 0.1 to 165 mm. More than 60% of the precipitation occurred during June, July and August. Table 1 summarizes the rainfall and monitored events over a two year period, from 2008 to 2009. More than 88% of the total events were monitored. There were 125 rainfall events <10mm, with 100% of the events monitored. As no runoff was observed in the cases of events very little rainfall, i.e. less than 10mm per event,
these events were not included in this study. The percentages of the monitored rainfall events with the ranges 10 mm Although the plot was a small area, the frequency of monitored events was sufficient for the prediction of runoff in the chosen study area.
3.2. Effect of precipitation factor on runoff
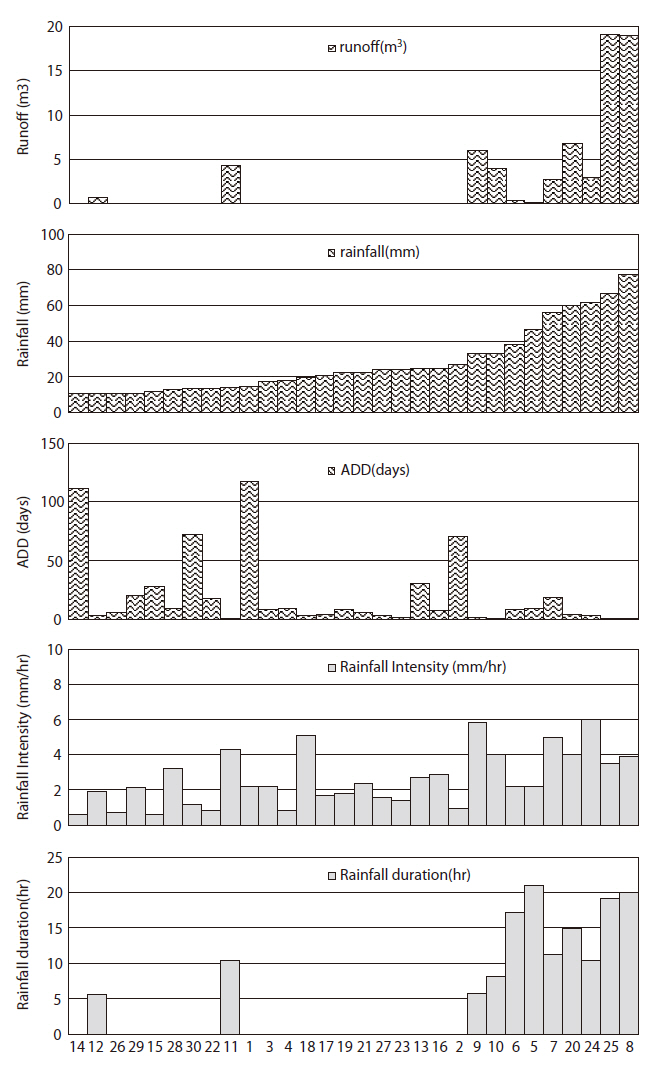
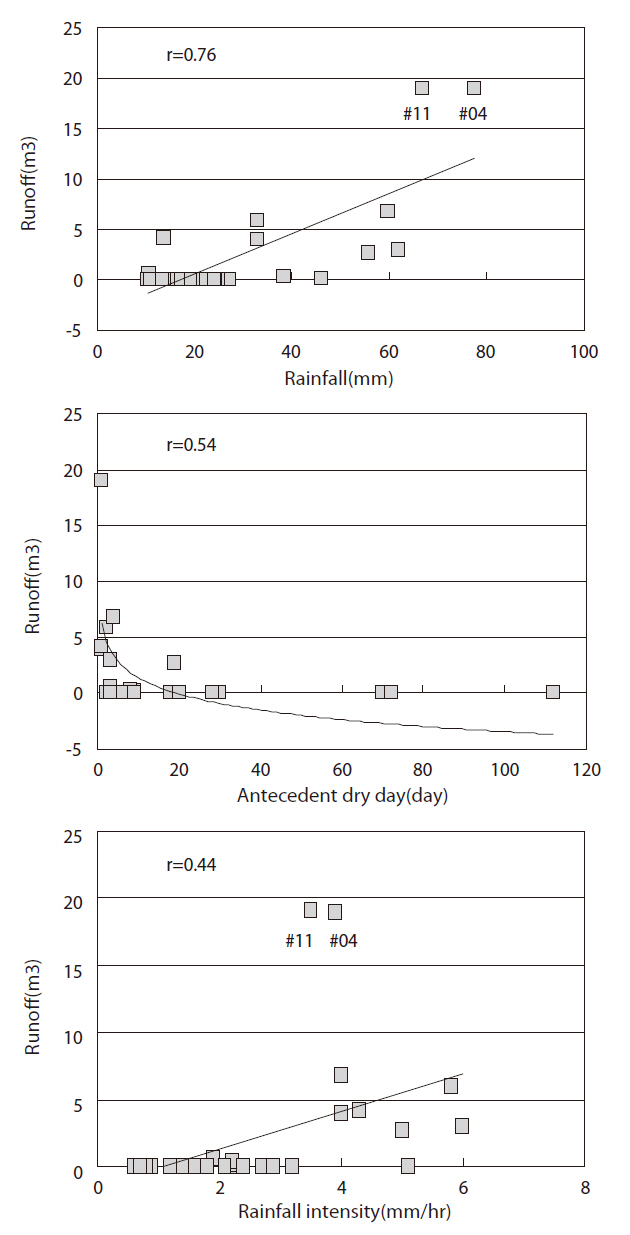
On-site precipitation data (including total precipitation, duration,intensity and days since last rainfall) are described in Table 2. The amounts of precipitation, 10.5 to 77.4 mm, were used to assess the impact of rainfall on runoff. The average rainfall intensity ranged from 0.6 to 6.0mm/hr. The days to antecedent rainfall (>10 mm) ranged from 1 to 117 days. The runoff volumes for 11 events ranged form 0.160 to 19.0 m3.
The effects of precipitation factors, such as total precipitation,days since last rainfall (ADD, the rainfall > 10 mm) and average rainfall intensity on runoff, are shown in Fig.2. Climate factors, such as rain frequency, rainfall intensity and duration,and time since antecedent rainfall, are also important. Usually, runoff occurred with rainfall of more than 30 mm. Large differences in events #14 and #05 showed that the runoff was also affected by ADD and the average rainfall intensity. In Fig. 2, similar runoff was found between events #11 and #10. The rainfall during event #11 was 13.8 mm, less than 30 mm, while that of event#10 was 32.8 mm, which was sufficient for runoff. The rainfall intensity and rainfall duration of event #11 were 4.3 mm/hr and 10.4 hr, and those of event #10 were 4.0 mm/hr and 8.1 hr, respectively. Therefore, the factors, such as rainfall intensity and rainfall duration, can be described as the most important factors on runoff in some cases. Additionally, there was no runoff in 2010, even though there was 47.4 mm of rainfall, due to the long ADD (45 days) and low rainfall intensity (1.5 mm/hr) in the case of the monitored events.
Fig. 3 shows the correlation between the runoff volume and precipitation factors, ADD and average rainfall intensity. The correlation coefficient between runoff and rainfall volume showed a positive strong correlation, with an r=0.76. On the other hand, the runoff volume was negatively correlated with ADD (r=0.54) after log transformation. The average rainfall intensity was slightly affected by runoff, with a low coefficient of r=0.44. However, with the exception of events #04 (rainfall: 77.4 mm) and #11 (rainfall: 66.8 mm), which were affected by rainfall as the main factor, the correlation between runoff and rainfall intensity was high, with r=0.69. From this study, rainfall would appear to be a promising factor for calculating runoff.
3.3. Correlation analysis of runoff pollutant
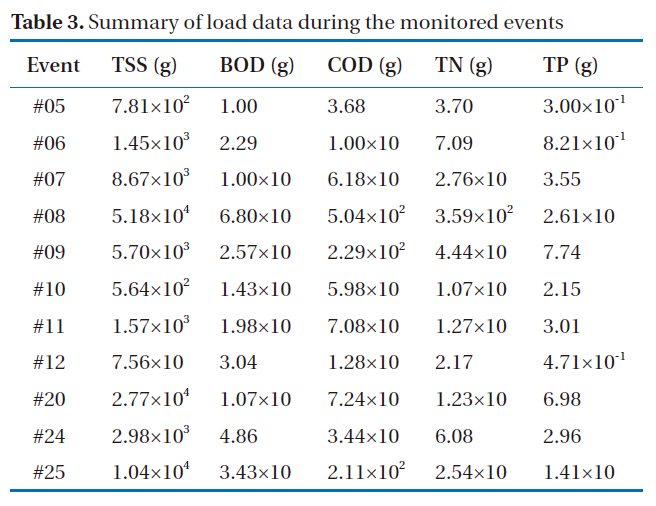
Pollutant loads were calculated based on their measured concentrations and the runoff flow rate of the samples collected during the runoff period. The runoff samples were collected for the entire rainfall duration whenever events were monitored. Load data were obtained for 11 events, which are summarized in Table 3. The TSS load varied greatly per event, between 75.6 and 5.18 x 10⁴ g. The BOD, COD, TN and TP loads varied between 1.0 and 68, 3.7 and 50 x 10, 3.1 and 3.9 x 10² and 0.30 and 26 g per event, respectively. In the case of event #08, the values were highest for all events. In order to assess the possible relationships between the analyzed pollutants, a correlation analysis
[Table 3.] Summary of load data during the monitored events

Summary of load data during the monitored events
was performed. All correlations between pollutant loads and runoff volumes showed much higher than those between pollutant loads and rainfall, as shown in Table 4.
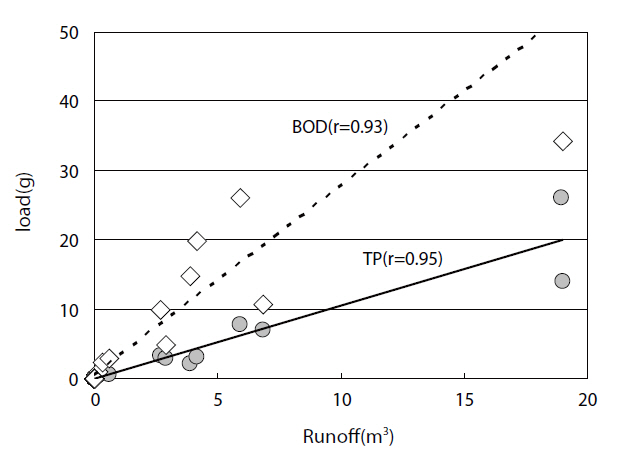
Significantly positive correlations were obtained for TSS, BOD, COD and TP with runoff volumes, with high coefficients of 0.72, 0.89, 0.85 and 0.93, respectively. The correlation obtained for TN with runoff volumes was not significant. TN showed different behaviors with each of the pollutants. Correlations, with coefficients (r) >0.70 indicate that the relationship is very good as model data. On the other hand, correlations obtained for runoff pollutants, such as TSS, BOD, COD, TN and TP, with rainfall,showed lower values than those obtained for pollutants and runoff volume. This means that rainfall is not a sufficient factor in calculating pollutant loads based on the actual monitored data. Hence, another important effect factor, such as ADD or rainfall intensity on the runoff volume, needs to be considered.
[Table 4.] Correlations between the pollutant loads and runoff volumes
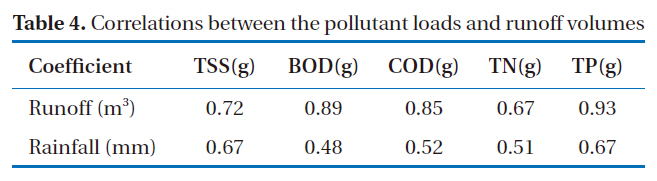
Correlations between the pollutant loads and runoff volumes
As shown in Fig.4, the runoff volume could be used to predict the BOD and TP loads caused by non-point sources by performing buildup experiments to find other factors.
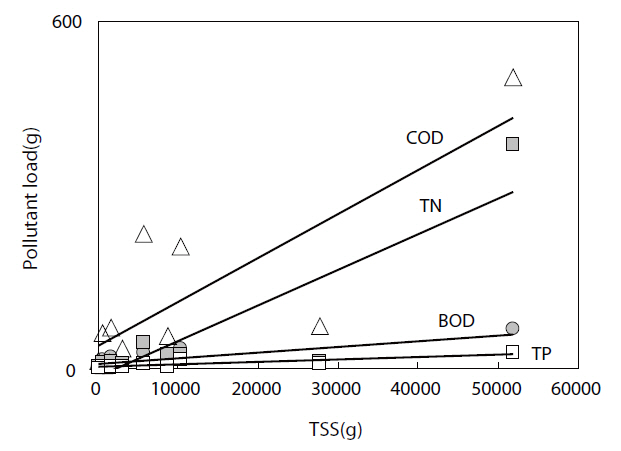
The TSS is a measure of the concentrations of sediment, solid particles suspended and other pollutants carried by runoff. Fig. 5 shows the results of correlation analyses between TSS and other pollutants, such organics (BOD & COD) and nutrients(TN & TP). Correlations with coefficient (r) >0.70 indicate that other pollutant loads were significantly affected by the TSS load.Significant positive correlations were obtained for BOD, COD, TN and TP with the TSS load, with high coefficients of 0.79, 0.82, 0.87 and 0.88, respectively.
Runoff was the main source of poor water quality in the river basin. Therefore, improving the quality of surface water is the main goal of many NPS pollution investigations.
Despite the amount of precipitation being less than 30 mm, 4.27 m3 of runoff occurred due to the short ADD (1 day) and high rainfall intensity (4.3 mm/hr). In contrast, 0.16 m3 of runoff occurred with 46.0 mm of precipitation. In this case, the primal effect on runoff was not the amount of precipitation. However, the runoff volume was correlated most highly with the total precipitation. The best regression equation to estimate runoff for rain events was based on the amount of rainfall (r=0.76). The correlations between pollutants load, such as TSS, BOD, COD and TP, and runoff volumes, showed significantly positive values greater than r=0.72 for all pollutants. However, the behavior of the TN load differed from those of the other pollutant loads, including TSS, BOD, COD and TP. Therefore, Sustainable research is required for understanding the TN load. Due to the high correlations of more than r=0.79 between the TSS load and pollutant loads of BOD, COD, TN and TP, the TSS could be an appropriate factor for estimating the pollutant loads of BOD, COD, TN and TP. Organics and nutrient pollutants could be reduced the TSS in runoff can be controlled.