검색 전체 메뉴
PDF
맨 위로
OA 학술지
Can we estimate forest gross primary production from leaf lifespan? A test in a young Fagus crenata forest
  • 비영리 CC BY-NC
  • 비영리 CC BY-NC
ABSTRACT
Can we estimate forest gross primary production from leaf lifespan? A test in a young Fagus crenata forest
KEYWORD
Fagus crenata , functional leaf longevity , gross primary production , mean labor time , temperate forest
  • INTRODUCTION

    The gross primary production (GPP) of forests may function as a terrestrial carbon sink against climate change (Suwa et al. 2006, Canadell et al. 2007, Luyssaert et al. 2008, Saigusa et al. 2008, Lewis et al. 2009). GPP is also a fundamental energy and material source that occurs in forest ecosystems as the result of litter input (Kurokawa and Nakashizuka 2008, Litton and Giardina 2008), and the activity of ectomycorrhiza (Druebert et al. 2009). Recent "ecological scaling" theories have outlined simple relationships predicting ecosystem carbon gain from single leaf photosynthesis (Sellers et al. 1992, Koyama and Kikuzawa 2009, 2010). However, these models are useful for the spatial integration of canopy photosynthesis. To estimate GPP, temporal integration over growing seasons is required (Thornley 2002). In service of this objective, numerical calculations (e.g. Hikosaka 2003) have been applied. However, a simple model for time-integration over the growing period has yet to be developed.

    Leaf demography and longevity has been studied extensively in association with whole-plant carbon economy (Chabot and Hicks 1982, Ackerly and Bazzaz 1995, Franklin and Agren 2002, Oikawa et al. 2004, 2008, Reich et al. 2004, Hikosaka 2005, Koyama and Kikuzawa 2008, 2009, Mediavilla and Escudero 2009, Suarez 2010). Mathematical models predicted that higher photosynthetic rates in leaves would result in higher leaf turnover rates, accompanied by reduced leaf longevity (Kikuzawa 1991, Ackerly 1999, Hikosaka 2003). In support of this notion, a negative correlation was observed to exist between leaf lifespan and the instantaneous light-saturated leaf photosynthetic rate (Chabot and Hicks 1982, Koike 1988, Reich et al. 1991, 1997, Wright et al. 2004, Vincent 2006, Ishida et al. 2008, Nagano et al. 2009). Hence, it has been suggested that this lifespan-carbon gain relation can be employed in the development of a quantitative model of ecosystem productivity (Saura-Mas et al. 2009). However, to the best of our knowledge, no study has yet successfully estimated GPP via this relationship.

    Kikuzawa and Lechowicz (2006) recently proposed a scheme that predicts GPP over the growing period, using a simple model. In essence, they demonstrated that if the leaf lifespan is a function of the daily carbon gain of that leaf, then the leaf lifetime carbon gain can be viewed as an inverse function of the leaf lifespan. In this paper, we applied this method to estimate the GPP of a temperate deciduous forest composed of Japanese beech (Fagus crenata). We combined leaf demography census, periodical measurements of light-saturated photosynthetic rate of sample leaves, and litter measurements, and converted the light-saturated photosynthetic rate into the leaf lifetime carbon gain value, by using the leaf lifespan.

      >  Model

    Our model is based on the model described by Kikuzawa and Lechowicz (2006), with some slight modifications. The relevant symbols are listed in Table 1. The two principal assumptions here are as follows: 1) leaf lifespan is determined so as to maximize whole-plant carbon gain, in concert with the numerical model of Kikuzawa (1991) (for a more elaborate version of this model, see Takada et al. 2006). This model was also supported by the empirical data (Kikuzawa and Ackerly 1999). 2) Stand leaf biomass is constant for closed steady-state canopies (Tadaki 1986, 1991). GPP (g C m-2 y-1) is the sum of leaf photosynthesis of all the leaves within a stand:

    image

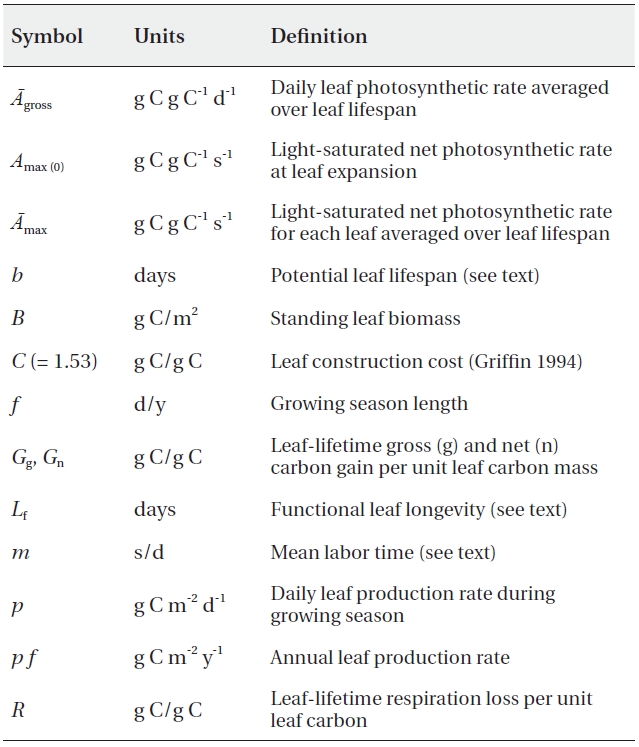
    [Table 1.] List of the parameters

    label

    List of the parameters

    B is the standing leaf biomass (g C/m2) and Agross (g C g C-1 d-1) is the daily gross leaf photosynthetic rate averaged over the leaf lifespan and over the stand. f (d/y) is the number of days on which photosynthesis was conducted per year (i.e. growing season length). Eq. 1 can be rewritten by multiplying the right side by Lf/Lf (= 1), where Lf denotes the functional leaf longevity (Kikuzawa and Lechowicz 2006):

    image

    Functional leaf longevity (Lf) is the number of days on which the leaf actually carries out photosynthesis within its lifespan. For evergreen leaves in seasonal environments, Lf is the difference between the observed leaf lifespan (total number of days, for which one leaf exists) and the length of the unfavorable period for photosynthesis (i.e. winter, dry season etc.). In the case of wet tropics, as well as the case of deciduous leaves in a seasonal climate, Lf equals the observed leaf lifespan. Based on the assumption of constant stand leaf biomass, the ratio of stand leaf biomass B (g C/m2) and Lf (days) is assumed to be equal to the daily leaf turnover rate during the favorable season, which is denoted by p (g C m-2 d-1):

    image

    The product of functional leaf longevity (Lf) and daily leaf photosynthetic rate averaged over the leaf lifespan (Agross) is equivalent to the leaf lifetime gross carbon gain, which is denoted by Gg (g C/g C):

    image

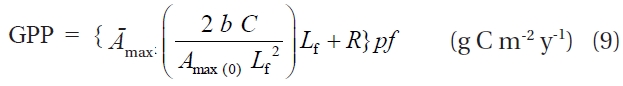
    By substituting Eq. 3 and Eq. 4 into Eq. 2, GPP can be rewritten as:

    image

    The product of p and f is an annual leaf carbon turnover rate (i.e. annual leaf death rate is assumed to be equal to the production rate). In essence, Eq. 5 expresses GPP as the product of the "amount of carbon produced per unit leaf carbon through its lifecycle (Gg)" and the "annual leaf-carbon lifecycle turnover rate (p f)". Those equations are generic, in the sense that they may be applicable to ecosystems with different lengths of growing season (wet tropics, dry tropics, temperate, etc.), as well as with different leaf lifespans (deciduous, evergreens which has leaf lifespan longer than one year, etc.). Gg is the sum of leaf-lifetime net carbon gain Gn (g C/g C) and leaf-lifetime respiration R (g C/g C):

    image

    Gn can be expressed as the product of the three following parameters:

    image

    Amax (g C g C-1 s-1) is an instantaneous light-saturated net photosynthetic rate averaged over the leaf lifespan, and m (s/d) is a conversion coefficient from light-saturated rate into the actual net photosynthetic rate averaged over its lifespan realized at the site, and referred to as the "mean labor time" (Kikuzawa et al. 2004). m is a combination of all the factors that decide the actual photosynthetic rates of leaves under each field condition, including the diurnal solar cycle, weather, self-shading, and midday depression. In a previous study (Kikuzawa et al. 2004), all of those factors were measured in order to calculate m. In this study, we employed an optimal leaf longevity theory (Kikuzawa 1991) to estimate m. This is based on the notion that, when an optimal leaf lifespan is a function of the leaf carbon budget, the leaf carbon gain should be an inverse function of the leaf lifespan. Kikuzawa and Lechowicz (2006) then proposed an equation to calculate m from the leaf lifespan:

    image

    m is conventionally expressed as seconds per day (Kikuzawa et al. 2004). Amax (0) (g C g C-1 s-1) is the mass-based light-saturated net photosynthetic rate of a fully expanded leaf. b (days) is the time at which the light-saturated photosynthetic rate of each leaf becomes zero, assuming the linear decline of light-saturated photosynthetic rate with respect to time. C (g C/g C) is the construction cost of a leaf, defined as the amount of carbon material required to construct one unit of leaf carbon mass. In this study, C was assumed to be 1.53 g C/g C (Griffin 1994). The substitution of Eqs. 6, 7 and 8 into Eq. 5 resulted in the following:

    MATERIALS AND METHODS

      >  Species and site

    Fagus crenata Blume is a late-successional deciduous canopy tree found in mountainous forests throughout Japan, and is a major component of those forests (Okaura and Harada 2002). The study site employed herein was the Ishikawa Prefectural Forest Experiment Station at the foot of Mt. Hakusan in central Japan (36o25' N, 136o38' E, 200 m a.s.l.). The mean annual temperature and mean annual precipitation were 13.0℃ and 2,438 mm, respectively (Ishikawa Prefectural Forest Experiment Station 2008). The stand was a 14 year-old plantation of Japanese beech (Fagus crenata Blume). There were 130 trees in an area of 171 m2, and the heights of the trees were 4-5 m and the mean diameter at breast height was 4 cm in 2006. The canopy was fairly closed, and there was almost no understory vegetation.

      >  Measurement of photosynthesis

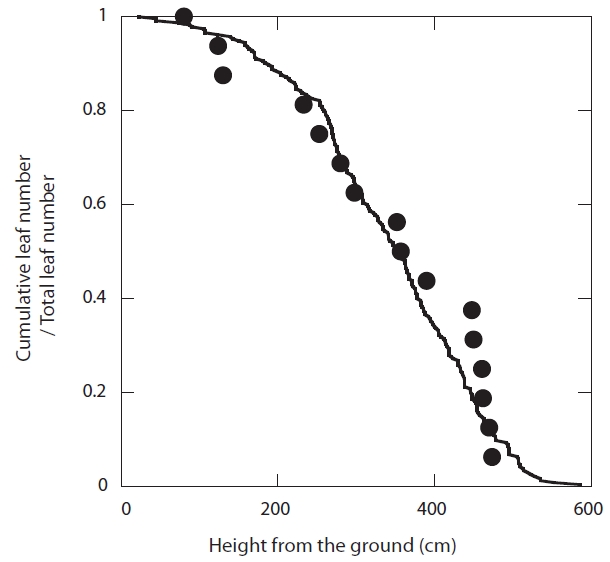
    In 2007, a scaffolding tower that reached the canopy was constructed. A total of 16 leaves were selected from four trees from the entire position of the canopy (0.8-4.7 m from the ground). Sample leaves were selected from different heights, so as to represent the entire leaf population (Fig. 1). Photosynthesis measurements were repeated for the same leaves 6-13 times, from May to November of 2007. The number of measurements was smaller for the leaves that fell earlier. The photosynthetic rate of each leaf was measured using a portable infrared gas analyzer (LI-6400; LI-COR, Lincoln, NE, USA). Photosynthetic photon flux density (PPFD) 1,500 μmol m-2 s-1 was supplied until the equilibration of the leaf with an LED light source (LI-6400-02B; LI-COR) within the chamber. The equilibration required 10-20 minutes for the upper-canopy leaves, and 20-30 minutes for the lower-canopy leaves. CO2 concentrations inside the chamber were controlled at 350 ppm. We did not control the air temperature inside the chamber, which ranged from 22-30℃. Measurements were conducted from 8 to 11 a.m. each day. After each measurement, PPFD was changed to zero, and after equilibration (10-20 minutes), the dark respiration rate was measured. The gross light-saturated photosynthetic rate of the leaves on each day is acquired as the sum of the light-saturated net photosynthetic rate and the dark respiration rate.

    For each of the monitored leaves, we sampled three adjacent leaves on the same horizontal branch in the summer. The areas of those leaves were determined via the analysis of digitally-scanned images with Adobe Photoshop Elements (Adobe Systems Inc., San Jose, CA, USA). The leaf samples were then oven-dried at 70℃ to a constant weight and weighed. The mean leaf mass per area of each of those three leaves was used as surrogate values for each of the monitored leaves. Using them, area-based photosynthetic- and respiration rates for each leaf were converted into mass-based values. Those leaf masses and the leaf litter were converted as follows: 1 g dry leaf = 0.5 g C (Yamasaki and Kikuzawa 2003), in order to obtain the carbon-based values.

      >  Leaf demography

    Sample leaves for the photosynthesis measurements were monitored from leaf emergence until fall at 7-23-day intervals in 2007. Functional leaf longevity (Lf) was calculated as the difference between leaf emergence and fall, as those leaves were detected only during the growing season. Ten litter traps (0.17 m2 for each) were set on the stand floor such that they were evenly distributed throughout the entire forest. The litters were collected every month from April to November, and separated into leaves and branches. The leaves were oven-dried at 70℃ to a constant weight and weighed. The annual leaf production rate (p f) is assumed to be equal to the annual leaf fall from the beech trees, assuming that the loss by herbivory was negligible.

      >  Data analysis for photosynthesis

    The lifetime maximum instantaneous light-saturated net photosynthetic rate is used as the Amax (0) for each leaf (Kikuzawa 1991). The Amax was calculated as the lifetime average of the net light-saturated photosynthetic rate for each leaf. The slope of the linear regression of the light-saturated photosynthetic rate with time was calculated and tested via Microsoft Excel (t-test). The time at which the light-saturated photosynthetic rate of each leaf becomes zero (b) was estimated via the regression line.

    RESULTS AND DISCUSSION

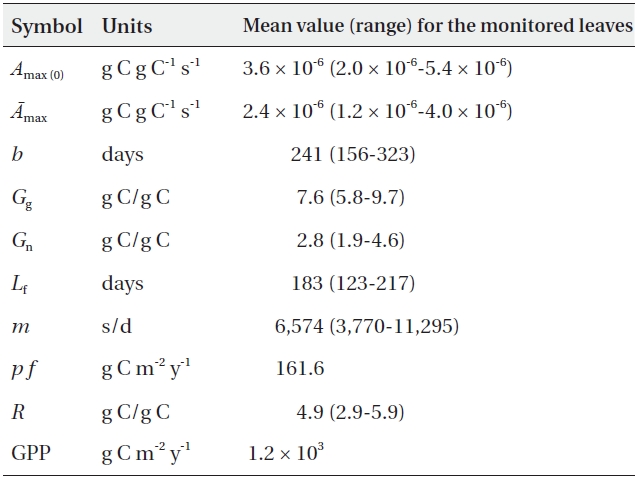
    The results were summarized in Table 2. F. crenata is a representative species of simultaneous leaf emergence and fall (Kikuzawa 1983, 2003). At the study site, all of the leaves emerged almost simultaneously in late April, and the leaf fall was concentrated in October or November. The mean functional leaf lifespan (Lf) of the sample leaves was 183 days. In addition to those sampled leaves, we also measured a total of 1,066 leaves from the entire position of the canopy, to determine the lifespans of the sample leaves. The mean lifespan of the additional 1,066 leaves was 184 days, which was similar to those of the monitored leaves, thereby indicating that the lifespans of those sample leaves represented those of the entire canopy.

    [Table 2.] The estimated parameters in 2007

    label

    The estimated parameters in 2007

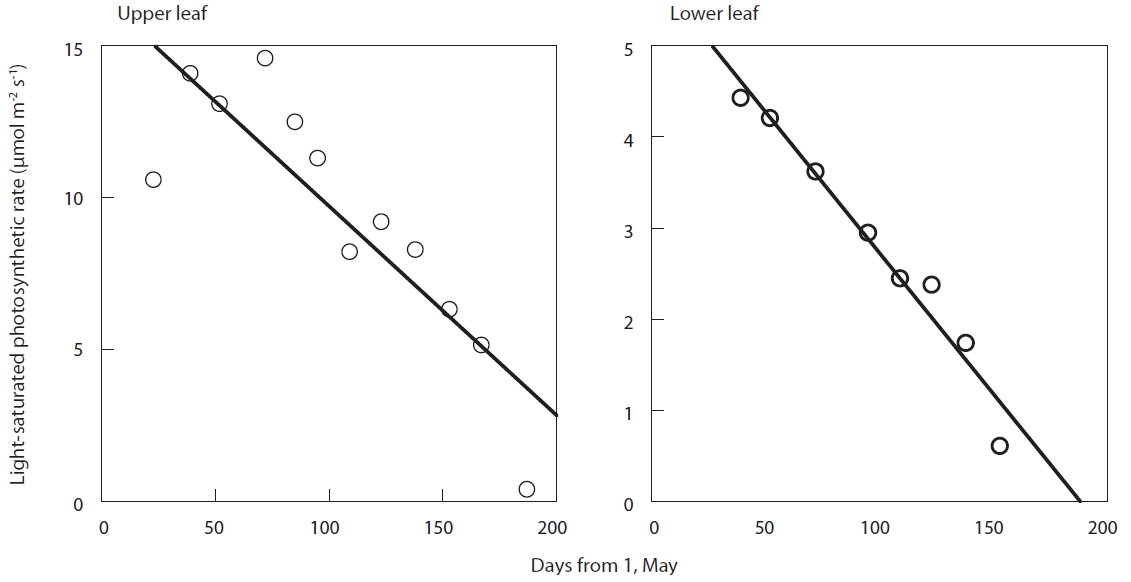
    The light-saturated net photosynthetic rate of each leaf reduced in an almost linear fashion after full expansion (Fig. 2). The slope of the linear regression of light-saturated photosynthetic rate with time was found to be significant for all the leaves (P < 0.05, r2 = 0.52-0.96, N = 16). The decline of photosynthetic capacity with increasing leaf age has been observed commonly among woody species (Koike 1990, Kitajima et al. 2002, Kikuzawa 2003, Mediavilla and Escudero 2003, Ito et al. 2006, Han et al. 2008, Kikuzawa et al. 2009, Reich et al. 2009). However, the decline of photosynthetic capacity was frequently not precisely linear, but rather curvilinear (cf. Koike 1990). Hence, the linear regression was a simplified approximation, and more elaborated models should incorporate the curvilinear change characteristics of photosynthetic capacity.

    The estimated GPP of the forest (1.2 × 10³ g C m-2 y-1) was within the GPP range of beech forests in central Japan (0.57 × 10³-1.56 × 10³ g C m-2 y-1, assuming that 1 g dry matter = 0.44 g C) previously reported by Kakubari (1991), which employs the conventional allometric method. This was also similar to the GPP range for a 30-year old European beech forest (1,000-1,300 g C m-2 y-1), which was estimated via eddy flux measurements (Granier et al. 2000). To the best of our knowledge, this is the first application of the leaf lifespan theory to the calculation of GPP. Although our method may be less accurate than the present eddy flux measurements, our theoretical approach produced a value proximate to the actual one.

    The principal assumption of this model is that leaf longevity is determined so as to maximize whole-plant carbon gains in concert with the numerical model developed by Kikuzawa (1991). Many previous reports conducted in the tropics have corroborated the carbon-economy model (e.g. Reich et al. 1991, 1999, 2004, Vincent 2006). However, leaf longevity should be susceptible to the effects of strong seasonality in temperate regions (Reich et al. 2004, Vincent 2006, Koyama and Kikuzawa 2008). Nonetheless, two lines of evidence appear to suggest that leaf longevity in temperate regions functions as an indicator of the carbon budget of a plant. Firstly, temperate species were included in the worldwide leaf economic spectrum (Reich et al. 1997, 1999, Ackerly and Reich 1999, Wright et al. 2004, He et al. 2009). If the effect of seasonality is predominant, species in the temperate region should be outliers within those spectra; however, this is not the case. Secondly, variations in leaf longevity in temperate regions have also been predicted by carbon economy models (Hikosaka 2005, Oikawa et al. 2006, 2008). Even within the same temperate forest, deciduous and evergreen leaf habits coexist in microclimates, with deciduous trees tending to be found in more productive environments (Monk 1966, Chabot and Hicks 1982, Kikuzawa 1984, Koyama and Kikuzawa 2008). Leaf longevity in temperate regions should, assumedly, reflect the carbon economy of plants. Hence, the method presented herein should be globally applicable, based on the generality of the leaf economic spectra.

참고문헌
  • 1. Ackerly D 1999 Self-shading carbon gain and leaf dynamics: a test of alternative optimality models [Oecologia] Vol.119 P.300-310 google cross ref
  • 2. Ackerly D.D, Bazzaz F.A 1995 Leaf dynamics self-shading and carbon gain in seedlings of a tropical pioneer tree [Oecologia] Vol.101 P.289-298 google cross ref
  • 3. Ackerly D.D, Reich P.B 1999 Convergence and correlations among leaf size and function in seed plants: a comparative test using independent contrasts [Am J Bot] Vol.86 P.1272-1281 google cross ref
  • 4. Canadell J.G, Le Quere G, Raupach M.R, Field C.B, Buitenhuis E.T, Ciais P, Conway T.J, Gillett N.P, Houghton R.A, Marland G 2007 Contributions to accelerating atmospheric CO2 growth from economic activity carbon intensity and efficiency of natural sinks [Proc Natl Acad Sci U S A] Vol.104 P.18866-18870 google cross ref
  • 5. Chabot B.F, Hicks D.J 1982 The ecology of leaf life spans [Ann Rev Ecol Syst] Vol.13 P.229-259 google cross ref
  • 6. Druebert C, Lang C, Valtanen K, Polle A 2009 Beech carbon productivity as driver of ectomycorrhizal abundance and diversity [Plant Cell Environ] Vol.32 P.992-1003 google cross ref
  • 7. Franklin O, Agren G.I 2002 Leaf senescence and resorption as mechanisms of maximizing photosynthetic production during canopy development at N limitation [Funct Ecol] Vol.16 P.727-733 google cross ref
  • 8. Granier A, Ceschia E, Damesin C, Dufrene E, Epron D, Gross P, Lebaube S 2000 The carbon balance of a young Beech forest [Funct Ecol] Vol.14 P.312-325 google cross ref
  • 9. Griffin K.L 1994 Calorimetric estimates of construction cost and their use in ecological studies [Funct Ecol] Vol.8 P.551-562 google cross ref
  • 10. Han Q, Kawasaki T, Nakano T, Chiba Y 2008 Leaf-age effects on seasonal variability in photosynthetic parameters and its relationships with leaf mass per area and leaf nitrogen concentration within a Pinus densiflora crown [Tree Physiol] Vol.28 P.551-558 google
  • 11. He J.S, Wang X, Flynn D.F.B, Wang L, Schmid B, Fang J 2009 Taxonomic phylogenetic and environmental trade-offs between leaf productivity and persistence [Ecology] Vol.90 P.2779-2791 google cross ref
  • 12. Hikosaka K 2003 A model of dynamics of leaves and nitrogen in a plant canopy: an integration of canopy photosynthesis leaf life span and nitrogen use efficiency [Am Nat] Vol.162 P.149-164 google cross ref
  • 13. Hikosaka K 2005 Leaf canopy as a dynamic system: ecophysiology and optimality in leaf turnover [Ann Bot] Vol.95 P.521-533 google cross ref
  • 14. Ishida A, Nakano T, Yazaki K, Matsuki S, Koike N, Lauenstein D.L, Shimizu M, Yamashita N 2008 Coordination between leaf and stem traits related to leaf carbon gain and hydraulics across 32 drought-tolerant angiosperms [Oecologia] Vol.156 P.193-202 google cross ref
  • 15. 2008 Ishikawaken Ringyo Shikenjo Gyomu Hokoku Vol 46 Annual Report of the Ishikawa Prefectural Forest Experiment Station P.22-23 google
  • 16. Ito A, Muraoka H, Koizumi H, Saigusa N, Murayama S, Yamamoto S 2006 Seasonal variation in leaf properties and ecosystem carbon budget in a cool-temperate deciduous broad-leaved forest: simulation analysis at Takayama site Japan [Ecol Res] Vol.21 P.137-149 google cross ref
  • 17. Kakubari Y 1991 Primary productivity changes for a fifteen-year period in a natural beech (Fagus crenata) forest in the Naeba mountains [J Jpn For Soc] Vol.73 P.370-374 google
  • 18. Kikuzawa K 1983 Leaf survival of woody plants in deciduous broad-leaved forests 1 Tall trees [Can J Bot] Vol.61 P.2133-2139 google
  • 19. Kikuzawa K 1984 Leaf survival of woody plants in deciduous broad-leaved forests 2 Small trees and shrubs [Can J Bot] Vol.62 P.2551-2556 google cross ref
  • 20. Kikuzawa K 1991 A cost-benefit analysis of leaf habit and leaf longevity of trees and their geographical pattern [Am Nat] Vol.138 P.1250-1263 google cross ref
  • 21. Kikuzawa K 2003 Phenological and morphological adaptations to the light environment in two woody and two herbaceous plant species [Funct Ecol] Vol.17 P.29-38 google cross ref
  • 22. Kikuzawa K, Ackerly D 1999 Significance of leaf longevity in plants [Plant Species Biol] Vol.14 P.39-45 google cross ref
  • 23. Kikuzawa K, Lechowicz M.J 2006 Toward synthesis of relationships among leaf longevity instantaneous photosynthetic rate lifetime leaf carbon gain and the gross primary production of forests [Am Nat] Vol.168 P.373-383 google cross ref
  • 24. Kikuzawa K, Shirakawa H, Suzuki M, Umeki K 2004 Mean labor time of a leaf [Ecol Res] Vol.19 P.365-374 google cross ref
  • 25. Kikuzawa K, Yagi M, Ohto Y, Umeki K, Lechowicz M.J 2009 Canopy ergodicity: can a single leaf represent an entire plant canopy? [Plant Ecol] Vol.202 P.309-323 google cross ref
  • 26. Kitajima K, Mulkey S.S, Samaniego M, Wright S.J 2002 Decline of photosynthetic capacity with leaf age and position in two tropical pioneer tree species [Am J Bot] Vol.89 P.1925-1932 google cross ref
  • 27. Koike T 1988 Leaf structure and photosynthetic performance as related to the forest succession of deciduous broad-leaved trees [Plant Species Biol] Vol.3 P.77-87 google cross ref
  • 28. Koike T 1990 Autumn coloring photosynthetic performance and leaf development of deciduous broad-leaved trees in relation to forest succession [Tree Physiol] Vol.7 P.21-32 google
  • 29. Koyama K, Kikuzawa K 2008 Intraspecific variation in leaf life span for the semi-evergreen liana Akebia trifoliata is caused by both seasonal and aseasonal factors in a temperate forest [J Ecol Field Biol] Vol.31 P.207-211 google cross ref
  • 30. Koyama K, Kikuzawa K 2009 Is whole plant photosynthetic rate proportional to leaf area? A test of scalings and a logistic equation by leaf demography census [Am Nat] Vol.173 P.640-649 google cross ref
  • 31. Koyama K, Kikuzawa K 2010 Geometrical similarity analysis of photosynthetic light response curves light saturation and light use efficiency [Oecologia] google cross ref
  • 32. Kurokawa H, Nakashizuka T 2008 Leaf herbivory and decomposability in a Malaysian tropical rain forest [Ecology] Vol.89 P.2645-2656 google cross ref
  • 33. Lewis S.L, Lopez-Gonzalez G, Sonke B, Affum-Baffoe K, Baker T.R, Ojo L.O, Phillips O.L, Reitsma J.M 2009 Increasing carbon storage in intact African tropical forests [Nature] Vol.457 P.1003-1006 google cross ref
  • 34. Litton C.M, Giardina C.P 2008 Below-ground carbon flux and partitioning: global patterns and response to temperature [Funct Ecol] Vol.22 P.941-954 google cross ref
  • 35. Luyssaert S, Schulze E.D, Borner A, Knohl A, Hessenmoller D, Law B.E, Ciais P, Grace J 2008 Old-growth forests as global carbon sinks [Nature] Vol.455 P.213-215 google cross ref
  • 36. Mediavilla S, Escudero A 2003 Photosynthetic capacity integrated over the lifetime of a leaf is predicted to be independent of leaf longevity in some tree species [New Phytol] Vol.159 P.203-211 google cross ref
  • 37. Mediavilla S, Escudero A 2009 Ontogenetic changes in leaf phenology of two co-occurring Mediterranean oaks differing in leaf life span [Ecol Res] Vol.24 P.1083-1090 google cross ref
  • 38. Monk C.D 1966 An ecological significance of evergreenness [Ecology] Vol.47 P.504-505 google cross ref
  • 39. Nagano S, Nakano T, Hikosaka K, Maruta E 2009 Needle traits of an evergreen coniferous shrub growing at wind-exposed and protected sites in a mountain region: does Pinus pumila produce needles with greater mass per area under wind-stress conditions? [Plant Biol] Vol.11 P.94-100 google cross ref
  • 40. Oikawa S, Hikosaka K, Hirose T 2006 Leaf lifespan and lifetime carbon balance of individual leaves in a stand of an annual herb Xanthium canadense [New Phytol] Vol.172 P.104-116 google cross ref
  • 41. Oikawa S, Hikosaka K, Hirose T 2008 Does leaf shedding increase the whole-plant carbon gain despite some nitrogen being lost with shedding? [New Phytol] Vol.178 P.617-624 google cross ref
  • 42. Oikawa S, Hikosaka K, Hirose T, Shiyomi M, Takahashi S, Hori Y 2004 Cost-benefit relationships in fronds emerging at different times in a deciduous fern Pteridium aquilinum [Can J Bot] Vol.82 P.521-527 google cross ref
  • 43. Okaura T, Harada K 2002 Phylogeographical structure revealed by chloroplast DNA variation in Japanese Beech (Fagus crenata Blume) [Heredity] Vol.88 P.322-329 google cross ref
  • 44. Reich P.B, Uhl C, Walters M.B, Ellsworth D.S 1991 Leaf life-span as a determinant of leaf structure and function among 23 Amazonian tree species [Oecologia] Vol.86 P.16-24 google cross ref
  • 45. Reich P.B, Walters M.B, Walters D.S 1997 From tropics to tundra: global convergence in plant functioning [Proc Natl Acad Sci U S A] Vol.94 P.13730-13734 google cross ref
  • 46. Reich P.B, Uhl C, Walters M.B, Prugh L, Ellsworth D.S 2004 Leaf demography and phenology in Amazonian rain forest: a census of 40 000 leaves of 23 tree species [Ecol Monogr] Vol.74 P.3-23 google cross ref
  • 47. Reich P.B, Ellsworth D.S, Walters M.B, Vose J.M, Gresham C, Volin J.C, Bowman W.D 1999 Generality of leaf trait relationships: a test across six biomes [Ecology] Vol.80 P.1955-1969 google cross ref
  • 48. Reich P.B, Falster D.S, Ellsworth D.S, Wright I.J, Westoby M, Oleksyn J, Lee T.D 2009 Controls on declining carbon balance with leaf age among 10 woody species in Australian woodland: do leaves have zero daily net carbon balances when they die? [New Phytol] Vol.183 P.153-166 google cross ref
  • 49. Saigusa N, Yamamoto S, Hirata R, Ohtani Y, Ide R, Asanuma J, Gamo M 2008 Temporal and spatial variations in the seasonal patterns of CO2 flux in boreal temperate and tropical forests in East Asia [Agric For Meteorol] Vol.148 P.700-713 google cross ref
  • 50. Saura-Mas S, Shipley B, Lloret F 2009 Relationship between post-fire regeneration and leaf economics spectrum in Mediterranean woody species [Funct Ecol] Vol.23 P.103-110 google cross ref
  • 51. Sellers P.J, Berry J.A, Collatz G.J, Field C.B, Hall F.G 1992 Canopy reflectance photosynthesis and transpiration: III A reanalysis using improved leaf models and a new canopy integration scheme [Remote Sens Environ] Vol.42 P.187-216 google cross ref
  • 52. Suarez N 2010 Leaf lifetime photosynthetic rate and leaf demography in whole plants of Ipomoea pes-caprae growing with a low supply of calcium a 'non-mobile' nutrient [J Exp Bot] Vol.61 P.843-855 google cross ref
  • 53. Suwa R, Khan M.N.I, Hagihara A 2006 Canopy photosynthesis canopy respiration and surplus production in a subtropical mangrove Kandelia candel forest Okinawa Island Japan [Mar Ecol Prog Ser] Vol.320 P.131-139 google cross ref
  • 54. Tadaki Y, Fujimori T, Whitehead D 1986 Productivity of forests in Japan;Crown and Canopy Structure in Relation to Productivity P.7-25 google
  • 55. Tadaki Y, Nakagoshi N, Golley F.B 1991 Productivity of coniferous forests in Japan;Coniferous Forest Ecology from an International Perspective P.109-119 google
  • 56. Takada T, Kikuzawa K, Fujita N 2006 A mathematical analysis of leaf longevity of trees under seasonally varying temperatures based on a cost-benefit model [Evol Ecol Res] Vol.8 P.605-615 google
  • 57. Thornley J.H.M 2002 Instantaneous canopy photosynthesis: analytical expressions for sun and shade leaves based on exponential light decay down the canopy and an acclimated non-rectangular hyperbola for leaf photosynthesis [Ann Bot] Vol.89 P.451-458 google cross ref
  • 58. Vincent G 2006 Leaf life span plasticity in tropical seedlings grown under contrasting light regimes [Ann Bot] Vol.97 P.245-255 google cross ref
  • 59. Wright I.J, Reich P.B, Westoby M, Ackerly D.D, Baruch Z, Bongers F, Cavender-Bares J, Chapin T 2004 The worldwide leaf economics spectrum [Nature] Vol.428 P.821-827 google cross ref
  • 60. Yamasaki M, Kikuzawa K 2003 Temporal and spatial variations in leaf herbivory within a canopy of Fagus crenata [Oecologia] Vol.137 P.226-232 google cross ref
이미지 / 테이블
  • [ Table 1. ]  List of the parameters
    List of the parameters
  • [ Fig. 1. ]  Vertical distribution of the monitored leaves within the canopy. Each closed circle indicates one monitored leaf (N = 16). The broken line depicts the vertical distribution of all the leaves in the canopy (estimated by spot-measurements using a vertical measuring pole at 25 places within the stand, N = 235 leaves). The vertical axis shows the relative position (i.e. cumulative leaf numbers of each kind of the leaves from top to that height, divided by the total number of leaves of that type. The circles were distributed along the broken line. This indicates that each monitored leaf (e.g. the middle leaf among the monitored leaf) exists at a similar height as that of the middle leaf throughout the entire canopy.
    Vertical distribution of the monitored leaves within the canopy. Each closed circle indicates one monitored leaf (N = 16). The broken line depicts the vertical distribution of all the leaves in the canopy (estimated by spot-measurements using a vertical measuring pole at 25 places within the stand, N = 235 leaves). The vertical axis shows the relative position (i.e. cumulative leaf numbers of each kind of the leaves from top to that height, divided by the total number of leaves of that type. The circles were distributed along the broken line. This indicates that each monitored leaf (e.g. the middle leaf among the monitored leaf) exists at a similar height as that of the middle leaf throughout the entire canopy.
  • [ Table 2. ]  The estimated parameters in 2007
    The estimated parameters in 2007
  • [ Fig. 2. ]  Decline of light-saturated photosynthetic rate. Each panel shows one leaf. Each open circle indicates one measurement. Two representative leaves from the upper and lower canopy are shown. Solid lines show significant linear regressions (P < 0.05).
    Decline of light-saturated photosynthetic rate. Each panel shows one leaf. Each open circle indicates one measurement. Two representative leaves from the upper and lower canopy are shown. Solid lines show significant linear regressions (P < 0.05).
(우)06579 서울시 서초구 반포대로 201(반포동)
Tel. 02-537-6389 | Fax. 02-590-0571 | 문의 : oak2014@korea.kr
Copyright(c) National Library of Korea. All rights reserved.