I recently observed that mature black locust (
Prevailing weather conditions of a region that affect human activities as well as the biota throughout the year include temperature and hydrature (the state of hydration), which are ultimately affected by solar radiation. Temperature and soil moisture conditions affect the growth of trees and herbaceous plants regionally as well as globally (Kim 1988, Kim and Kim 2000, Kimmins 2004). In order to understand the effects of soil moisture content on tree growth in the past, we need information about soil moisture content on a daily basis rather than a monthly basis. Precipitation, however, is only an indirect indicator of soil moisture content. Consequently, a sound and dynamic understanding of soil moisture content is the main prerequisite for successful evaluation of the effects of weather or climate on tree growth in the past, where the balance of soil moisture content is affected by a combination of factors such as the storage, interception, evaporation, transpiration, streamflow, and deep seepage of water in an ecosystem. While the Palmer Drought Severity Index (PDSI) and Standardized Precipitation Index (SPI) are used as the indicators of drought in Korea and around the world (Min et al. 2003), they are evaluated on a monthly basis. Therefore, the resolution of studies using these indices as indicators of drought are quite low because it is difficult to understand day-to-day soil moisture dynamics using these measures as drought indicators.
Federer and Lash (1978) and Federer (1980) developed a hydrologic model, BROOK, that simulates daily soil moisture content and evapotranspiration (a collective term describing evaporation added to transpiration) as well as streamflow in a northern hardwood forest, the Hubbard Brook Experimental Forest, New Hampshire, USA, a unique ecological research station where extensive studies of the structure, function, and development of the ecosystem have been carried out (Likens et al. 1977, Bormann and Likens 1979). The hydrologic simulation model was well validated not only at the Hubbard Brook forest but also in several other forests around the world (Federer 1992). I used the BROOK model to simulate soil moisture content in the Seoul area using daily weather data collected at the Surface Synoptic Station in Seoul from October 1907 to January 1993 (Kim 1993). I also used daily temperature and precipitation data as inputs to simulate daily soil moisture content on Mt. Hallasan National Park, Chejudo Island, Korea (Kim and Kim 2000), which made it possible to simultaneously analyze the dynamics of the climatic factors on a daily basis.
The Surface Synoptic Station in Seoul began its monitoring weather in October 1907. From September 1950 to November 1953, monitoring was interrupted as a result of the Korean War. However, aside from this interruption, the station has collected daily weather data in Seoul almost for a century. More extensive data with soil moisture simulations would be helpful in allowing researchers to infer the dynamics of daily soil moisture content in the Seoul area, which may shed light on the factors leading to the decline of black locust trees around the country. The BROOK model makes it possible not only to estimate current soil moisture contents in forests on a daily basis but also to reconstruct soil moisture content in the past and to reconstruct past drought events in the area.
The main objectives of this study were to simulate and analyze the dynamics of soil moisture content in Seoul, Korea on a daily basis, to reconstruct drought events for the last 98 years, and to better understand the effects of soil moisture content regimes on tree growth. I used statistical analyses of variables related to soil moisture to determine the significance of changes during the study period.
>
Components and Flow Pathways of the BROOK Model
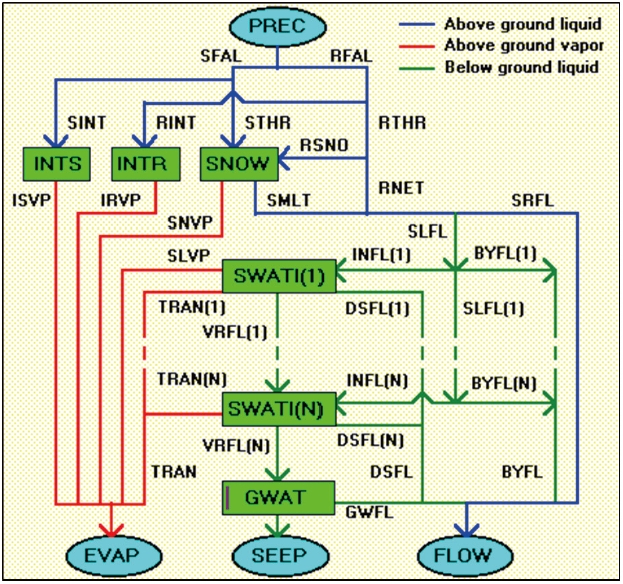
Daily soil moisture content was simulated by applying mean daily temperature and daily precipitation data to the hydrologic simulation model, BROOK. Fig. 1 shows the properties and flow pathways for the hydrological model, BROOK (Federer 1980, 1992).
Soil moisture content was determined by the water balance between the input of precipitation (PREC) and the outputs of evapotranspiration (EVAP: evaporation plus transpiration), streamflow (FLOW), and seepage under the soil layers (SEEP) in forest ecosystems. Rainfall and snowfall are the components of precipitation. There are three flows of water in forest ecosystems: flows of above-ground liquid, flows of above-ground vapor, and flows of below-ground liquid. Flows of aboveground liquid consist of rainfall (RFAL), intercepted rain (RINT), net throughfall (RNET), rain into snow (RSNO), throughfall from rain (RTHR), snowfall (SFAL), intercepted snow (SINT), snowmelt (SMLT), streamflow via impaction on a variable saturated source area (SRFL), and throughfall from snow (STHR). Flows of aboveground vapor consist of evaporation of intercepted rain (IRVP), evaporation of intercepted snow (ISVP), soil evaporation from the top soil layer (SLVP), evaporation from snow (SNVP), and transpiration from each soil layer that contains roots (TRAN). Flows of below-ground liquid consist of streamflow via vertical macropore flow followed by downslope pipe flow (BYFL), the downslope flow component simulated (DSFL), the groundwater component of streamflow (GWFL), infiltration into the soil matrix of the surface horizon (INFL), liquid flowing in below ground (SLFL), and infiltration directly to deeper horizons via vertical macropore flow (VRFL). The BROOK model mainly aims at simulating streamflow and there are five important internal components of water: groundwater (GWAT), intercepted rain (INTR), intercepted snow (INTS), water in snow (SNOW), and water in the soil matrix (SWAT). Among these internal components, water in the soil matrix (SWAT) is the main component simulated in the model and used for further analysis in this study. For more specifics of the mechanisms of the model BROOK and the flow chart, see Federer (1980, 1992) and Federer and Lash (1982).
Daily climate data initially collected at the Central Meteorological Station in Seoul, located at Woonnidong, Chongno-gu, Seoul, Korea, from 1 October 1907 to 18 January 1933 and those subsequently collected at the current Surface Synoptic Meteorological Station, located at 1 Songwol-dong, Chongno-gu, Seoul, Korea, from January 1933 to the present were used as inputs. Although there are Automatic Weather Stations (AWS) in Seoul, they first initiated weather monitoring in 1988. As the station is the only meteorological station in Seoul that has long-term records of climate representing the Seoul area, the climatic data from this station have been used to represent Seoul, Korea in many studies (Min et al. 2003, Choi Y 2004, Ha and Ha 2006). The Korean War interrupted continuous monitoring of weather data from 1 September 1950 to 30 November 1953. Geographic information about the Surface Synoptic Station is summarized in Table 1.
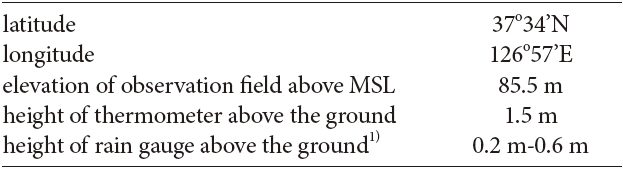
Information about the location of the Surface Synoptic Station in Seoul (Korea Meteorological Administration, 2008)
As very severe droughts occurred in 1988 in Korea (Min et al. 2003, Lee 2006), the specifics of the weather patterns in 1988 were plotted with the trend of daily means of weather factors including temperature and precipitation for the sake of comparison.
>
Simulated Soil Moisture Content
With the inputs of daily climatic data, I simulated soil moisture on a daily basis for the last 98 years using the BROOK model, assuming a forest with evapotranspiration and soil with a depth of 600 mm. At Hubbard Brook Experimental Forest in New Hampshire, USA, the vegetation is covered with northern hardwoods, such as white ash (
>
Calculation of Soil Moisture Deficits and Reconstruction and Evaluation of Drought Events
A soil moisture deficit is defined as the deviation of current soil moisture content from saturated soil moisture content (Federer 1980, Kim 1988). The BROOK model assumes a moisture content of 175.5 mm at the field capacity and 55 mm at the wilting point in soil with a depth of 600 mm. With this soil moisture content, the water potentials at the field capacity and wilting points are -0.06 bar and -15 bar, respectively. A soil moisture deficit >;60 mm indicated the occurrence of an agricultural drought at the Hubbard Brook Experimental Forest in New Hampshire, USA (Federer 1980). I calculated the soil moisture deficit on a daily basis using the following equation:
soil moisture deficit (mm) = 175.5 - daily soil moisture content, when soil moisture content is <175.5 mm.
I then carried out statistical analyses to examine temporal changes in the mean, minimum, and maximum annual soil moisture deficit.
Throughout this study, I examined the patterns of soil moisture content change over different periods by dividing the study period into three intervals. The first interval included the first 30 years from the initiation of weather monitoring in 1908 to 1937. The second period was from 1938 to 1979, which is somewhat longer than the other two intervals, and included the period with missing data during the Korean War. The third interval included the recent 30 years from 1980 to 2009. Comparisons of climatic patterns in the three interval periods illustrate overall patterns of climate changes over the last century.
I processed the climate data on an IBM-PC compatible personal computer and conducted statistical analyses using the SAS (Statistical Analysis System) package. The data were also processed and plotted using Microsoft Office Excel 2007.
>
Climatic Factors and Explanation of Weather Patterns in 1988
Daily soil moisture content is affected by the balance between daily input from precipitation and the outputs of streamflow, deep seepage, and evapotranspiration. To simulate daily soil moisture content, it is very important to understand the dynamics of temperature and precipitation on a daily basis. I have described the specifics of daily climate dynamics in Seoul elsewhere (Kim 2010).
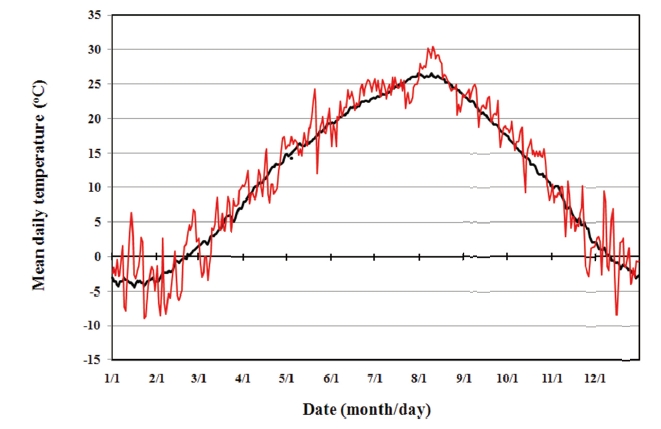
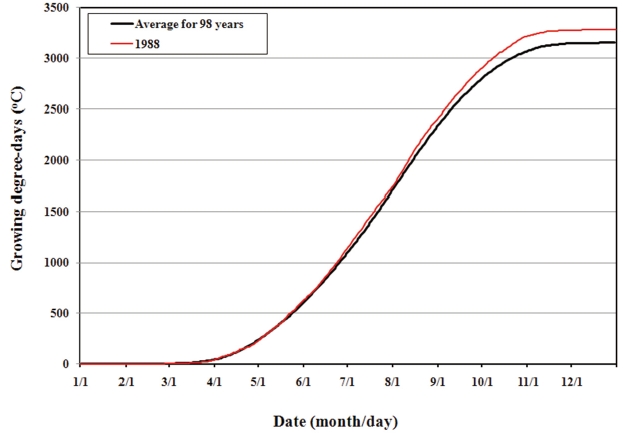
The mean annual temperature in Seoul for the last 98 years is plotted in comparison with mean daily temperatures in 1988, a year when a severe drought occurred, in Fig. 2. In 1988, it was quite warm in early August, late August to mid-October, mid-June to mid- July, and mid- to late January, which meant that it did not rain much during the months leading to the drought in Seoul. The mean annual temperature from 1908 to 2009 was 11.63℃, while that in 1988 was 12.15℃ . The daily growing degree-days (GDD) was also higher than normal in July and continued to be higher than normal in August in 1988 (Fig. 3). Accordingly, the mean growing degreedays from 1908 to 2009 was 3,152.9℃, while that in 1988 was 3,286.6℃. For more specifics of the growing degreedays, see McMaster and Wilhelm (1997) and Kim (2010).
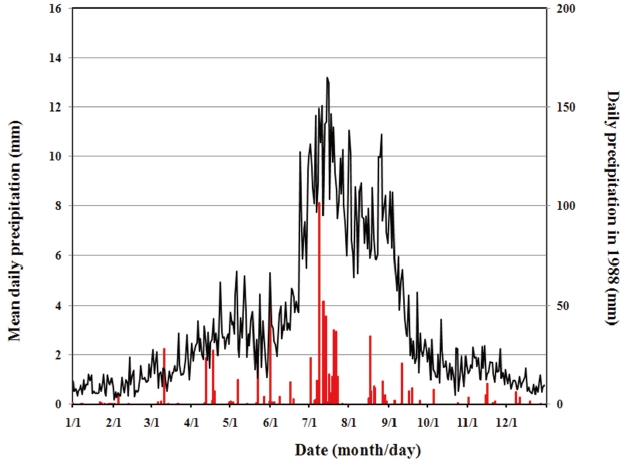
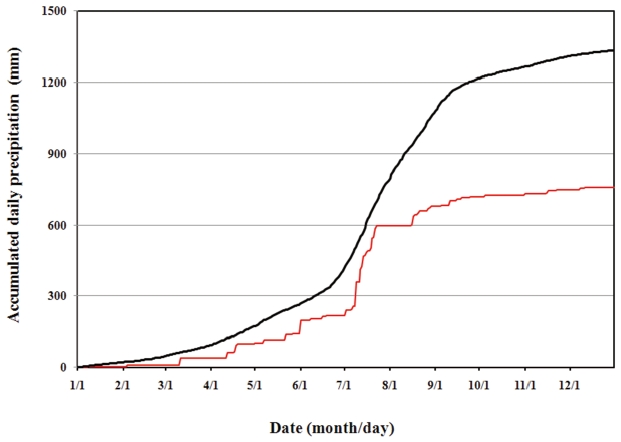
Fig. 4 shows the mean daily precipitation in Seoul over 98 years plotted with daily precipitation in 1988. Over the last century, it generally rained intensively from early to mid-July, and did not usually rain much from late July until the end of the year except for some occasions (Fig. 4). Fig. 5 shows the cumulative mean daily precipitation in Seoul over the last 98 years comparatively plotted with the cumulative daily precipitation in 1988. Mean annual precipitation from 1908 to 2009 was 1,333.1 mm, while the annual precipitation in 1988 was 760.8 mm. Fig. 5 shows that the drought was initiated in late June to early July and that a major drought occurred starting late July, with very dry conditions persisting for the remainder of the year.
>
Simulated Soil Moisture Content
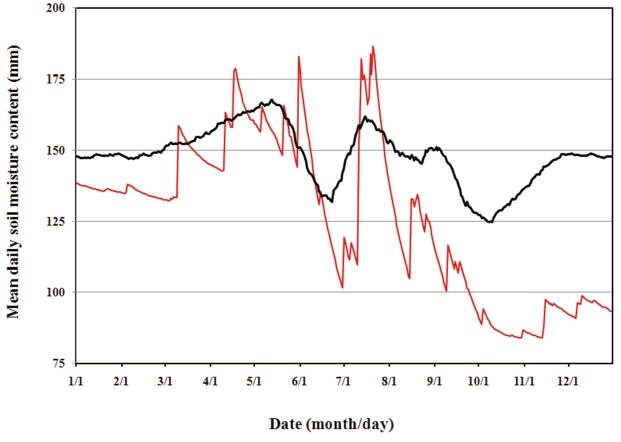
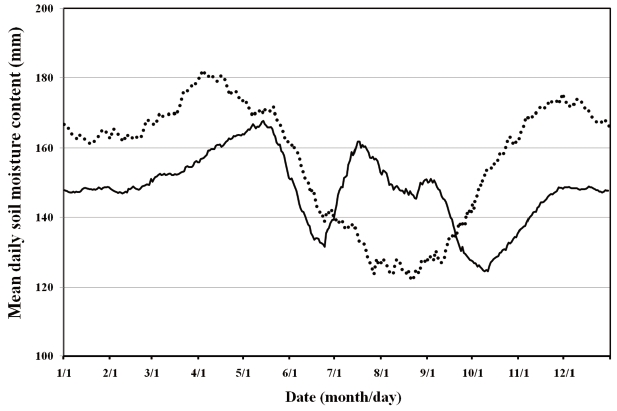
Using daily temperature and precipitation for the 98- year study period, I simulated the daily soil moisture content. Fig. 6 shows the simulated mean daily soil moisture content in Seoul for the period plotted with the mean daily soil moisture content in 1988, when a severe drought occurred. The soil moisture content shows a very different pattern than precipitation and temperature in Seoul (Figs 2,4,and 6). During the winter, soil moisture content did not appear to be low, and the soil moisture content continued to increase until mid-May due to low evapotranspiration and increasing precipitation (Kim 1993). Simulated daily soil moisture content was the highest on 14 May (167.8 mm), and rapidly decreased thereafter until late June, due to a rapid increase in transpiration and a slow increase in precipitation. This period can be called the First Dry Season of the year in the Seoul area. Generally, the soil moisture content in June showed substantial variation (Kim 1993). In this First Dry Season, the lowest daily mean simulated soil moisture content was 131.8 mm on 24 June. The limited soil moisture content resulting from low precipitation and high temperature in June is very likely to result in limited growth of trees in forests and plants in fields in Korea. The mean simulated soil moisture content in Seoul over the last century was 148.2 mm and that in 1988 was 126.6 mm.
When the first heavy rains fell at the onset of the monsoon season, soil moisture content sharply increased. The peak in the simulated daily mean soil moisture content in this period occurred on 16 July (161.8 mm). Soil moisture slowly decreased thereafter until early October with a rapid decrease in precipitation and a slow decrease in evapotranspiration (Kim 1993). In the mean time, due to the large amount of precipitation that accompanies the typhoons that begin in mid- June, another clear increase in soil moisture content was observed, especially in August and September. The dynamic nature of daily soil moisture content observed from the simulation confirms that typhoons are major climatic drivers that sustain vegetation in East Asia. It would be quite interesting to model how the soil moisture dynamics would change if typhoons did not occur in the region.
Soil moisture content statistics for each year, reconstructed drought events, and the severity evaluation of drought during theperiod from 1908 to 2009 in Seoul, Korea

Variables reflecting the soil moisture content for 98 years from 1908 to 2009 (except for the period from 1950 to 1953)
After mid September, the soil moisture content decreased sharply. This period can be called the Second Dry Season of the year, which was estimated to comprise the driest period in a year. Generally, the variability in the soil moisture contents increased in this period, and the lowest daily mean of simulated soil moisture content was observed on 9 October (124.7 mm). Soil moisture content increased slowly from this date on. Although the limited soil moisture content in October could result in low growth of trees in forests as well as plants in fields, the damaging effects of low moisture would be more pronounced for evergreen trees, rather than deciduous trees, which become dormant in this season. I have discussed the relationships between the soil moisture dynamics and vegetation in this region in more depth elsewhere (Kim 1993).
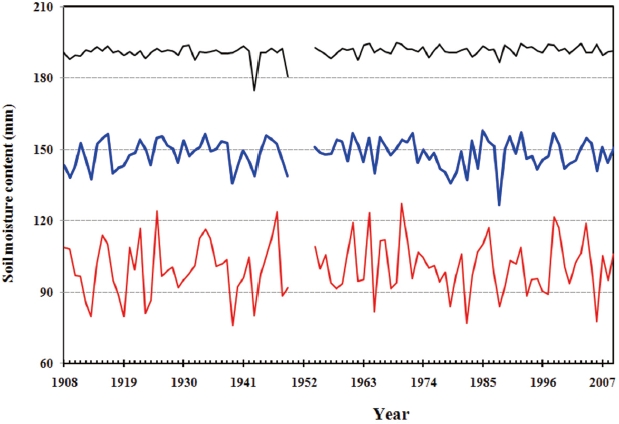
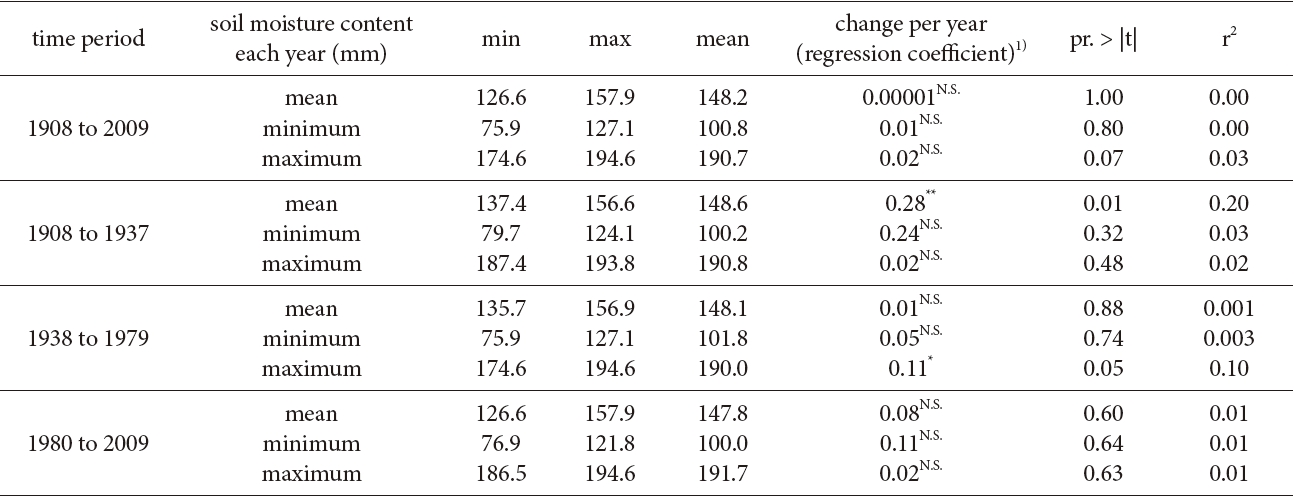
Table 2 shows the mean, minimum, and maximum simulated soil moisture content for each year. The lowest mean annual soil moisture content was observed in 1988 (126.6 mm), the driest year, and the highest mean annual soil moisture content was observed in 1985 (157.9 mm), the wettest year. The mean annual soil moisture content for the period from 1908 to 2009 was plotted as the middle line on Fig. 7, but no statistically significant change was detected during the study period in Seoul (Table 3). The lowest minimum annual soil moisture content was observed in 1939 (75.9 mm) and the highest was recordobserveded in 1970 (127.1 mm). The minimum annual soil moisture content for the period from 1908 to 2009 was plotted as the lowest line on Fig. 7, but again, no statistically significant change was detected during the study period (Table 3). The highest maximum annual soil moisture content was observed in 1969 (194.6 mm) and the lowest was in 1943 (174.6 mm). The maximum annual soil moisture content for the period from 1908 to 2009 was plotted as the upper line of Fig. 7, but no statistically significant change was detected during the study period (Table 3).
The mean soil moisture content in the Seoul area during the three intervals was 148.6 mm from 1908 to 1937, 148.1 mm from 1938 to 1979, and 147.8 mm from 1980 to 2009. The mean annual soil moisture content increased significantly during the period from 1908to 1937 and the maximum daily soil moisture content increased significantly during the period from 1938 to 1979. Statistically, no other variables showed statistically significant changes during the three intervals (Table 3).
>
Soil Moisture Deficits and the Reconstruction of Droughts
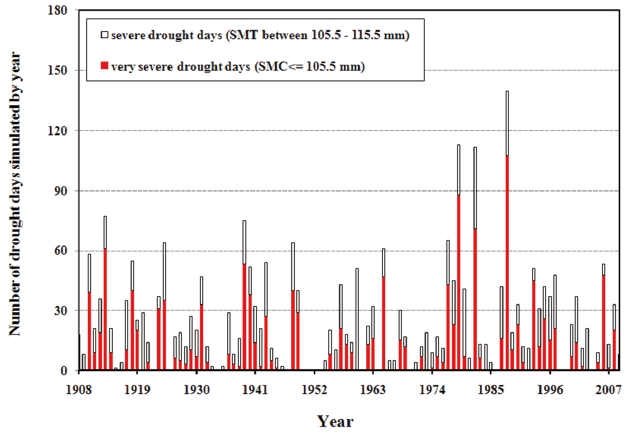
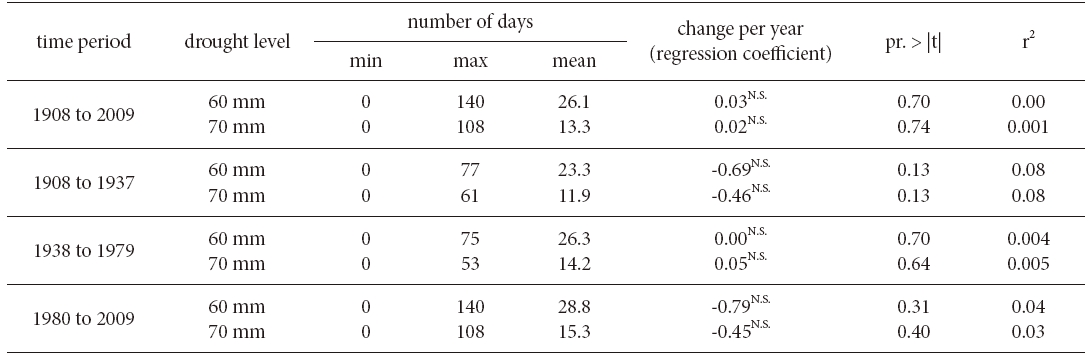
Table 2 and Fig. 8 show the number of days of soil moisture deficit and indicates periods of severe and very severe drought levels with soil moisture deficits >;60 mm and >70 mm, respectively, following Federer (1980). The maximum numbers of days with drought levels greater than 60 mm (140 days) and 70 mm (108 days) both occurred in 1988. No statistically significant changes in the number of days with drought levels greater than 60 mm and 70 mm were detected in Seoul during the study period (Table 4).
Years when the minimum soil moisture content was below the 95% signifi cance level (<89.4 mm) or when the number of days with drought levels lower than 115.5 mm was above the 95% significance level (>51.7 days) were categorized as ‘intermediate’ drought years. Nineteen years were in this category of drought level (Table 2). Of these, the 11 years when the minimum soil moisture content of each year was below 95% significance level (<89.4 mm) and the number of days for drought level lower than 115.5 mm was also above 95% significance level (>51.7 days) were categorized as ‘severe’ drought years. Years when the minimum soil moisture content was below the 99% signifi cance level (<77.9 mm) or when the number of days for drought level lower than 115.5 mm was above the 99% significance level (>77.6 days) were categorized as ‘very severe’ drought years. Five years fell into this category: 1982, 1913, 1979, 1939, and 2006. Finally, years when the minimum soil moisture content was below the 99% signifi cance level (<77.9 mm) and the number of days with drought level lower than 115.5 mm was also above the 99% significance level (> 77.7 days) were categorized as ‘extreme’ drought years. Only one year, 1982, met these standards, but in 1988, the number of days for drought level lower than 115.5 mm was 140 days, which was far above 99.9% signifi cance level (more than 103.7 days), so this year was also classified as an ‘extreme’ drought year.
The mean number of days with a soil moisture deficit >;60 mm in the Seoul area was 23.3 days from 1908 to 1937, 26.3 days from 1938 to 1979, and 28.8 days from 1980 to 2009. No significant temporal changes were detected in the number of days in each year with a soil moisture deficit level >60 mm during the three intervals (Table 4).
Daily simulated soil moisture content is only an indirect indicator of soil moisture content in an area, because the exact soil moisture content of a site depends on vegetation types, soil properties, topography, etc. However, the information derived from the simulations can be used to interpret general trends in daily and annual variations of soil moisture content in the area. I examined day-to-day fluctuations in soil moisture content in Seoul, Korea by simulating daily soil moisture content from 1908 to 2009. Although fluctuations in soil moisture content are highly dependent on precipitation, the patterns of changes in daily soil moisture content were quite different from those of precipitation. There were several phases in the dynamics of daily soil moisture content, and the patterns of mean daily soil moisture content in Seoul showed clear differences from those at Hubbard Brook Experimental Forest, New Hampshire, USA (Fig. 9) (Kim 1988, 1993, Kim and Kim 2000).

Analyses of changes in the number of drought days simulated for 98 years from 1908 to 2009
There were no statistically significant changes in mean annual soil moisture content across the last 98 years in Seoul, Korea. By simulating daily soil moisture, I was able to reconstruct drought phenomena and to estimate the severity and duration of droughts in the Seoul area. I categorized droughts in the years of 1988, 1982, 1913, 1979, 1939, and 2006 as severe. As I discussed in the Introduction of this paper, sharp decreases in the radial increment of mature black locust trees occurred in 1978, 1988, and 1994, when stresses including drought seem to have shocked the trees, leading to their ultimate decline (Kim et al. 2009). The intensity of the droughts in 1988, 1993, and 1978 were estimated to be severe to extreme (Min et al. 2003, Lee 2006), a conclusion which was confirmed by the results of this study. Statistical analyses also indicated that there were no statistically significant changes in the number of drought days over the last 98 years in Seoul, Korea.
This study illustrates potential uses of the hydrological simulation model, BROOK: the simulation of soil moisture contents on daily basis and the simultaneous evaluation of soil moisture deficits on daily basis. This type of simulation provides us with the potential to interpret natural phenomenon that occurred in the past, including the dynamics of growth and decline of trees, and to predict changes in the dynamics of natural phenomena related to soil moisture content and droughts in the future. However, further studies are needed to clarify the relationships between soil moisture content and drought-related variables and natural phenomena including tree growth fluctuation and decline. The information has the potential to be useful not only in understanding the ecology and hydrology of ecosystem processes but also for the sustainable management of natural ecosystems, agro-ecosystems, and other manmade ecosystems.