The Eyjafjallajokull volcano in Iceland recently erupted causing immense disruption in air traffic all over Europe and injecting ash, dust, and gases into the atmosphere. Sulfur dioxide (SO2) in particular, is one of the major volcanic trace gases, causes acid rain and is a key precursor for sulfuric acid aerosol formation. The sulfuric aerosols may be present in the stratosphere for weeks and can be transported to other continents. SO2 is also known to have adverse effects on human health.
Volcanic eruptions are known to be a major source of reactive halogen species, which are associated with the destruction of O3 in the vicinity of volcanic areas. Volcanic emission contains reactive halogen species such as HCl and HF. BrO is also one of the major volcanic halogen species observed in recent studies. BrO was observed in a volcanic plume at the Soufriere Hills volcano on Monstserrat in May 2002 [1]. BrO has also been observed at other volcanoes where the measurements were carried out 1 km from the emission source.
Accurate measurement of volcanic gas emission is important since these gases affect atmospheric chemistry in the vicinity of a volcano. Remote sensing techniques have recently been preferred for volcanic gas measurements, given the inaccessibility of volcanic craters. A variety of volcanic gases such as BrO [1-2] and ClO [2] have been investigated with the Multi Axis (MAX)-Differential Optical Absorption Spectroscopy (DOAS) technique. SO2 and BrO abundances as a function of the distance from the source were studied by ground-based scattered light MAX-DOAS in Mt. Etna, Italy [3]. Additionally, BrO to SO2 ratios for various volcanic sites were investigated by the same study [4]. While the MAX-DOAS measurement obtains the vertical distribution of trace gases, the passive imaging spectrograph [5-6], which uses a two-dimensional array detector, allows one to retrieve two-dimensional spatial distribution measurements of atmospheric trace gases [7-9]. However, there have been few studies [3] that demonstrated the capability of the passive imaging spectrograph technique to retrieve 2-D distributions of SO2, while most previous studies focused on NO2 distributions at various measurement sites [7-9]. Therefore, uncertainties remain regarding the capability of the retrieval of 2D distributions of SO2 using the imaging spectrograph technique at other SO2 and BrO absorption wavelengths. In addition, a previous study [3] discussed the need for further validation using different absorption wavelengths (e.g., 312.1 to 321.5 nm and 316.3 to 327.5 nm used for SO2 and BrO retrieval, respectively, in the present study) in investigating the capability of the imaging spectrograph system for the retrieval of 2D distributions of SO2 and BrO. This present work is part of a wider effort to gather information on the vertical and horizontal distribution of SO2 and halogen gases around the crater of Sakurajima volcano in Japan using remote sensing techniques. This study presents two-dimensional distributions of SO2 and BrO around the top of the Sakurajima volcano in Japan.
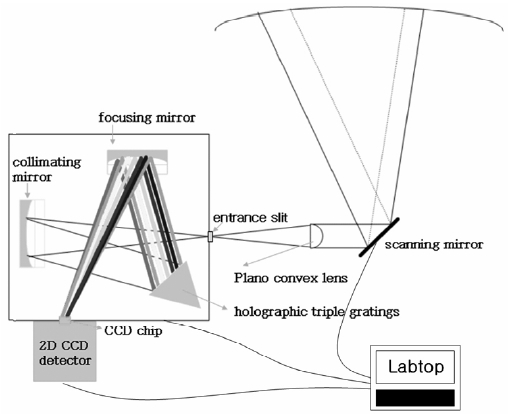
Fig. 1 shows the passive scanning imaging spectrograph system developed by Gwangju Institute of Science and Technology (GIST). The system uses scattered sunlight as a light source. The system contains an imaging spectrometer coupled with a two-dimensional CCD detector for recording scattered sunlight intensity as a function of wavelength. The scattered sunlight at each azimuth angle can be measured by the system equipped with a horizontally moving mirror.
The system consists of the light collecting component, a spectrometer, a 2-D CCD detector, and a system controller. The light collecting component is composed of a moving mirror and a quartz lens (plano convex: f = 100 mm, = 25.4 mm). The mirror, combined with a stepper motor, is used to aim and scan the area of interest and reflects scattered sunlight, which has transferred through the target area, onto the lens. The incoming light is focused on to the entrance aperture of the spectrometer (Triax 180; Czerny Turner type, F/# 3.9, Horiba Jobin Yvon Inc., Edison, USA). The flat holographic grating (1200 grooves mm-1; blazed at 330 nm) in the spectrometer disperses the light which is then focused onto a two-dimensional CCD chip (26.6 × 6.9 mm in size corresponding to 2048 × 512 pixels) on a detector head. The 512 CCD rows were binned in groups of 8, yielding 64 rows for the spatial distribution in order to minimize the cross-talk effect between vertical pixels that might be caused by the finite point spread function. The horizontal 2048 pixels are served as a spectral dispersion axis while 64 vertical pixels represent the spatial distribution. The slit functions of full width half maximum (FWHM) were 0.3 and 0.6 nm at the center and the edge of the focal plane respectively as the alignment of the 2-D CCD detector was optimized for both the center wavelength and the center row.
LabVIEW software was utilized to control the scanning mirror directions and the CCD shutter. To reduce temperature changes that might have led to variations in instrumental function during field measurements (e.g., spectral resolution and wavelength range), nine Peltier elements (40 × 40 × 4 mm) were attached to the base plate of the system spectrograph. The temperature inside the instrument was kept at 5℃; less than ± 0.1℃ variation in temperature was recorded during the measurement period. The spectrograph was thermally isolated from the entrance optics by inserting a quartz focusing lens between the entrance optics and one side of the foil-covered aluminum box that contained the spectrograph and scanning mirror; this ensured that the air temperature in the box could be controlled. The CCD chip was cooled down to ?70℃ to minimize the dark current in the CCD detector.
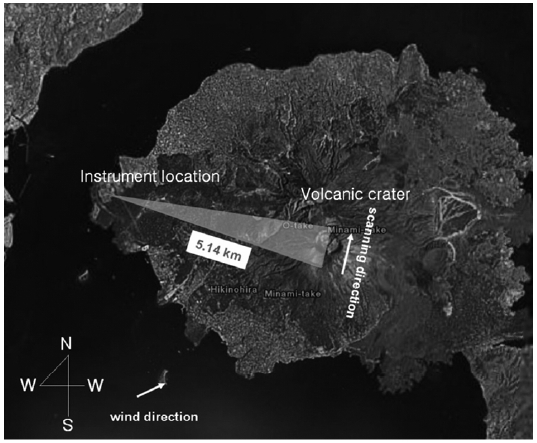
The field measurement site and its surrounding area are described in Fig. 2. The system was installed on the rooftop of a disaster prevention facility at a distance of 5.14 km east (31.34° N, 130.39° E) of the Sakurajima volcano crater in Japan. None of the major anthropogenic SO<;sub>;2<;/sub>; sources were present on the line of instrumental sight between the system and the target crater. The measurements were conducted from October 17 to November 2, 2005. However, this study focuses on the results obtained from 11:20 a.m. until 11:30 a.m. local time on November 2 as this time was marked by a clear sky. The time taken for the acquisition of a complete image was 3 min during the measurement period. During the measurement period the wind was moderate, blowing from the southwest at 2.8 m s-1. The ambient temperature was 16℃. The moving mirror was directed to the center of the crater, and sequentially scanned the crater area from southeast to northwest (Fig. 2).
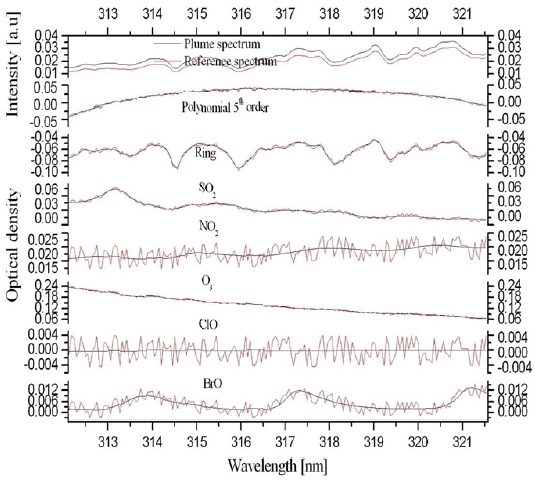
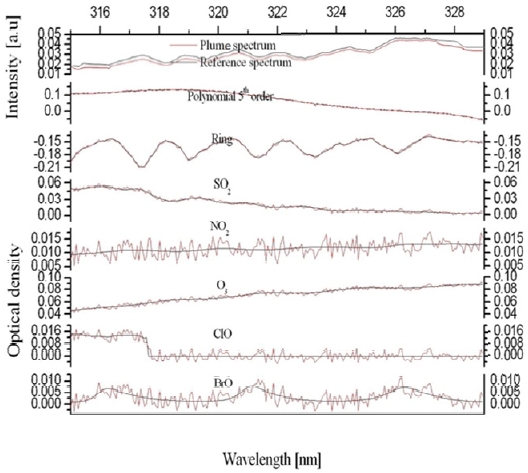
The collected scattered sunlight signals were analyzed using WinDOAS software, which is based on the DOAS technique [10]. The dark current and offset signals of the spectrograph were removed from each of the measured spectra using the spectra taken with the same measurement parameters under the condition of no light entering the instrument entrance slit. Given the wind direction, the spectra taken on the rightmost column on the area of interest was used as a Fraunhofer reference spectrum (FRS). The contributions of background SO2 and BrO, including both stratospheric and tropospheric signals, were eliminated by dividing the measured spectra by the FRS on the same row in the CCD chip. Mapping wavelength information onto the CCD pixels was done by the optical density fitting of the convoluted FRS to a hyper-spectral Fraunhofer spectrum reference [11]. Ring spectra were calculated from the individual FRS using DOASIS software in order to account for the Ring effect [12], which denotes the fillingin of Fraunhofer lines. The retrieved quantities from scanning imaging spectrograph measurements are expressed as slant column density (SCD).
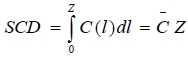
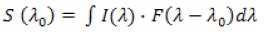
Where C and 1 denotes a concentration of a species and the average concentration over an absorption light path length (Z) between the instrument and a location where the instrument can detect. Absorption cross sections of gases are usually convoluted with an instrumental slit function in order to account for the spectral resolution of the measured spectrum. The convolution of a spectrum
Where
Where
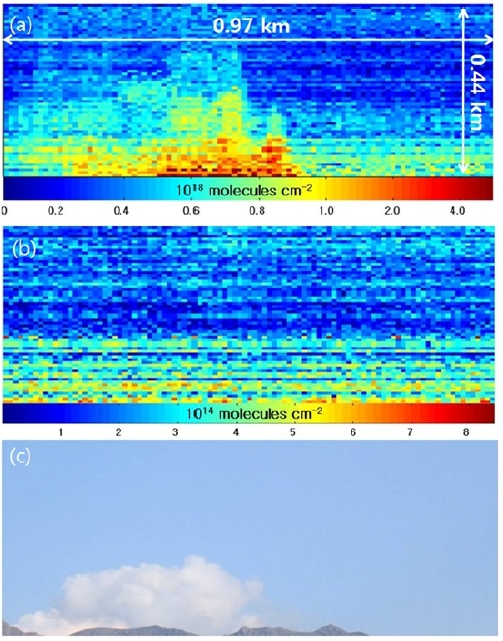
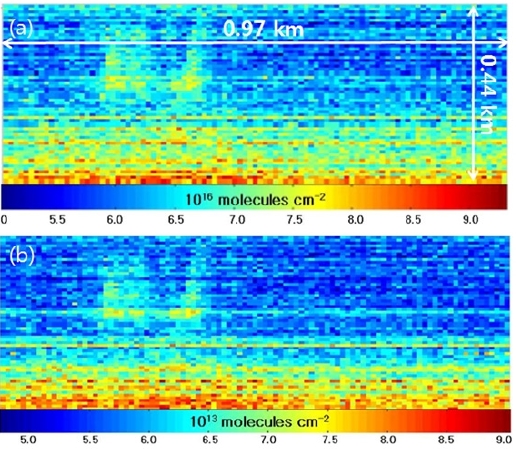
The two-dimensional distributions of the SO2 and BrO SCDs simultaneously measured by the scanning imaging spectrograph system are presented in Fig. 5(a) and 5(b), respectively. The photograph taken from the instrument site is shown in Fig. 5(c). Each of the images in Fig. 5(a) and 5b comprises 100 columns along the azimuth angle, which were sequentially scanned by the moving mirror and 64 rows along the elevation angle, which corresponds to the number of the vertical pixels of the CCD chip. The scanned area was 0.44 km (vertically) × 0.97 km (horizontally). A single pixel in Fig. 5(a) and 5(b) corresponds to an area of 6.8 m (vertically) × 9.7 m (horizontally) at the crater location. The SO2 SCDs range from 1017 molecules cm-2 to 4.5 × 10¹⁸ molecules cm-2 in Fig. 5(a), the fit errors of which correspond to 9.0 × 10¹⁵ molecules cm-2 and 9.7 × 10¹⁶ molecules cm-2 in Fig. 6(a). High SO2 SCD values were found at the crater while SO2 SCDs decreased with distance from the crater as the evolution of SO2 concentration is dominated by dilution with background air. The BrO SCDs range from 9.5 × 10¹³ molecules cm-2 to 8.4 × 10¹⁴ molecules cm-2 in Fig. 5(b), the fit errors of which correspond to 4.8 × 10¹³ molecules cm-2 and 9.1 × 10¹³ molecules cm-2, respectively in Fig. 6(b). Fig. 5(b) shows the decrease of BrO SCDs as a function of vertical distance from the lowest row to the uppermost row. The vertical characteristics of the BrO SCD distribution implies BrO emitted from the volcanic crater was not detected by the instrument since the observed BrO SCD values increase as a function of elevation angle due to increased absorption light path lengths within a BrO layer. The BrO SCD measured during the campaign seems to represent their background level, which originates from the potential BrO sources at the measurement site such as the surrounding sea and preexisting volcanic plumes.

Sakurajima volcanic plume measurement parameters used by the scanning imaging spectrograph system
Spatially resolved SO2 and BrO SCDs were retrieved from the spectra measured by a series of high spatial resolution vertical scans using an imaging spectrograph with a scanning device at the Sakurajima volcano, Japan. An image that shows the 2-D distribution of SO2 emitted from the Sakurajima volcanic crater was obtained at a distance of 5 km from the source location. SO2 SCD values up to 4.5 × 10¹⁸ molecules cm-2 were observed close to the top of the crater while the SCD values decreased with distance from the crater due to dilution with background air. However, background BrO SCD levels were measured only up to 8.4 × 10¹⁴ molecules cm-2 during the measurement period. Though SCD information is useful to monitor atmospheric trace gases at a remote location where in-situ instruments can hardly reach, the absorption light path length information is required to convert SCD into volume concentration. Applications of chemical plume models or development of absorption light path length detecting devices will be needed for the quantitative investigation on the chemical evolution and transportation of trace gas species at their source sites.