Reservoirs in Japan, including many lakes, suffer from various environmental problems caused by eutrophication, such as algal blooms and mold odor. To preserve water quality in closed water areas, in 1984 the Japanese Government enacted a Law entitled Special Measures for Conservation of Lake Water Quality, and this law came into force in 1985. Lake Biwa, located in Shiga Prefecture, has a serious eutrophication problem, which is assumed to be caused by increased nutrient input. The main source of these nutrients is sewage discharge. Shiga Prefecture initiated the control of nitrogen and phosphorus effluents in both domestic and industrial wastewater. Additionally, it rapidly improved domestic wastewater treatment, and the maintenance rate of the wastewater treatment facility reached 94.3%. At the same time, the maintenance rate of the sewage treatment facility was 80.3% as of March 2006. Despite these countermeasures, the water quality of Lake Biwa has not improved: a water bloom has occurred every year and the Chemical Oxygen Demand (COD) concentration has been increasing for several decades[1]. The problems observed in Lake Biwa are also seen in other lakes in Japan. Despite the introduction of a legal framework for water conservation, the water quality has not improved, according to a policy appraisal report published by the Ministry of Internal Affairs and Communications[2].
The COD concentration is an index of the amount of organic matter in water. Organic matter is produced within Lake Biwa, as well as being supplied by inflows from a river. The organic matter produced in the lake consists mainly of microorganisms, such as phytoplankton. It is important to reduce nitrogen and phosphorus inflows into the lake to prevent this internal production.
According to the Ministry of Environment, a major issue with regard to water conservation in the lake is finding a way to obtain scientific clarification of the mechanisms of the total pollution, including the inflow load, elution and internal production[3]. There have been many studies on elution concentrations and elution rates of nutrient salts from sediment[4, 5], but it is hard to explain the cause of the actual water quality change because the phenomenon can only be understood via a batch test under steady-state conditions, or via a field survey under complex events.
The aim of our study was to understand the elution behavior of nutrient salts in a closed water area. In this paper, the impact of nutrient salts on the water environment is discussed by describing a simulation undertaken at our experimental facility.
The study was conducted at Lake Biwa - Yodo River Water Quality Purification Joint Experimental Center, located on the eastern shore of southern Lake Biwa.
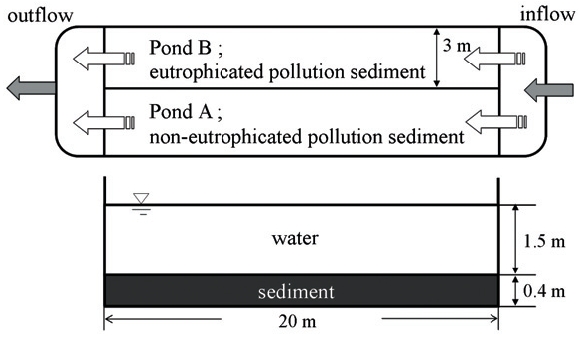
Two ponds (3 m(W)×20 m(L)×2 m(D) ) were used, to which sediment was added to a thickness of 40 cm. Sand was added to one pond (Pond A) to a thickness of 5 cm above the sediment, and the other pond (Pond B) contained only eutrophicated pollution sediment dredged from Lake Biwa. River water was pumped into both ponds. The water depth was 1.5 m, with a detention time of 1 week (0.15 L/sec).
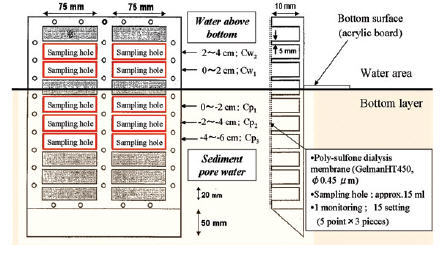
Fig. 1 shows the schematic configuration of the experimental facility, and Table 1 shows the chemical constituents of the sediments used in this experiment.
[Table 1.] Chemical constituents of the sediments

Chemical constituents of the sediments
[Table 2.] Outline of the monitoring
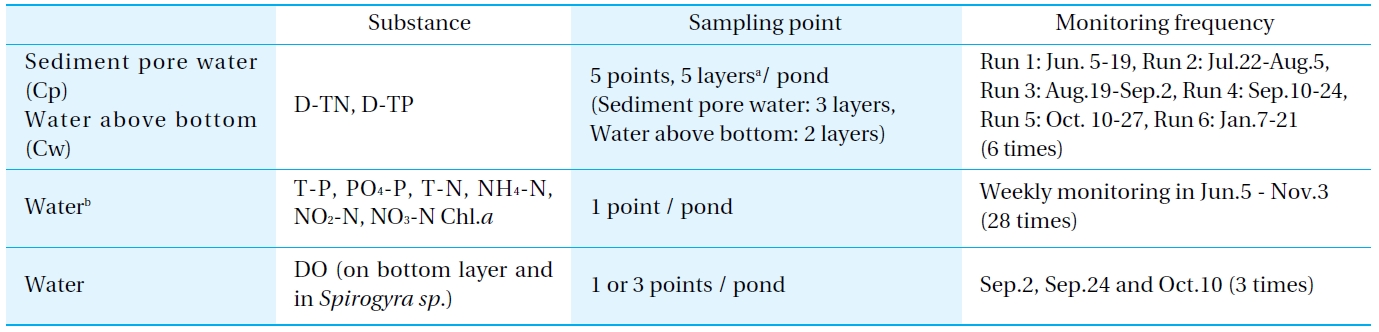
Outline of the monitoring
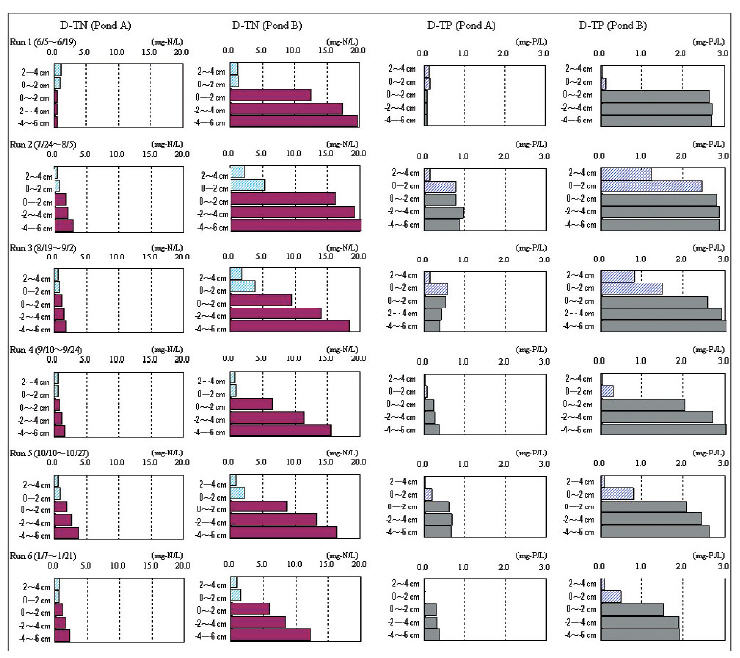
To investigate the concentration of the elution from the sediment, the Dissolved Total Nitrogen (D-TN) and Dissolved Total Phosphorus (D-TP) concentrations of the nutrient salts were monitored at each of 5 layers above and below the bottom surface. The sediment pore water and water above the bottom were sampled using a dialyzer sampler (peeper). The peeper consisted of an acrylic board and a membrane holder, and is a dialysis sampler with 5-compartments positioned vertically at 2 cm intervals (Water above the bottom: 0-2 cm above is Cw1, 2-4 cm is Cw2, Sediment pore water: below the top 0-(-2) cm is Cp1, -2-(-4) cm is Cp2, -4-(-6) cm is Cp3) (Fig. 2).
The peepers were placed at 5 points in each pond, and then left for 2 weeks to allow the chambers to equilibrate with the sediment pore water[6-8]. There were 6 experimental runs (Run 1: Jun.5-19, Run 2: Jul.22-Aug.5, Run 3: Aug.19-Sep.2, Run 4: Sep.10-24, Run 5: Oct.10-27 and Run 6: Jan. 7-21).
The water quality and phytoplankton 50 cm below the water surface (85 cm above the bottom surface) were monitored. Moreover, the disolved oxygen (DO) concentration was investigated above the bottom surface because green algae were prolific during the summer.
The monitoring procedure is outlined in Table 2.
3.1. Elution Analysis of Nutrient Salts from Sediment Using Dialyzer Sampler
The average water temperatures during the investigation period were Run 1: 22.8℃, Run 2: 26.6℃, Run 3: 29.1℃, Run 4: 24.2℃, Run 5: 17.5℃ and Run 6: 5.6℃. During the investigation period, the Oxidation-Reduction Potential (ORP) of the sediment in Ponds A and B exhibited oxidizing and reducing conditions, respectively.
Fig. 3 shows the changes in the D-TN and D-TP concentrations in the sediment pore water (Cpx) and the water above the bottom (Cwx). The D-TN and D-TP in Ponds A and B are indicated starting from the left. In Pond A, the D-TN and D-TP concentrations of Cpx and Cwx in Run 1 were low when the investigation started. The range of the D-TN concentrations of Cpx in Pond A was relatively constant and low during the investigation period. Therefore, the elution of the sediment was only slightly affected in Pond A. In Pond B, the ratio of the average concentrations of Cpx to Cwx in Run 1 was 13:1 for D-TN and 35:1 for D-TP. This shows that the sediment pore water of the eutrophicated sediment contains a large amount of nutrient salts.
In Runs 2 and 3 during the summer, the nutrient salt concentrations of Cw1 and Cw2 in Pond B were higher than in Pond A. It is clear that the elution of the sediment affected the water above the bottom; the amount of phosphorus was also large. In particular Cw1 in Pond B in Run 2 had the highest D-TP concentration at 2.5 mg-P/L. Thus, it is suggested that sediment containing a large amount of nutrients, such as Pond B, causes the large elution rate of nutrients during mid summer. Because Cw1 is the same as Cp1 for the D-TP concentration in Run 2, the sediment provided the water with an equivalent phosphorus concentration during summer.
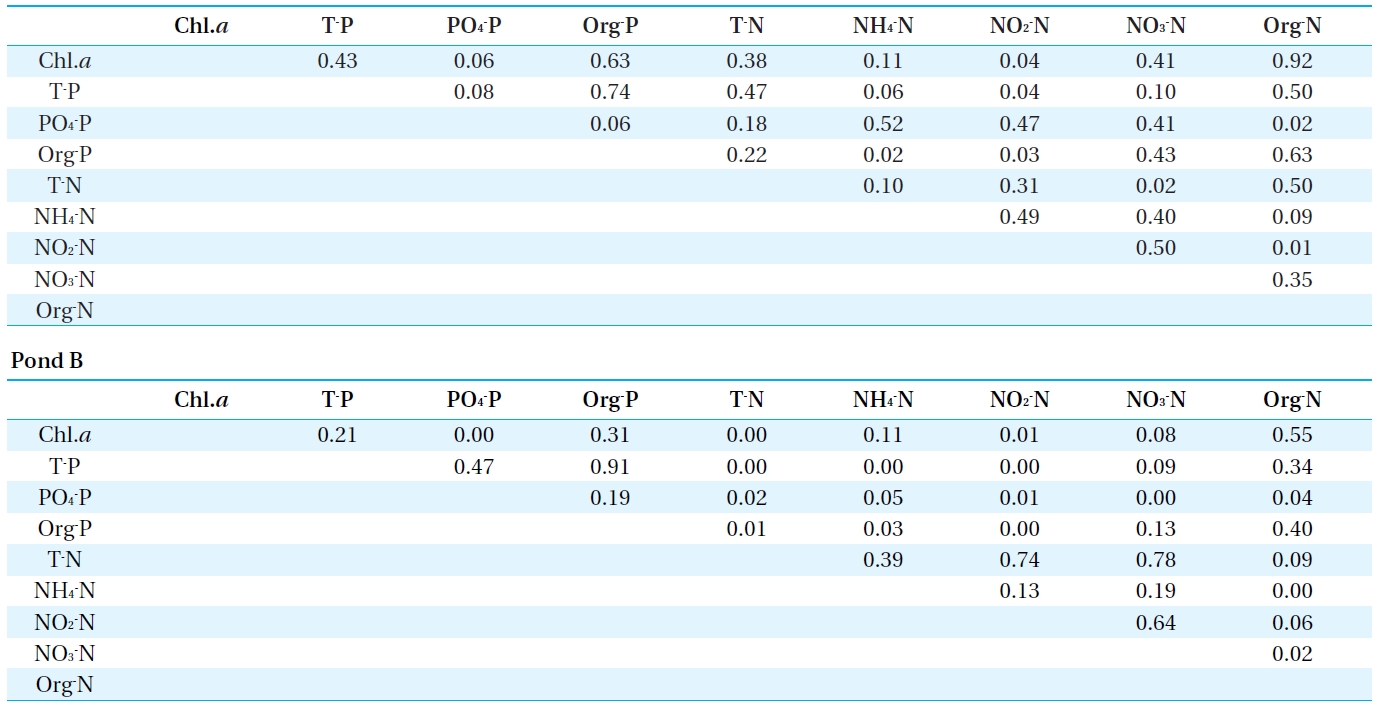
3.2. Water Quality and Phytoplankton in Surface Water
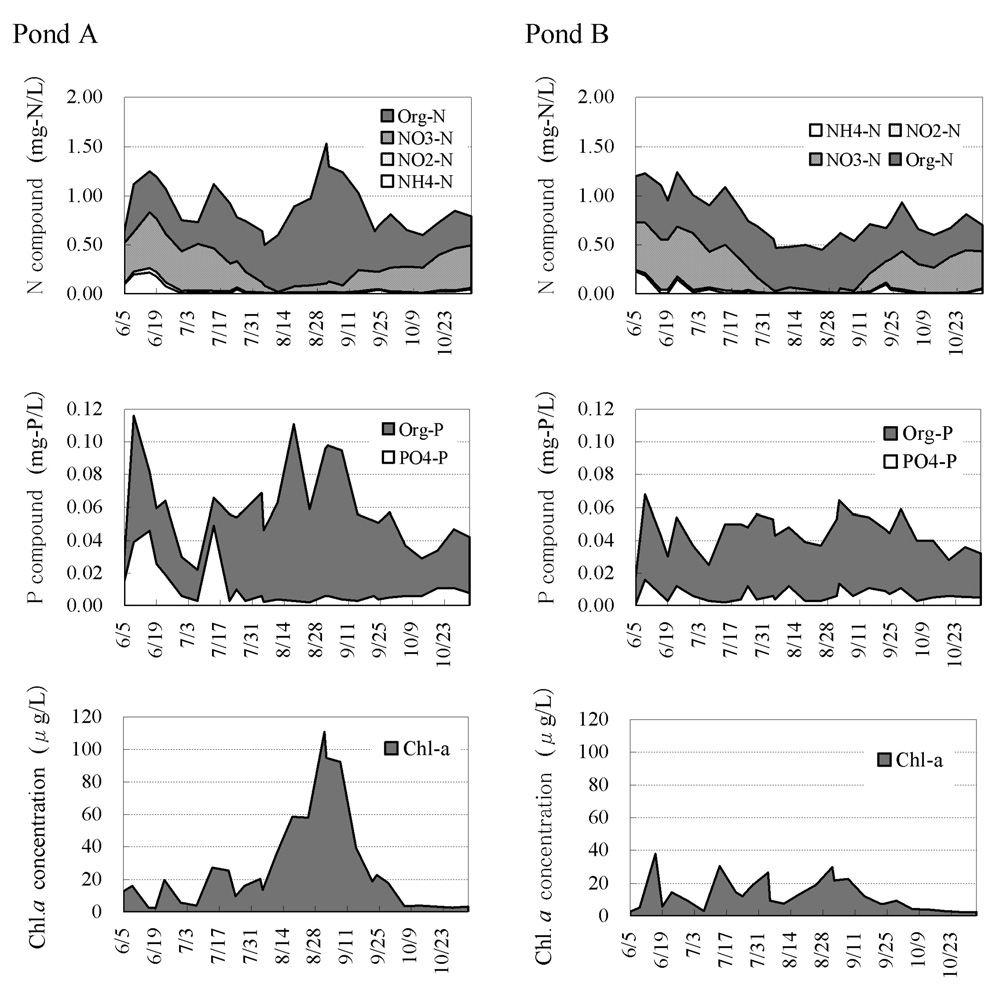
Fig. 4 shows the change in the nutrient and chlorophyll a contents of the water 50 cm below the water surface. The water of Ponds A and B ran low on inorganic nitrogen early in August, and organic nitrogen and organic phosphorus subsequently increased in Pond A.
From the results of water quality monitoring obtained during the period, the coefficient of determination (
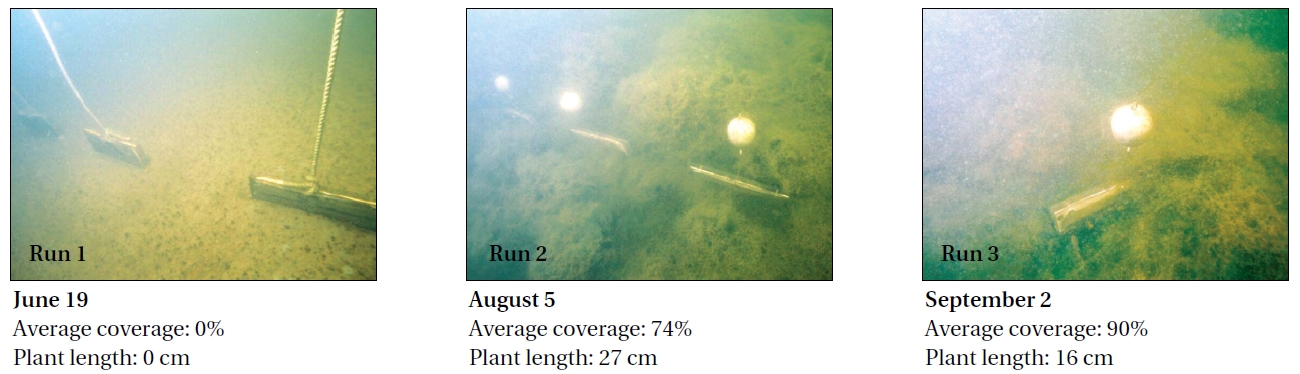
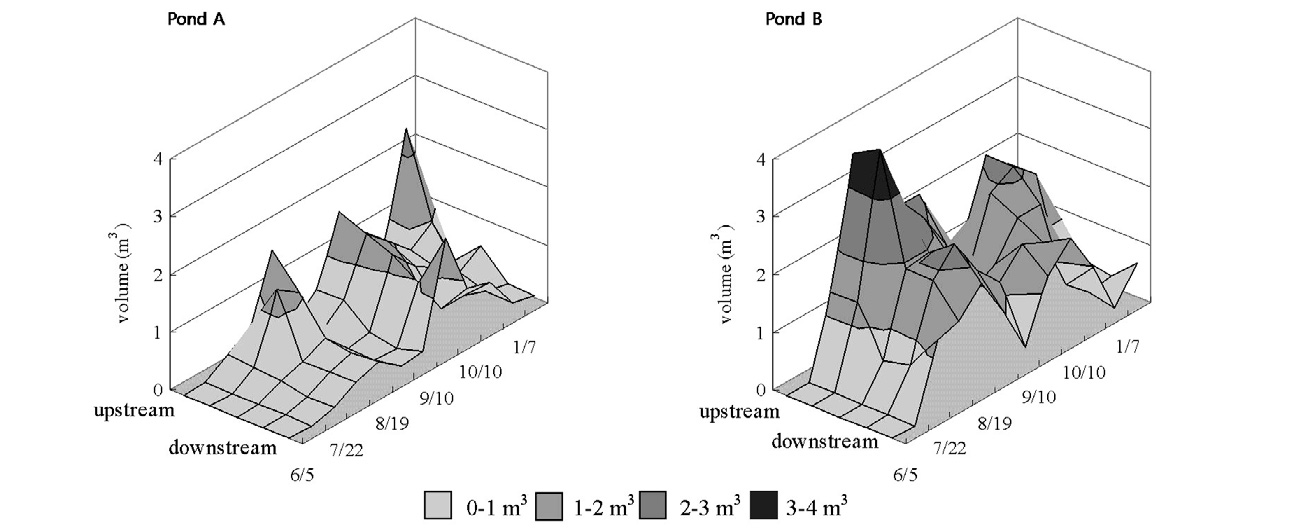
3.3. Attached Algae Covering Bottom Surface and Dissolved Oxygen (DO) Concentration
Both Ponds A and B were very transparent from the first day of the experiment until mid-July. From mid-July to mid-August, the attached algae:
Next, the DO concentration above the bottom surface was monitored to estimate the impact of dissolution on the attached algae, the result of which is shown in Table 4. On September 2, the DO concentrations of Ponds A and B were low. That of Pond B was approximately 0 mg/L. The area at the bottom surface of the eutrophicated pollution sediment was in an anaerobic condition during the summer because of the high rates of bioactivity and organic matter decomposition. Additionally, the DO concentration of the covering algae was lower than that without.
[Table 3.] Coefficient of determination (R2) between chlorophyll a and nutrient salts

Coefficient of determination (R2) between chlorophyll a and nutrient salts
This suggests that the vegetation, such as the attached algae covering the bottom surface, promotes the elution of the nutrients. As Pond A did not contain eutrophicated pollution sediment, its DO concentration was higher than that of Pond B. However, this was limited only to the summer when the bioactivity was high, since the DO concentration recovered on October 10. Therefore, the concentration of the phosphorus above the bottom of Pond B became low in the autumn, as indicated above, because the eluted phosphorus was re-oxidized and did not pass into the water area.
[Table 4.] DO concentration above the bottom surface
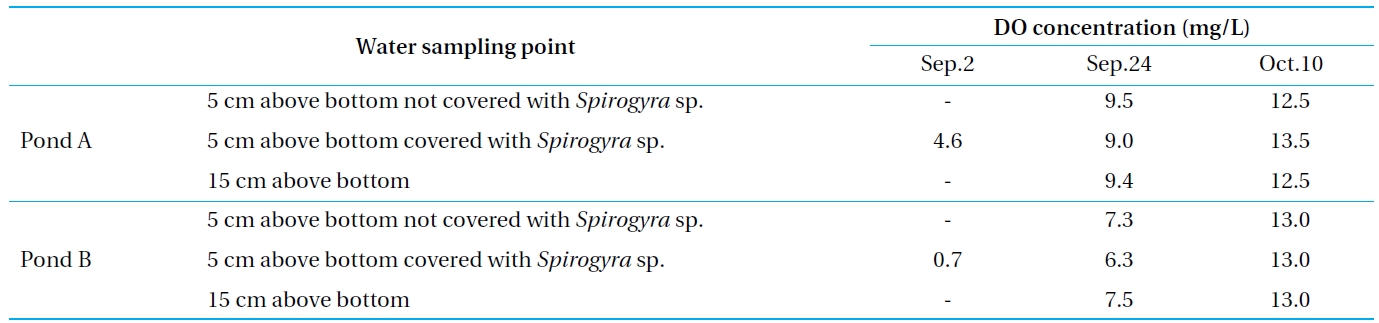
DO concentration above the bottom surface
3.4. Impact of Aquatic Environment on Elution and Diffusion of Nutrient Salts
3.4.1. Elution of Nutrient Salts
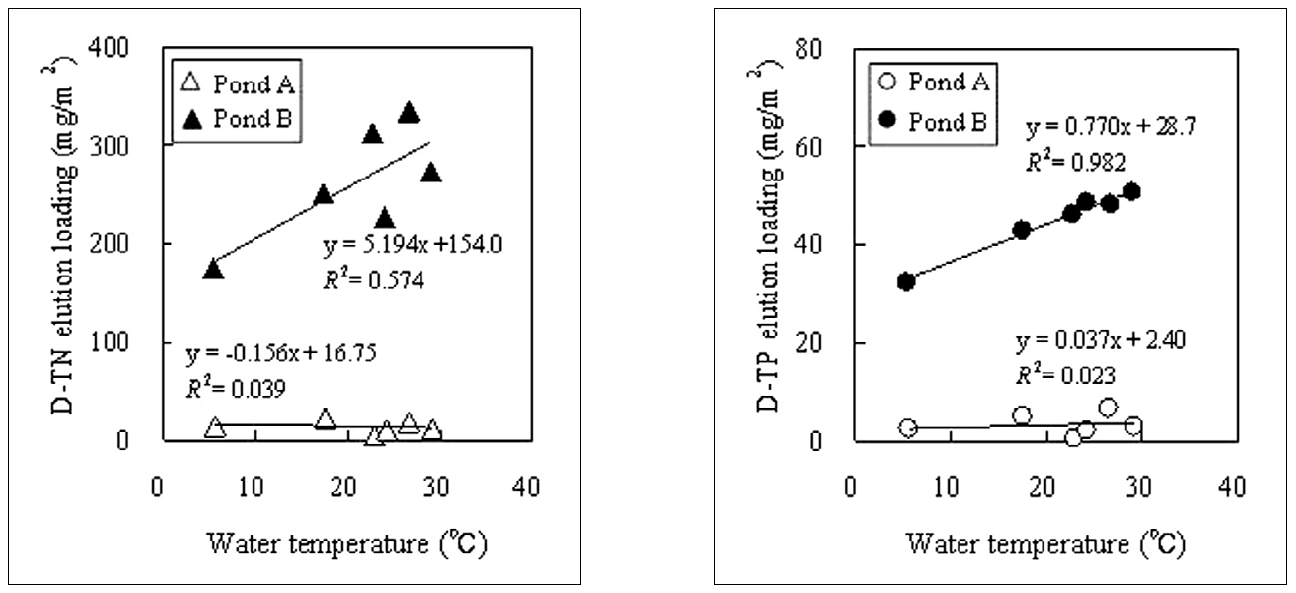
The nutrient release rate increases at high temperature[9-11]. The nutrient salt concentration of sediment pore water will become high if the water temperature becomes high; therefore, the relationship between concentration and water temperature was examined. The cumulative elution loading in the sediment during Run X,
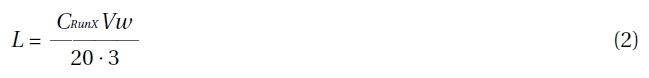
where
Fig. 7 shows the relationship between the water temperature and the nutrient elution loading in the sediment. (The average values of
3.4.2. Diffusion of Nutrient Salts
The elution behavior of nutrient salts from sediment depended on such factors as the nutrient salt loading in the sediment, the redox status of the sediment and the water temperature[11-13]. Moreover, the impact on a body of water was clearly influenced by vegetation, such as attached algae.
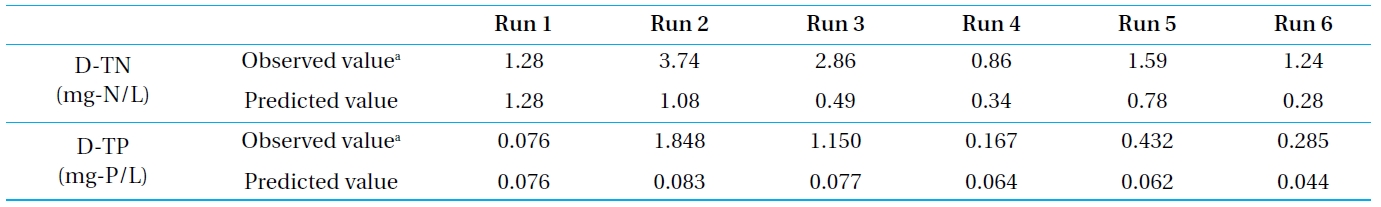
[Table 5.] Simulation and observed results of water above the bottom for Pond B

Simulation and observed results of water above the bottom for Pond B
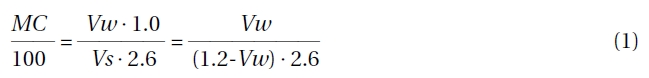
However, the elution rate (
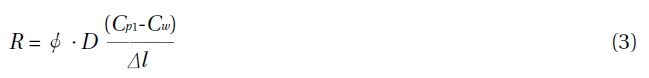
Here, φ is the sediment porosity,
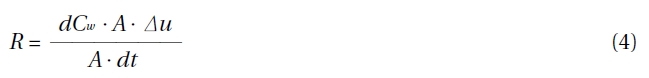
where A (m2) is the sectional area and Δ
Consequently,
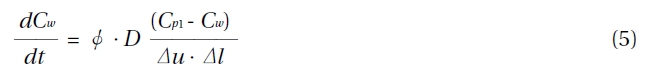
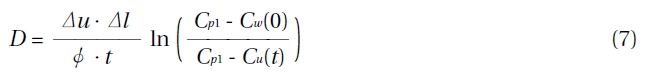
Equation (5) can be integrated into t. If the sediment pore water is assumed to be constant, at

Incorporating the monitoring data (Run 1) into Equation (7), the diffusion coefficient (
Moreover, although the water temperature and water quality conditions were different, the water concentrations of the bottom surface of Pond B in Runs 2 ~ 6 were predicted using the diffusion coefficient and
As stated above, the DO concentrations of Runs 2 and 3 on the bottom surface were low and promoted the elution of the nutrients. Moreover, the vegetation volumes of Runs 2 and 3 were large, and the eluted nutrients could not diffuse to the surface layer because of the covering of attached algae. This result indicates that the elution behaviors of the nutrient salts from the sediment during summer relate to vegetation growth, phytoplankton changes, biological activity (such as microorganism, zoobenthos) and other impacts on the aquatic environment. Therefore, it is clear that the water quality phenomena with regard to the surface water and bottom water were different. This study suggests that deciding the factors for investigation, such as the season and the area, is very important in relation to water management in a reservoir.
The main results were as follows:
The pore water of eutrophicated sediment contains a very high concentration of nutrient salts, and the effect of elution is confined to a limited area of the bottom surface during mid summer.
The pore water of eutrophicated sediment contains a very high concentration of nutrient salts, and the effect of elution is confined to a limited area of the bottom surface during mid summer.
The eluted nutrients from the sediment caused by decomposition and anoxic events on the bottom provide a source for the growth of phytoplankton and vegetation.
The area at the vegetated bottom surface has a low DO level and promotes the elution of the nutrients.
Since the elution behaviors of the nutrient salts from the sediment during summer were relate to vegetation growth, phytoplankton changes, biological activity and other impacts on the aquatic environment, the water quality phenomena in the surface water and bottom water in a water body will be different.
These results provided significant concerns relating to the monitoring of water quality conservation. If monitoring for water quality management, with an ecosystem in mind, it is important to carefully select the area conditions, such as monitoring points and monitoring period.
The monitoring work was financially supported by the Ministry of Land, Infrastructure, Transport and Tourism.