One of the challenges facing small-island developing states (SIDS) is the appropriate ways in which to operate and manage infrastructure in order to sustainably develop. Electrification, especially rural electrification (RE), is a core component of the Sustainable Development Goals (Litzow et al., 2019). The indicators for SDG 7 depicts that there should be access to reliable and affordable and modern energy services by 2030 (Chirambo et al., 2018). A successful electricity reform is expected to enhance the efficiency of the sector, improve energy service reliability and service quality, reduce the price-cost gap through cost reflective pricing and increase investments (Kessides, 2012; Jamasb et al., 2006).
The Maldives, despite being an island economy with a sparsely distributed population, achieved universal electrification in 2009, with South Asia’s highest electrification ratio. In 1990, only six islands had access to 24-hour electricity. With funding from international agencies, the Maldives was able to expand power supply to 40 outer islands in 2010, and, by 2011, all islands had access to a 24-hour electricity supply. However, in most of the islands, electricity supply remains intermittent as it was developed without proper planning and technical know-how. To understand the situation, performance evaluation can be done in a benchmarking framework. Performance benchmarking is an important activity for any business or organisation. Results of such benchmarking studies allow entities to compare themselves with the best in a peer group and then to develop strategic plans for improvements in their performance. No detailed performance analysis has so far been reported for the Small Islands Developing States (SIDS), except one study on Caribbean by Marina et al. (2008), despite the fact that reforms in electricity provision has been implemented in SIDS to improve electricity sector.
The rest of this paper is arranged as follows: Section 2 gives an introduction on the electricity sector of Maldives. Section 3 reviews benchmarking techniques in light of the literature and examples from related studies. Section 4 explains the Stochastic Frontier Analysis (SFA) methodology and data applied in the study. Section 5 presents the research results and analysis. Section 6 presents conclusions and suggestions for further research.
2. Electricity Sector in the Maldives
In 2009, six regional utilities were established to consolidate the power system. In line with this, several power houses managed by island development committees and private operators were absorbed by the regional utilities. In 2012, FENAKA Corporation Limited was established by a presidential decree under the Companies Act of 10/96 to provide island communities with electricity, water, and sewerage. FENAKA took over the operations of the regional utilities, as Government delegated them of improving transparency and efficiency of operations of electric systems. FENAKA now manages 143 of the 194 inhabited islands, and STELCO serves and operates power systems in 34 islands, MWSC operates in one island, and communities are continuing to serve only in 4 islands which had drastically decreased from being the main system prior to 2008 to being 30 in 2015 to only 4 by 2019. In addition, there are separate power plants more than 180 tourist resort islands, and some industrial islands are operating electricity on their own.
Given the Maldives’ characteristics of dispersed islands and population, it has been extremely expensive and practically difficult to set up a single national grid to serve the islands. Therefore, each island has its powerhouse and distribution facility, and technical specifications and capacities vary between islands because they were developed without strategic planning and mostly in an ad-hoc manner.
In general, the generators have not been procured to optimise performance at each island’s demand levels, as many generators are over-sized. This could be a key reason for inefficiencies in fuel consumption. Other reasons might include low power factors, poor maintenance, old equipment, and fuel loss. In some islands, issues from the electricity generation side were possibly due to poor maintenance. There is also a loss on grid side, which is possibly as a result of aged or undersized distribution cables as well as poor corrective measures taken to improve quality of the system such as phasing balancing, harmonics etc. (MEE, 2013). Large variations in peak power demand in small, rural islands is an issue and it often forces an additional generator set to be installed and switched on during the peak hours and which usually runs at low load, reducing the fuel efficiency (Fenhann & Ramlau, 2014) which has an effect financially (Almeshqab & Ustun, 2019).
Measuring efficiency and subsequently the economic performance of the rural electricity sector is important to both the rural communities and policy makers. There is limited research available that explicitly compares inhabited islands, tourist resort islands and also the impact of improvement of solar PV generation on the efficiency of electricity output. Due to the dispersed nature and populations, it has not been possible to establish a single national grid for electricity in the Maldives. Instead, each island has its own powerhouse and distribution facility. Technical specifications and capacities vary between islands. However, rural electrification policy should be coordinated with other infrastructure development efforts to provide a broad set of complimentary infrastructure (Kirubi et al., 2009).
In economics, the term efficiency refers to the comparison between the observed values of outputs and inputs with the optimal values of the outputs and inputs used in a production process (Karlaftis & Tsamboulas, 2012). Economic efficiency requires that producers of a good or service make the best use of the resources available to them. To interpret the concept of economic efficiency, it is necessary to distinguish between technical efficiency and allocative efficiency.
According to Farrell (1957), technical efficiency is related with the potential to produce on the frontier isoquant, while allocative efficiency refers to the potential to produce at a given level of output using the cost minimising input ratios. Alternatively, technical inefficiency is related to deviation from the frontier isoquant, and allocative inefficiency reflects a deviation from the minimum cost input ratios. Therefore, economic efficiency is also defined as the capacity of a firm to produce a predetermined quantity of output at a minimum cost for a given level of technology (Ng'ang'a et al., 2010). Production function has traditionally been used to examine the efficiency of different production settings such as farming, hospitals and electricity in many developing countries (Battese & Coelli, 1995; So, 2003). Frontier production function can be defined as “the potential or maximum feasible output (power) that can be achieved by a power plant from given quantities of inputs and currently available technology” (Surender, 2018, Berger & Humphrey, 1997). Technical efficiency of a plant is the “ratio of the actual output, and potential or frontier output of the plant,” i.e., Technical Efficiency = Actual Output/ Potential or Frontier Output.
Deviations from the frontier may arise because of random factors and provided the disturbance term as the sum of symmetric normal and half-normal random variables (Aigner et al, 1977). A composed error term was also introduced which distinguishes inefficiency from a statistical disturbance of randomness (Meeusen & van Den Broeck, 1977). Estimating inefficiency component for each observation with the stochastic frontier model is also possible so that ranking among observations becomes possible (Jondrow et al., 1982). Following economic theory, one of the main assumptions underlying any growth accounting analysis and technical efficiency measurement is that all firms in an industry share the same technology and face similar environmental conditions. However, this is not generally the case in reality due to factors such as geography, institutional regulations, market structures etc. that tend to influence the performance measures obtained and may result in inefficiency. There are different factors that can explain the technical efficiency changes taking place across firms. These factors are exogenous variables that include form of ownership, size characteristics, raw materials expenses by firms and government regulations that may be solved by the frontier approach.
Statistical benchmarking techniques have been largely used in the electricity industry to determine the relative efficiency of individual power plant's costs in relation to their peers (Haney et al., 2009; Haney et al., 2013). Obtaining reliable measures of firms’ inefficiency requires controlling for the different environmental conditions under which each firm operates. A usual approach in efficiency studies employs stochastic frontiers, which allow for the measurement of the level of inefficiency in each firm (Dal Bó and Rossi, 2007). Any environmental factors that, given output and technical characteristics, raise input costs or input quantities will be said to cause inefficiency (Llorca et al., 2016).
Literature on efficiency suggests that, there exist two ways of measuring the efficiency of firms, namely, the output efficiency that captures how far an inefficient firm can increase its output to reach the frontier with the level of inputs it incorporates, and the input efficiency that identifies how far a firm can reduce its input usage for a given level of output it produces. Farrell (1957) categorizes measurement efficiency of production in two approaches: parametric and nonparametric approach. The parametric approach refers as stochastic frontier approach (SFA) while the nonparametric is a linear programing approach commonly referred as data envelopment analysis (DEA).
The main advantage of the stochastic frontier approach is the introduction of a disturbance term representing statistical noise (v). In time production units can become less inefficient and catch up to the frontier. It is also possible that the frontier shifts, as a result of technical improvement. Moreover, production units can move along the frontier by changing input quantities. Finally, there can be some combinations of these three effects. The stochastic frontier method allows decomposing of these three effects. The stochastic frontier method allows to decompose growth into changes in input, technology and inefficiency, thus extending the widely used growth accounting method (Mastromarco, 2008).
Benchmarking studies allow comparability of outputs and inputs across production units in the comparison set, on outputs and inputs by production units, and determine the reasons and possible remedies for the low efficiency values (Diewart and Nakamura, 1999). Measuring technical efficiency and subsequently, the economic performance of the electricity sector is important to communities, policymakers and to the tourism sector. That includes figuring out how far the output for the electricity sector can be expected to increase or input can be reduced by simply increasing the level of efficiency, without absorbing further resource and increasing additional capacity or type of technology that can increase costs unnecessarily (Ahmadzai, 2017).
When used properly, performance measurement and benchmarking encourage enterprises to become learning organisations. This is a term proposed to describe organisations which have been successful in getting their employees to think and work as teams, adapt readily to change and take a system-wide view in problem-solving (Senge, 1990). By recognising that every enterprise can learn something about another’s operations and highlighting the need to continually be improving performance to remain in front, benchmarking facilitates a culture which emphasises the need to learn and have an open mind. Identifying major gaps in performance levels may, therefore, force an organisation to fundamentally rethink its way of how it does things.
One of the main policy objectives of ownership reform in developed market economies was to promote efficiency. There are different theoretical arguments on why private ownership and market-oriented reforms might lead to greater efficiency. Public ownership is superior to private ownership only in a narrow range of circumstances (Hart et al., 1997). Increases in efficiency that reduce costs certainly help, but if prices are not able to cover both running and capital costs, the investment will be either curtailed or financed at the expense of increasing public deficits. Private ownership offers the prospect of imposing hard budget constraints and the need for sustainable (full) cost-reflective pricing (Jamasb et al., 2005).
In developing countries, however, the path to reform has been more difficult. Developing countries suffer from serious institutional weaknesses, meaning that planned reforms may not produce their intended benefits. In other words, when competition is weak, performance improvements from private participation seem to be dependent upon having an effective regulatory regime in place to stimulate management to improve performance. On the other hand, independent regulation without privatisation, in effect regulation of state-owned enterprises, seems to be ineffective. This result is not surprising when the government is the operator of enterprises, the existence of independent regulation may lack credibility (Prager, 1994).
Results on the effects of ownership structure have been mixed in the literature on efficiency/productivity, and it is still an open research question. A recent study done on India reveals statistically significant and positive effects of public ownership on efficiency in Indian electricity sectors but the same study also indicate that increase in subsidies from the government tend to increase inefficiency of public sector electricity plants (Vijai, 2018). It can be conjectured that subsidies could mitigate firms’ cash flow and liquidity constraints at the beginning of the fiscal year, which may have adverse effects on the efficient management of utilities
Another study that looks into this public sector was done on to measure the technical efficiency levels of Malaysian thermal power plants. The study that employs stochastic frontier analysis indicates that ownership, plant size and fuel type have a significant influence on technical efficiency levels, and found that publicly-owned power plants obtain average technical efficiencies lower than privately-owned power plants (Domah, 2004). The study suggests that power plants which have a larger installed capacity and are gas fired, are usually more technically efficient than the other power plants in Malaysia. According to the authors, higher capacity utilisations have the possibility to lead to a better technical efficiency level due to lower unplanned and planned outages.
There are very few benchmarking studies done on small islands or small island countries. A technical efficiency analysis of electricity generators in 16 small islands in the Caribbean, found that there are no clear differences in the production structure between islands and non-islands electric utilities, nor any evidence suggesting that they are less technically efficient (Meibodi, 1998). Most of the powerhouses were owned by the state in the islands that were studied, and therefore this study did not analyse if private owned powerhouses in the islands performed better
Some literature cites that the size of plant has an influence on the efficiency. Some studies indicate most of the highly efficient power plants are found to be relatively large. It is often argued that large firms are possibly more efficient, as they can use more specialised inputs, coordinate their resources better and reap the advantages of economies of scale (Vijai, 2018). Reasons why larger power plants may be more efficient than those with only one or two generators, include for example, staffing requirements per machine may tend to decrease as the number of machines increases. On the other hand, with larger plants there may be greater problems of coordination. Diewart and Nakamura (1999) found that smaller plants were all relatively inefficient when compared against plants in other size categories. However, there is a possibility that that newer smaller generators are more fuel efficient. Nevertheless, there is no consensus on the improvement of certain reforms such as change of technologies or size of power plant
There are studies which indicate that the performance of several electric utilities are sub-optimal, suggesting that there is potential for substantial cost reduction. Bigger utilities may also have greater inefficiencies and have distinct scale inefficiencies (Meher & Sahu, 2016). Often power sector in developing countries fail to exploit the production technology and production resources fully and often make inefficient decisions or use equipment that leads to inefficiency. This could also result in case of corruption, because corruption increases factor requirements of efficient production and it diverts managerial effort away from factor coordination. Therefore more corruption in the country is significantly linked with more inefficient firms, in the sense that they employ more inputs to produce a given level of output (Dal Bó & Rossi, 2007).
In the literature, a variety of specifications is employed depending on what exactly is being investigated and which variables are being used as inputs and outputs. In general, the inputs must reflect the resources used and the output must reflect the service levels of the utility and the degree to which the utility is meeting its objective of supplying electricity to consumers (Korhonen & Syrjänen, 2004). The most common outputs of electricity plants in literature are the amount of distributed energy, the number of customers, the peak demand and the service area (Furková, 2013).
Econometric estimation methods allow for the fact that deviations of observed choices from optimal ones are as a result of failure to optimize or inefficiency and because of random shocks. Stochastic Frontier Analysis is one such method to model which can be used to model producers. Based on benchmarking, that is, a unit’s performance is compared with a peer reference performance or an efficient frontier. Particular factors impact the environment in which production is taken place (Ali, 2016). As extent of input and output attributes, environmental factors, ownership, regulation etc.
In this paper it is intended to show that the best practice efficiency measure, can provide a meaningful, integrative framework for utilizing nonfinancial input-output efficiency measures (Farrel, 1957). This approach requires no information on output revenue or input costs. This study is based on information for 30 plants in inhabited and resort islands in the Maldives. Although the Maldives do not have private utilities providing electricity, the resort islands are one island – one resorts that are run privately, and hence has the attribute of private sector, and it is expected to be efficient. The number of people that reside including the employees and tourists may be similar to some smaller islands in the country. Values for net electric power output and two categories of inputs are used.
The model presented in equation (1) and (2) is based on Battese and Coelli (1993, 1995) model that is used in this analyses (Battese & Coelli, 1995), which also allows for the use of panel data. The error term consists of the two terms (vi) and (ui), whereby the former accounts for the noise in the regression and is assumed to be normally distributed. The technical inefficiency term (ui) is usually modelled as a half normally distributed term.
The stochastic frontier production function to be estimated is
Where the technical inefficiency are assumed to be defined by
Where:
• ln denotes the natural logarithm (i.e., logarithm to the base e);
• Y is the total value of output (in kWh) for the power plant involved;
• Y is the total value of output or yearly electricity produced (in Kwh) for the power plant involved
• Capacity is the installed capacity of generator (in kW)
• Oil is the yearly consumption of diesel oil at the power plant (in L)
• Solarpv is a dummy variable indicating if solar PV is installed
• Private is a dummy variable indicating if the power plant is at a resort
• Community is a dummy variable indicating if the power plant is managed by the community
• Size is a dummy variable indicating power houses that has an installed capacity of more than 2000 kw
• Year represents the year of observation
• the Vits are assumed to be independently and identically distributed random errors,
• the Uits are non-negative random variables, called technical inefficiency effects, associated with the technical inefficiency of production of the power plants
The maximum-likelihood estimates for all the parameters of the stochastic frontier and inefficiency model, defined by Equations and are simultaneously obtained by using the program, FRONTIER Version 4.1 (see Coelli, 1994), which estimates the variance parameters in terms of the parameterization. The Ministry of Environment and Energy of the Maldives publishes a yearly electricity data book. It has been published for 2013, 2016, 2017 and 2018. The only years in which data for tourist islands were available are in 2017 and 2018 data books with data of 2016 and 2017 respectively. However, data for only six resorts are available for both years. There are studies done using one year and two year data. Vijai (2018) did a study on the technical efficiency of thermal plants in India with two years data on thirty power plants.
A sample of thirty power plants were from 2016 to 2017 are selected in this study. Amongst the thirty power plants. Twenty one plants are publicly owned, six plants are from tourist resorts, and three plants are community owned. The balanced panel data consists of sixty annual observations. Although important for a Cobb Douglas production function, data on the labour were not available or all the islands in the list and no island in the resort island categories. As no study has been done on the efficiency of power plants on a comparative perspective, an analysis with the level of data available is still important. Data are included in the supplementary material.
The output quantity of electricity production in the sample of islands was higher in 2017 than in 2016, which increased 6.38 percent from 443058238 kWh to 471311620 kWh. Total diesel fuel consumption also increased by 5.64 percent from 117709217 liters to 124350961 liters. As for installed capacity, in the sample islands, it increased by 9.94 percent, from 4146.87 kW to 4559.27kW. This is about two times larger than output and fuel usage increase. Solar PV increased from 14 to 18 islands with a capacity increase from 1856 kW to 3357 kW which is an increase of 80 percent in one year. Capacity increase electricity generation equipment may not always contribute to improvement of efficiency.
The maximum-likelihood estimates for the parameters of the stochastic frontier production functions for the power plants are given in Table 1.
SFA Results
The gamma estimate of 0.99 is high, meaning that much of the variation in the composite error term is due to the inefficiency component. The results show that all the input coefficients are smaller than one, implying diminishing marginal returns. On the other hand, the return to scale elasticities can be calculated by adding all the production elasticities. It is observed that the total of the two production elasticities (i.e. 0.30 + 0.98) is 1.28 which exhibits mild increasing returns to scale measure at the sample mean.
Coefficient of variable for installed capacity of diesel generator is positive, and both t-test and generalized likelihood test show that the estimated coefficient is significant at 1% level of significance. Often, the power plants do not have the capacity to supply and gets overload, resulting in frequent power cuts. In some islands, power cuts have been an issue during peak times. In Dharavandhoo, for example, as the guest house tourism was developed, it increased usage of air conditioners, and it caused a rise in electricity consumption (Iyadh, 2016). Estimates indicate that air conditioners have increased electricity consumption by about 60 percent. However, caution has to be taken as higher capacities may not always increase efficiency as overcapacity in some islands have also been recognized as an issue.
Fuel consumption has a positive relationship and is also significant at t-test and p-value at 1% level. In the past, there have been cases of power disruptions in the islands due to running out of oil in the island. Many islands do not have enough storage capacities and thus bring oil in small quantities, which will also raise costs, or sometimes spillages have occurred. See and Coelli (2013) note that fuel elasticity that is greater than the other input elasticities in his study on power plants in Malaysia. With regards to the elasticity of fuel inputs, a difference between islands and non-islands (–0.112 and –0.563, respectively) was noted, but regards that fuel input is not a significant binding constraint on production efficiency, compared to capital inputs. Adding more fuel to a fixed (and/or small) generating capacity, or alternatively, on larger generating systems which have much lower margins, does not necessarily contribute positively to total (net) output, ceteris paribus (Meibodi, 1998).
In the case of inefficiency component of the model, it shows factors that reduce or increases inefficiency. For Solar PV installed dummy variable has a – 0.95 coefficient level, which indicates that in islands where solar PV has been installed, it reduces inefficiency or increases the efficiency of electricity generation. The p-value was significant at 5 percent level.
The dummy variable for tourist resorts as private sector included in the inefficiency model is to capture differences in ownership of power plants on efficiency. The negative coefficient of -0.10 indicates that private ownership reduces inefficiency or increase efficiency. P-value of 0.08 was significant at 10 percent level.
The dummy variable for community was to figure out if a generalization can be made for community ownership on efficiency if the 4 power plants run by community can be considered. However due to data limitation, data for Hura island was not included. The 0.55 coefficient show that inefficiency increases and the p-value of 0.024 is significant at 5 percent level. It is possible that the community powerhouses lack support in human resource development. In the government subsidies the community powerhouses have been excluded. It is also is possible that there is a difference among the powerhouses in this category.
The dummy variable for the size is incorporated for the islands which have the largest electricity capacity to further verify if the capacity does influence in reducing inefficiency. Eights islands were considered as relatively larger size based on the average installed capacity of more than 3000kw. The coefficient value of -0.89 indicate there is a tendency to reduce inefficiency, but the p-value of 0.121 is not significant. Therefore it cannot be concluded that size does reduce inefficiency. This can be further analyzed by looking at individual power plant technical efficiency scores.
Further, Table 2 provides the average plant specific technical efficiency of power plants included in the study for the period 2016 and 2017. Technical efficiency have values between 0 and 1. As per individual plants, average scores vary between 0.44 and 0.98, indicating a wide gap. Overall it shows that mean technical efficiency for two years was 0.87, which indicate that power generation in the Maldives can be improved by 13 percent. There is no other literature that has used stochastic frontier analysis specifically on diesel engine power plants, but a studies on India by Thakur (2006) and Vijai (2018) show similar results as mean technical efficiency of 0.88 for coal power plants if it can be compared with power plants in South Asia (Vijai, 2018).
[Table 2:] SFA Technical Efficiency Scores
SFA Technical Efficiency Scores
It can be found that the average highest score for both years was for Vilu Reef island, which is a resort island. Power plant is run privately, and this indicates that the management of the island had incorporated efficiency optimization strategies. The second highest efficiency score was for Male, the capital island. This is the largest power plant in the Maldives, and has operated longest time in the Maldives. Most of the projects on power plants improvements have been done in Male. However, the third best average technical efficiency score is for Dhiffushi island. Both Vilureef and Dhiffushi is relatively smaller with a capacity of 664 kW in 2017. However, in this island improvements were done in 2016. Power cables were also renewed recently in 2015. Moreover, in Dhiffushi a project was undertaken in 2016 on Solar PV. It was funded by Global Sustainable Electricity Partnership, Asian Development Bank and the Government of Japan. The Solar power system in Dhiffushi produces 190 units of electricity per day. According to Environment Ministry, this is about 12% of the daytime energy used in Dhiffushi. In terms of technical efficiency Dhiffushi is followed by Olhuveli and Ukulhas island with similar results. Olhuveli is also a resort run privately, and further indicates private operators can increase efficiency.
Further analysis can be made at categories of power plants as resorts in general, and by ownership of power plants. The average scores and range of scores that are least varying are from resorts as in Table 3. Thus there is an indication that resorts have performed better with an average score of 0.93. The resorts are operating powerhouse on their own, and thus are comprised of various companies. This suggests that small islands with power houses being operated independently can be efficient, and also that the private sector can be relatively efficient. STELCO that operate in 34 islands follows this when average of all islands for 2 years is considered. It is the company that was transferred from the Maldives Electricity Board, the first electricity organization in the country, and thus have the strength of experience and expertise. The power plant in Dhuvaafaru is a special case as it is the only power plant run by MWSC, which is originally the company that run reverse osmosis plant in the capital Male. What is unique is that MWSC is a joint government (70% share) and foreign investment with Hitachi Company and a Danish company. It is possible that the engineering expertise for water has also helped in running the powerhouse in Dhuvaafaru. On the other hand, as for the community plants, there is a wide variation in the average technical efficiency scores ranging from 0.40 to 0.94 and has an average technical score of 0.70. FENAKA company that operate powerhouses in 143 islands has scores ranging from 0.68 to 0.95. FENAKA company may also have decreasing returns to scale as the company has to take care of many islands.
[Table 3:] Ownership of Power Plants
Ownership of Power Plants
In order to provide a general a general picture, the average technical efficiency between the publicly owned, privately owned in resorts, and community owned plants shown in Table 4. As the table shows there is a slight improvement in all categories. The public power plants average technical efficiency scores for both years were below the privately owned power plants in resorts.
[Table 4:] Community Owned Plants
Community Owned Plants
The islands where solar PV is used, have a higher average technical score and a less variation in the technical efficiency compared to islands that do not use solar PV (see Table 5). One of the observations is that there are relatively few islands among resorts that has installed solar PV. Both Vilureef and Olhuvili that scored higher in efficiency scores are not among islands that use Solar PV. If this is the case in one way the results support that the scores are due to efficiency of diesel based powerhouses itself, and if solar PV are used there is an opportunity to further improve and efficiency in these islands.
[Table 5:] Technical Efficiency Compared to Islands
Technical Efficiency Compared to Islands
This is the first empirical study that analysed the technical efficiency of diesel based power plants in Maldives using panel data benchmarking model. This study attempts to measure power plant specific technical efficiency of electricity generation and identify potential factors determining technical inefficiency using Stochastic Frontier Analysis (SFA) techniques. SFA allows the calculation of input elasticities and help make deductions on the production function. The main interest is to analyse the degree or extent of power plant diversification on ownership, resource usage, size and use of renewable energy and its impact on the levels of technical efficiency in the electricity sector in the Maldives. The study found that technical efficiency varies across plants – ranges from 0.44 to 98 percent. About 33 percent of the plants are being operated under the mean technical efficiency of 87 percent that calls the attention of the policy makers to take appropriate steps either increasing the plant output by 13% or reducing its existing input levels by 13 percent to produce the given level of output.
The study found that there are resorts that have performed well in terms of efficiency even though the power plants are individually operated. It was expected that as resorts have the characteristics of private ownership it will be more efficient in usage of resources. This could also be related to proper maintenances, record keeping and employment of skilled personnel. This thus gives a proxy explanation on the efficiency of powerhouse facilities in private sector. But it also gives an additional knowledge as no study in the past have used tourists resort islands as separate power plants. Therefore the desire to be efficient was not only to improve efficiency in generating electricity, but was also to run a successful resort operation, thus a derived demand and supply of efficiency. The study found that publicly owned power plants obtained average technical efficiency of 0.88, which is lower than privately own power plants in resorts, which obtained technical efficiencies of 0.93. Similar to the study noted on Malaysia before, the publicly owned power plants in it could also be a result of other reasons such as more effective management of power plants (Domah, 2004).
As the study did not involve any private power plant that caters to the public, it cannot be deduced if private power plants are efficient in providing electricity. However, this study indicates that private power plants have performed better, and thus there are elements that can further be learned from the tourist resort sector, in order to improve the efficiency of publicly owned and community power plants. The private resorts have undertaken corporate social responsibility initiatives in different islands in the past. This could relate with literature and theories on extended resource-based views as some scholars have extended the scope of the resource-based view to focus on resources that span the boundaries of the organization (McIvor et al., 2009).
The study found that technical efficiency scores of the community power stations are relatively low. However, it is possible that improvements can be attained. It must be noted that undertaking power stations by communities themselves was a tradition in the Maldives and showed community cohesion and resilience to do activities collectively. By 2008 most of the islands powerhouses were run by community. Due to a change in government policies with consent of communities those that were willing were taken over by government companies. However, what has happened is these government companies became heavily relied on the government for subsidies. The impact of subsidies on efficiency is negative in the neighboring India (Bobde & Tanaka, 2018), and there are indications of mismanagement in the Maldives electricity as well.
As with the size of the plant, it cannot completely be said that increase in size does relate with efficiency as sometimes there are evidence of oversize. Increase in capacity is shown to increase efficiency, but this has to be taken cautiously, as there are some plants with overcapacity. Dhiffushi, Ukulhas and Vilureef are relatively small plants. Annual report of STELCO in 2017 show that there are many plants with very high capacity. However, it also does indicate that Dhiffushi is an island where costs are covered. In Dhiffushi, capacity utilisation is relatively high and thus can be regarded to be ideal. Fuel efficiency, especially in island powerhouses can be gained through strategic use of multiple generators of varying sizes rather than a single generator, which enabled varying the level of power generation and therefore fuel consumption, based on demand at any given time (STELCO, 2017). In the study on Caribbean that was referred before, capacity utilisation factor is unanimously the most important variable that explains efficiency differences between islands and non-islands. Dhiffushi used 66 percent of capacity whereas Mahibadhoo used 29 percent of the capacity. But in the case of Dhiffushi, it indicates that even in smaller islands, it is possible to install ideal generators in relation to capacity utilisation, although further efficiency is certainly needed.
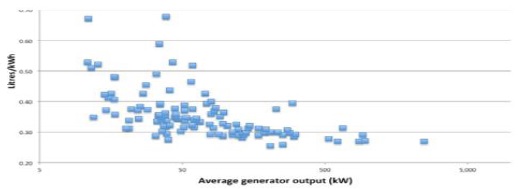
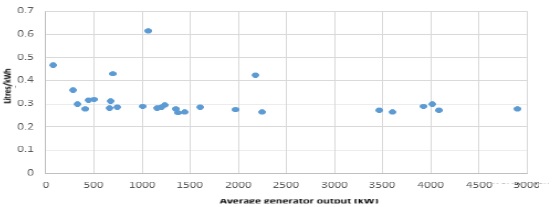
Although no study was done on stochastic frontier analysis on power sector in the Maldives, a comparison can still be done on an analysis reported by Ministry of Environment in 2012 reflecting on the fuel consumption and size of plants as depicted below (Figure 1) and a graph prepared with data of plants of similar sizes (i.e. excluding plants from Addu and Male) that are used in this study (figure 2). It can be observed that both graphs show plants of similar sizes have different fuel consumption levels. A significant difference with two graphs is that compared to 2012, the relatively smaller sizes have increased in scale. While there were many plants with a capacity of less than 50kw, the smallest generator in this study has 72kW in Rakeedhoo island. Although it’s an island with a population of less than 100 people, recently there has been an increase in demand for electricity due to an increase of air conditioners particularly due to an increase in guesthouse tourism.
A strength of this study is that it is done by keeping the costs and revenue neutral, and purely on the technical efficiency side. However, a weakness in this study is that it has not incorporated costs and profit information. Further studies can be done with cost efficiency stochastic frontier analysis. There are also other factors that may influence efficiency as there are losses in the transmission of electricity. In this study, only electricity production data are used. The data on transmission loss is not available, and the billed amount was only available for 2017. Moreover, the data on labour employed in powerhouses are also not available in the electricity data book. While data on the usage of lubrication oil was available for the inhabited islands, it was not available for the resorts. Collection of these data can help improve research in the future.
It has to be recognised that no single performance measure or technique can provide the entire answer. All quantitative analysis involves significant assumptions and limitations. Consequently, one should not rely on one single tool solely but use several instruments, both quantitative and qualitative, to make an overall judgment of how a particular enterprise is performing and what needs to be done. Techniques should be complemented by cross-analysis and check in order to be sure that empirical results make sense (Ahmed & Rafiq, 1998; Martina et al., 2008).
Funding:
This research received no external funding.
Conflicts of Interest:
The author declare no conflict of interest.