n a spatially interlaced stereoscopic (SIS) three-dimensional (3D) display to be realized by providing the observer a part of left-eye/right-eye images, a loss of information can be perceived due to the un-shown part of each image. In order to resolve that problem, an improved SIS 3D display is proposed to deliver the images without loss of information to the observer using a time-multiplexing scheme. However, that time-multiplexing SIS also has a problem of luminance distortion when the desired luminance is not shown due to an insufficient response of the liquid crystal cell. In this paper, we propose a new method by optimizing the image data to show correct luminance with minimum distortion.
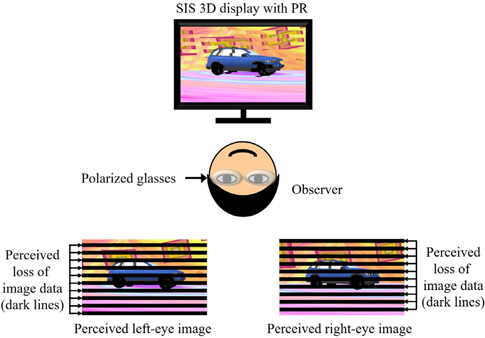
Recently, various kinds of commercial three-dimensional (3D) displays have been proposed to make the observer feel a cubic effect using the physiological cues of 3D perception [1]. Among these 3D techniques, a spatially interlaced stereoscopic (SIS) 3D display is one of the most famous commercial 3D platforms. It separates spatially mixed left-eye and right-eye images shown in the screen by using a combination of polarized glasses and patterned retarder [2-4]. The principle of SIS 3D display is shown in Fig. 1. The odd pixel rows show those of the left-eye image, while the even pixel rows provide the corresponding part of the right-eye image. The pattern of the retarder film is also designed to be matched with the odd/even pixel rows to display the left-eye/right-eye images in order to make them to have polarizations which are orthogonal to each other. Then, with the filtering effect of the polarized glasses, each of the observer’s eyes can perceive a separated image with proper disparity as shown in Fig. 1. Due to its simple and effective principles to induce a cubic effect, the SIS 3D technique becomes one of the most used stereoscopic 3D techniques. However, due to its principle of delivering only half of the image lines to each eye, an image data loss can be perceived while the un-shown part seems to be dark lines as shown in Fig. 1.
II. TIME-MULTIPLEXING SIS 3D DISPLAY
In order to resolve the problem of data loss described above, a method to combine a time-multiplexing method to an SIS 3D display has been proposed. In this chapter, the principle and the limitation of the time-multiplexing SIS method are described.
2.1. Principle of Current Time-multiplexing SIS 3D Display
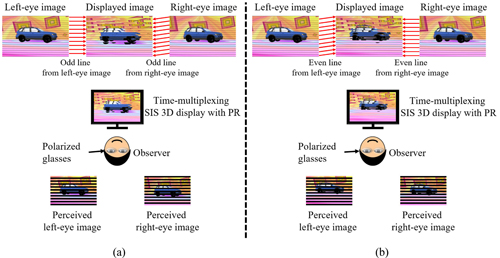
The basic principle of time-multiplexing SIS 3D display to increase the amount of perception of image data by providing the data of each odd/even line pair within a single line of spatially interlaced image. Then, though the number of perceived image lines at each eye is reduced to half as in the conventional SIS 3D display, the sampling rate can be doubled by displaying all image data from original left-eye/right-eye images at the screen.
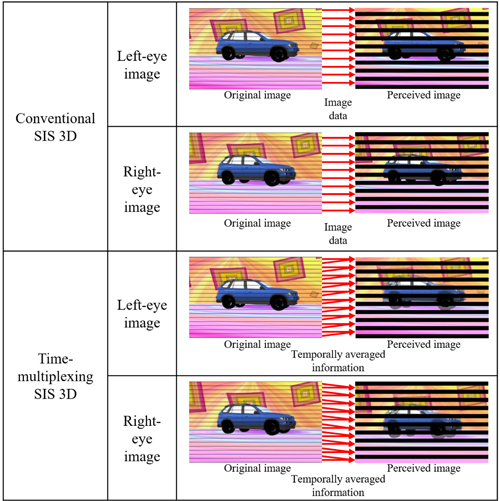
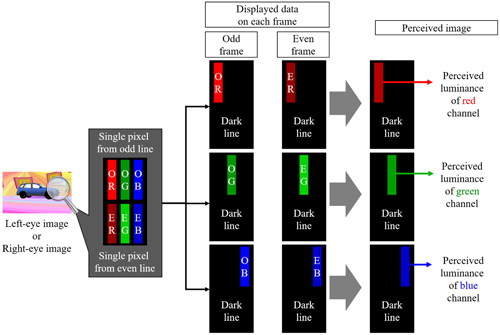
For that purpose, the time-multiplexing SIS 3D display is showing different images at different frames. As shown in Fig. 2(a), the odd line of the left-eye/right-eye images are displayed in each odd frame, while the observer can recognize the even lines of left-eye/right-eye images as shown in Fig 2(b). Therefore, by switching these two conditions sequentially with a higher frame rate such as 120 Hz, it is possible to deliver all image data and the observer will recognize temporally averaged information of those data as shown in Fig. 3.
2.2. Limitation of Current Time-multiplexing SIS 3D Display
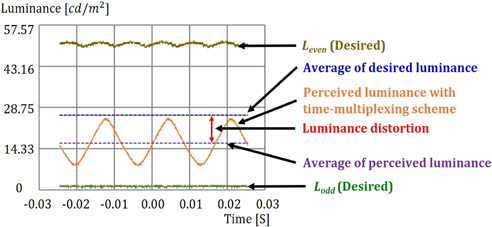
However, there is another point to be considered practically. Since most of the existing flat panel 3D display is based on a liquid crystal (LC) display technology, the response time of the LC cell can be an important issue especially in realizing a time-multiplexing scheme. If the time-multiplexing method works in ideal conditions with an infinitely fast LC cell, the perceived luminance will be the average of a pair of odd/even pixels displayed in odd/even frames. However, if the response time of the LC cell is large (slow LC response), a luminance distortion can be perceived since the desired luminance for each image data cannot be achieved. Figure 4 presents an example of data measured using a high speed luminance meter (BM-7, Topcon) which shows the real temporal response of the LC cell in the display panel. As shown in Fig. 4, the real luminance profile shows a luminance transition between the lower levels, while the desired average luminance should be the average of Leven and Lodd. Therefore, there exists a luminance distortion between the ideal condition with desired average luminance and the perceived condition with distorted luminance due to slow response of the LC cell. Based on the basic principle of the time-multiplexing SIS method shown in Fig. 2, the average of desired luminance can be regarded as a reference luminance to calculate the luminance distortion.
Figure 5 presents the definitions of a reference luminance and a luminance distortion, which are based on the Talbot-Plateau law and the percentage error formula respectively [5]. As indicated in Fig. 5, it is needed to calculate them for each red(R)/green(G)/blue(B) channel independently for every pixel pair for accurate compensation. In other words, each odd/even pixel pair has an optimized value for each R/G/B channel to realize correct luminance and color data as we propose in the next chapter.
III. PRINCIPLE OF PROPOSED OPTIMIZATION
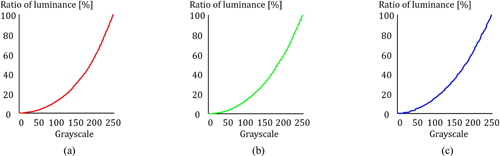
In this chapter, a new method to compensate a luminance distortion by optimizing the displayed data in order to realize the closest value to the reference luminance is described. The first step of compensation is acquiring of a gamma graph which presents the relation between the grayscale of image data and the luminance. Since most flat panel displays have a non-linear gamma relation, it is needed to measure it accurately with a luminance meter. It is also needed to prepare the gamma relation for each R/G/B color channel because they may differ from each other.
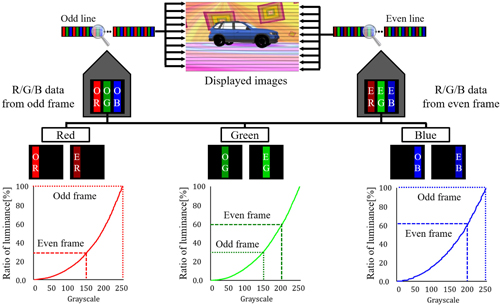
Then, the reference luminance can be acquired from the measured gamma data by averaging the desired luminance pair of each R/G/B image data of pixel pair from odd/even frame data of time-multiplexing SIS 3D display. In order to describe the process with more detail, an example R/G/B data set denoted in Fig. 6 will be used in this chapter.
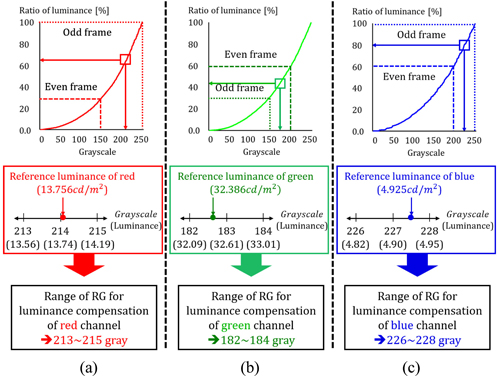
After calculating the reference luminance for each R/G/B channel, it is necessary to find a range of reference grayscale (RG) data corresponded with the reference luminance as shown in Fig. 7. Since the gamma relation has a non-linear curve, the average luminance is different from the luminance of averaged grayscale data. In addition, there is another issue that the grayscale data is a digitized value, whereas the reference luminance is not. Therefore, before proceeding to the next step to find the optimized grayscale value, it is necessary to set a range of the RG, where the reference luminance is within that luminance range of grayscales.
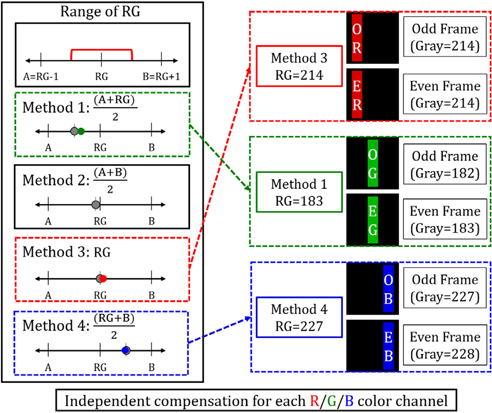
In order to clarify the points above, Fig. 7 presents a method of finding the range of RG with the example R/G/B data. As shown in Fig. 7, each color channel has its own range of RG with the reference luminance within it. Then, the next process is to find a method to realize optimized luminance. In this step, we are using a modified time-multiplexing method to increase the accuracy of compensation. In order to minimize the negative effect of the slow response of the LC cell, the compensation method is designed to change the grayscale data within a gray step. With that condition, Fig. 8 shows four possible methods of different compensation that can be applied within the range of RG. In order to make the explanation simpler, we will note RG-1 as A and RG+1 values as B in the following descriptions.
The first method (Method 1) is to choose A and RG values as grayscale data of time-multiplexing operation. It is effective when the reference luminance is within the range of luminance of A and RG values and close to the average of them. The other method (Method 2) is using A and B values as grayscale data. In this case, the realized luminance will be the average of that of A and B grayscale. Another method (Method 3) is using a single grayscale of RG for the compensation. Though it realizes a similar luminance value with that of Method 2, there is a difference between them due to the non-linearity of the gamma relation. With a gamma relation typically used in a liquid crystal display, the realized luminance through Method 3 will be a little bit higher than that of method 2. The last method (Method 4) is useful when the reference luminance value is between the luminance range of RG and B and close to the average of those two.
With the above definition of each method, the example R/G/B color channel used in this chapter can have an appropriate compensation method of its own as shown in Fig. 8. Throughout these steps described above, each color channel of each pixel pair of odd/even lines can be optimized to have a luminance difference within the difference of one grayscale step.
In the experiment, we used a 55-inch time-multiplexing SIS 3D display as a sample device. Following the compensation step described above, the gamma relation is measured at first using a luminance meter (CA-310, Minolta) which is widely used in the display industry and is presented as shown in Fig. 9. Since a single 3D image is composed of millions of R/G/B pixel pairs from each odd/even line and it is impossible to verify each pixel data, we used four different experimental conditions to represent general cases of 3D images as shown in Table 1. The condition 1 can represent a mild case when the 3D image is mostly composed of simple components and there is only little change within a pixel pair from odd/even lines. In contrast, the condition 4 is related to an extreme case when the 3D image consists of complex objects and frequent changes of grayscale within a single pixel pair are included. The conditions 2 and 3 are representing moderate cases between them.
[TABLE 1.] Experimental condition
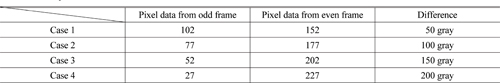
Experimental condition
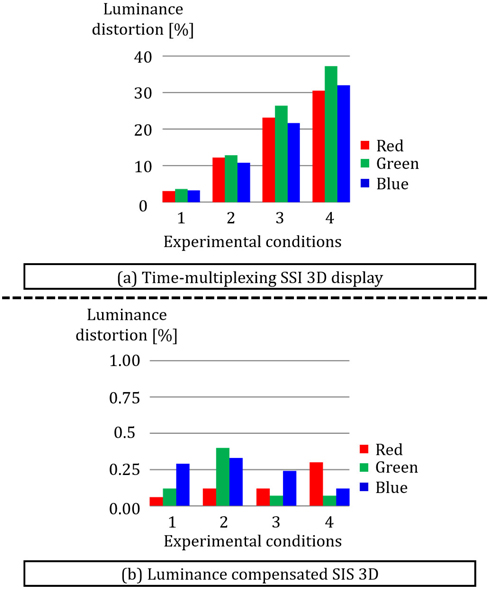
Figure 10 shows the comparison of experimental results. The luminance distortion is calculated from measured luminance of time-multiplexing SIS 3D technique using the high-speed luminance meter. The compensation is processed following the same procedure described in Chapter 3. In case of time-multiplexing SIS 3D display without compensation, the luminance distortion up to more than 30% occurred as shown in Fig. 10(a). Even though we admit that level of distortion is only in an extreme case (condition 4), there is also a distortion in a mild case (condition 1) around 5%.
In contrast, refer to the experiment results of luminance compensated SIS 3D technique, the luminance distortion is less than 0.5% for all experimental conditions. It means that the image data is well delivered to the observer as the principle of time-multiplexing SIS 3D display to provide an averaged image data of pixel pair from odd/even lines. Though only four representative cases were tested, experimental condition 4 is an extreme case and it is expected that most of the 3D images are within a milder condition. Therefore, it can be thought that the proposed method is verified through the preliminary experimental results.
There are other compensation methods available such as an overdriving method to fasten the response of the LC cell. However, the overdriving method has a limitation that there is no higher grayscale than the maximum one (255 gray for 8-bit image depth). Therefore, in an extreme case such as condition 4 in the preliminary experiments, there is only a little amount of overdriving margin and it is expected that the effect of the overdriving method will be reduced. Besides, our proposed method can be applied to any image data of difference range more than 200 gray and effectively reduces the distortion as shown in Fig. 10.
In this paper, we propose a luminance compensating method applied to a time-multiplexing SIS 3D display. The proposed method can compensate the luminance distortion in R/G/B color channels independently and reduces the distortion to less than 0.5% for a wide range of experimental condition. It is expected that the proposed method can be helpful to enhance the picture quality of the commercial time-multiplexing SIS 3D displays.