We present a novel and simple method to enable spatially selective ZnAl2O4 nanocrystal formation on the surface of B2O3-Al2O3-ZnO-CaO-K2O glass by employing localized laser heating. Optimized precipitation of glass-ceramics containing nanocrystals doped with Eu3+ and Yb3+ ions was performed by controlling CO2 laser power and scan speed. Micro-x-ray diffraction and transmission electron microscopy revealed the mean size and morphology of nanocrystals, and energy dispersive x-ray spectroscopy showed the lateral distribution of elements in the imaged area. Laser power and scan speed controled annealing temperature for crystalization in the range of 1.4-1.8 W and 0.01-0.3 mm/s, and changed the size of nanocrystals and distribution of dopant ions. We also report more than 20 times enhanced downshift visible emission under ultraviolet excitation, and 3 times increased upconversion emission from Eu3+ ions assisted by efficient sensitizer Yb3+ ions in nanocrystals under 980 nm excitation. The confocal microscope revealed the depth profile of Eu3+ ions by showing their emission intensity variation.
Over the past few decades, nanostructure materials have been the subject of much interest due to their remarkable physical properties such as decreased size, increased surface to volume ratio and novel morphologies. ZnAl2O4 is a well-known spinel oxide and a wide band gap (3.8 eV) semiconductor [1]. It is of interest due to its properties such as high mechanical resistance, high thermal stability, low temperature sinter ability, low surface acidity, and good diffusion. Glass-ceramics [2] bring advantages of low phonon energy as well as their physical and chemical stability. Rare-earth ions doped in ZnAl2O4 crystals may improve the emission properties. Among lanthanides, Eu3+ ion is widely investigated, as it is one of the favorite rare-earths for display devices due to its intense and sharp 4f-4f transition in orange/red regions [3]. Yb3+ions are also widely used for infrared-to-visible upconversion applications [4]. The glass-ceramics containing nanocrystals doped with rare-earth ions can be used for efficient solar-cells [5] by using an upconversion process, because solar-cell material with high band gap such as amorphous silicon loses near-infrared above 730 nm of the solar spectrum [6]. A multiply doped system may improve upconversion characteristics because a rare-earth ion has many absorption levels in the near-infrared. Recent reports on the Eu and Yb codoped glass-ceramics showed efficient infrared-to-visible upconversion [7-9]. Eu3+ ions are also known to be hypersensitive to local environment showing different features inside glass and nanocrystals [9].
Glass-ceramics are fabricated using controlled heat treatments in an electric furnace, and nanocrystals are formed in the interior of the glass. Recently, laser irradiation of glass has been reported as an alternative method for glass-ceramic formation with an advantage of spatially selected structural modification and crystallization inside glass [10, 11]. We applied the CO2-laser-induced crystallization technique to a multi-component B2O3-Al2O3-ZnO-CaO-K2O glass. In this work, we report the precipitation of spatially selective glass-ceramics containing ZnAl2O4 nanocrystals doped with Eu3+ and Yb3+ ions, and their surprising enhancement of down-shift and upconversion emissions in the visible.
The nominal component of precursor glass (as-melted) used in this study was 37ZnO-35H3BO3-3Al2O3-10K2O-10CaCO3-4Yb2O3-1Eu2O3. The raw materials used for preparation were fine grained powders from high purity commercial chemicals. Starting batches were thoroughly mixed and melted at 1350℃ for 1 h in a covered alumina crucible under normal atmosphere. Then, the melt was cast into an iron mold before being annealed at 530℃ for 10 h to release inner stress. Finally, the glass was cut and polished into the glass samples with thickness of 1 mm. For thermal treatment to induce ZnAl2O4 nanocrystals, we performed two types of scans. We scanned a 1.4-1.8 W CO2 laser beam with various speeds in the range of 0.01-0.3 mm/s. The laser beam width was ~200 µm diameter on the surface. We employed micro-X-ray diffraction (D/MAX RAPID-S) analysis for the irradiated and unirradiated regions to confirm the nanocrystal formation. Furthermore, to clarify the size and morphology of nanocrystals and rare-earth ion distribution inside nanocrystals, we performed transmission electron microscopy (TEM, Titan G2 60-300) and energy dispersive spectroscopy (EDS) mapping analysis for the laser-treated surface. Photoluminescence and upconversion emission spectra for Eu3+ ions under 365 nm LED and 980 nm LD excitations, respectively, were measured with 1 nm resolution for both unirradiated and irradiated glass areas to clarify whether the ions are doped inside the nanocrystals.
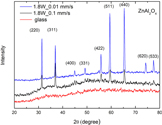
Figure 1 shows micro- x-ray diffraction patterns of glasses unexposed and exposed to CO2 laser with 0.1 and 0.01 mm/s scan speeds and 1.8 W power. Unexposed glass does not show any apparent diffraction peaks. In contrast, the exposed area of glass shows several narrow and relatively intense peaks indicating the diffraction pattern of the ZnAl2O4 crystalline phase. The broad humps are due to its amorphous structure in the untreated volume, and are almost the same as those from the untreated glass sample as shown in the lower scan [12]. This implies that the volume of the glass treated by CO2 laser irradiation was changed into glass-ceramics. While the x-ray beam has a slightly smaller size than the laser beam on the surface and penetrates the sample, the laser thermal treatment is effective only around the surface because of low thermal conductivity of glass. Thus, most of the sample volume exposed to x-ray beam produces amorphous feature in the XRD pattern. The sharp diffraction peaks are easily assigned to the diffractions from (2 2 0), (3 1 1), (4 0 0), (3 3 1), (4 2 2), (5 1 1), (4 4 0), (6 2 0), and (5 3 3) planes of spinel ZnAl2O4 phase (PDF-No. 01-070-8209 and JCPDS No. 05-0669). The average size of the nanocrystals has been calculated using the Scherrer formula [13] for XRD data of the lattice plane (
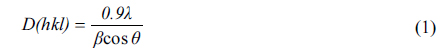
The size was estimated as 5 nm. Thus, the spectral properties of precipitated crystalline ZnAl2O4 are similar to those of zinc aluminate spinel single crystals. Very sharp XRD peaks from the glass-ceramics by scanning at much slower rates of 0.01 mm/s implies that the accumulated thermal energy due to slow scan increases nanocrystal sizes. The estimated average sizes of ZnAl2O4 nanocrystals are about 30 nm. Increase of XRD peaks indicates the increased density of nanocrystals in glass-ceramics.
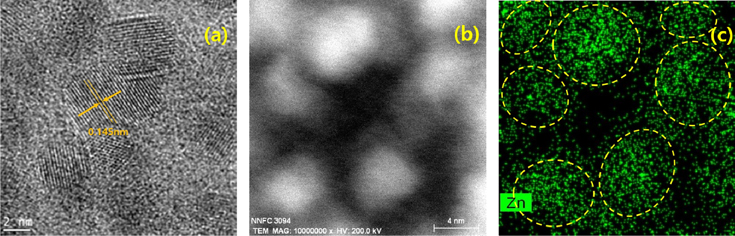
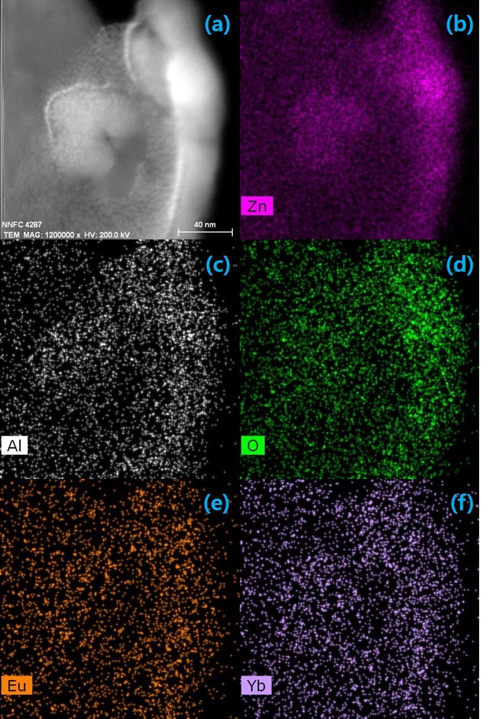
In order to confirm the XRD identification of crystalline phases, high resolution transmission electron microscopy (HRTEM) was employed. The HRTEM images of the glass-ceramics obtained by using fast scanning are presented in Fig. 2(a). It can be seen that most of the particles are in the size range estimated from XRD analysis. The lattice spacing of the chosen nanoparticle in the HRTEM image was measured as 0.145 nm, corresponding to the (440) plane of ZnAl2O4. It has been also reported that rare-earth ions are highly populated in the nanocrystals in EDS mapping [14]. Figures 2(b) and 2(c) showed Zn ions are concentrated on nanocrystals. However, we could not observe dense distribution of rare-earth ions inside nanocrystals. It implies that only a small portion of rare-earth ions were diffused into nanocrystals due to short exposure time. In contrast, spatial distribution of rare-earth ions in the glass treated by slow laser scanning was revealed as shown in Figs. 3(e) and 3(f). Most of Zn, Al, and O ions in Figs. 3(b)-3(d) are distributed in ZnAl2O4 nanocrystals in Fig. 3(a), and the estimated size of nanocrystals is larger than 30 nm. The results show that more thermal energy due to slower scan increases not only nanocrystal size but also diffusion rate of rare-earth ions into nanocrystals.
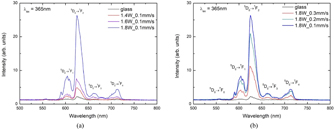
Down-shifting emission spectra of glass-ceramics under 365 nm excitation showed 3~22 times enhanced emissions of Eu3+ ions in the range from 1.4 to 1.8 W excitation power at speed of 0.1 mm/s as shown in Fig. 4(a). The high sensitivity of the emission intensity on the excitation laser power implies that the power range corresponds to the crystallization temperature range of ZnAl2O4 nanocrystals. Specially, 1.8 W is the optimized laser power, because we observed some surface damage with 2.0 W power. Enhanced down-shift emission is assumed to be an evidence of Eu3+-doped ZnAl2O4 crystal formation, because it can be described to suppressed nonradiative relaxation of rare-earth ions incorporated into nanocrystals with low phonon energy of 840 cm-1 [15]. The Eu3+ ion diffusion into ZnAl2O4 nanocrystals results in higher ion density in them, showing enhanced radiative relaxation. The emission peaks are clearly identified with the 5D0 - 7F1-4 transitions of Eu3+ ions. Little emission in the range of 400 - 580 nm region under 365 nm excitation indicates effective nonradiative relaxation from the higher states to the 5D0 state. The emission from the 5D0 state in the glass-ceramics increased depending on the laser scan speed as shown in Fig. 4(b). The scan speed is in inverse proportion to laser exposure. The slower scan provides more accumulated energy and time to the surface, precipitating nanocrystals and incorporating rare-earth ions into them. Three times slower speed of 0.1 mm/s rather than 0.3 mm/s increased the emission intensity about three times. It produced 27 times stronger emission than glass emission. However, the overall intensity from the surface treated with 0.2 mm/s is slightly weaker than that treated with 0.1 mm/s. It indicates that the emission intensity is not proportional to exposed energy, because it is sensitive to the selected position of the surface exposed to the inhomogeneous CO2 laser beam.
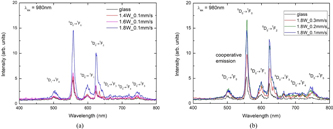
The up-conversion emission spectra obtained by the excitation at 980 nm showed interesting features in Figs. 5(a) and 5(b). Upconversion emission originates from nonlinear processes, and the overall emission intensity is much weaker than down-shift emission intensity. As the case of down-shift emissions, the glass ceramics treated with 1.8 W power showed dramatic change of up-conversion emissions. It is different from the typical quadratic dependence of upconversion emission, indicating the transition from glass to crystal phase in 1.8 W irradiation, as we also observed in the case of down-shift emissions. The glass-ceramics precipitated by the slower laser scan showed the stronger upconversion emissions as expected. However, the scan speed or exposure time does not give the stronger effect than the CO2 laser power.
The enhancement of Eu emission in the up-conversion also originates from effective energy transfer from Yb3+ to Eu3+ ions inside Eu3+ and Yb3+ co-doped ZnAl2O4 crystals. The spectra show additional peaks of 5D0 →7F0,5 and 5D1→7F0 that were not observed in the down-shift emission spectra. New emission from the 5D1 state at 490 nm can be explained by energy transfer due to good energy matching of the 5D1 state of Eu3+ ions and a virtual state of Yb3+ ions reached by two-step excitation via Yb3+-Yb3+ energy transfer [16]. The bands in the up-conversion emission are much narrower than those in the downshift emission. It implies that the two-step excitation and energy transfer are effective only for some subgroups among inhomogeneously distributed sites of Eu3+ and Yb3+ Ions.
Shinozaki
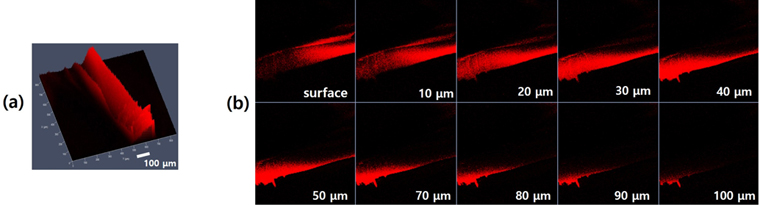
The excitation laser wavelength was 405 nm. The line shape in Fig. 6(a) is due to the linear scan of the CO2 laser scan. We observed the fluorescence image from the surface down to 100 µm in Fig. 6(b), implying that the nanocrystals were precipitated about 100 µm below the surface. Glass-ceramics generate much enhanced emission, indicating potential applicability for display materials or efficient solar cells.
The glass-ceramics containing Eu and Yb ion doped ZnAl2O4 crystals on the glass surface were prepared by focused CO2 laser beam irradiation. We provided thermal energy to reach the crystallization temperature by controlling the laser power in the range of 1.4-1.8 W and the laser scan speed in 0.01-0.3 mm/s. The focused laser beam diameter was about 200 µm. Formation of doped nanocrystals of 5-30 nm size was confirmed by XRD and TEM analysis. More than 20 times enhanced red emission from the glass ceramics treated by 1.8 W and 0.1 mm/s also gives the evidence of Eu ion-doped nanocrystal formation. Detailed upconversion mechanisms for the observed emissions were suggested based on the observed results. Laser-assist localized nanocrystal formation techniques may be applicable to patterned display and efficient solar cell development.