Position estimation of a sound source based on time difference of arrival at an array of three acousto-optic sensors is introduced. Each sensor consists of a Mach-Zehnder interferometer including a sensing part in one arm that is a piece of fiber surrounded by membrane in order to enhance the acousto-optic effect. Estimation error of a recorded gunshot sound signal was evaluated with the theoretically calculated values for two different locations.
A microphone is well known as a useful means of detecting sound waves and visualizing sound fields. For a microphone array far away from the sound source, we can extract information on its location using differences in arrival times. The accuracy of estimating a location depends mainly on the bandwidth and sensing ability of the microphone used, and the use of an instrument-grade condenser type microphone is a good example of enhancing detection ability. However, this electrical microphone array still has a problem in that it is difficult to build a sensor network and the microphone is weak in the presence of electromagnetic noise. As an alternative, fiber-based optical sensors using the acousto-optic effect have been studied with the advantage of using fiber as the sensor itself as well as the signal transmission medium. This optical sensor provides extremely wide bandwidth and long transmission due to low optical loss [1] and can operate well and safely in harsh environments like at sea or in oil wells since there is no current in the sensing unit [2].
Optical sensors to detect sound usually use optical interferometry such as Fabry-Perot, Sagnac, Michelson, and Mach-Zehnder [3-6]. Recently, a number of distributed position detection methods over a long distance (around 60 km) using a double Mach-Zehnder interferometer (MZI) have been reported [7, 8]. These studies mainly focused on detection of possible events over a long distance fiber based on acousto-optic sensing. In our previous research, we introduced a position estimation process called the received signal strength indicator method using optical acoustic sensors [9].
In this paper, we propose an array of three optical sensors using the acousto-optic effect to detect the location of a sound wave source. Each optical sensor is based on MZI and a piece of one fiber arm is used as a sensing part. To enhance the acousto-optic effect, the fiber chiefly exposed to the sound is surrounded by a membrane with a cork support. By calculating the distance-dependent arrival time of a sound signal at each sensor, the direction of the location could be deduced. This estimation might be superior to intensity-based position detection that suffers from unwanted noise caused by optical power reflected from other objects.
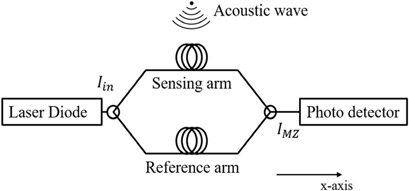
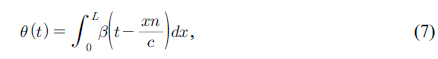
The conventional MZI is shown in Fig. 1. The output intensity of the MZI (coupling ratio, 50:50),
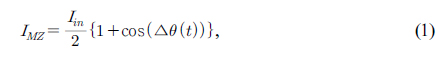
where
where
where
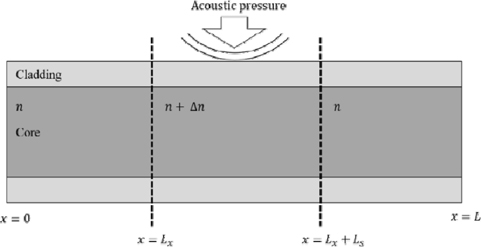
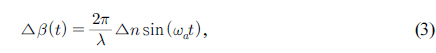
Figure 2 shows the pressure-induced refractive index of fiber exposed to an acoustic wave. By using Eq. (3), propagation constants of the sensing arm

where

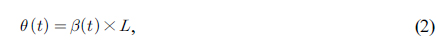
As shown in Fig. 1, a part of the sensing arm with length
where is used instead of
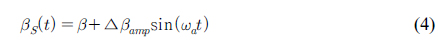
From Eqs. (5) and (7), the phase difference ∆
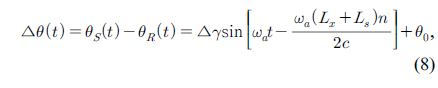
where
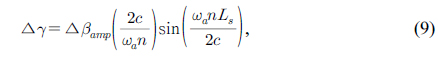
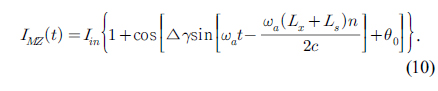
Since
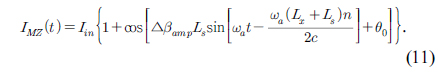
From Eq. (11), if we take ∆
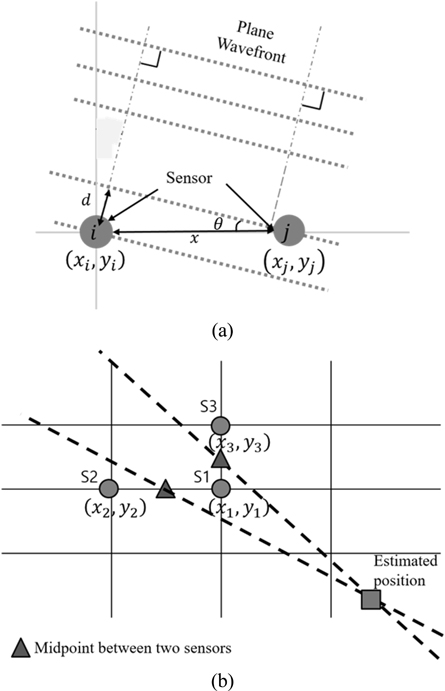
We can use time difference of arrival (TDOA) to detect the location of a sound source. Figure 3 illustrates the relationship between the distance of each sensor from the source and the angle related to different arrival times. To use the plane wave model, we assume that the distance between the sensors is much shorter than that between the sensor array and the sound source. The angle
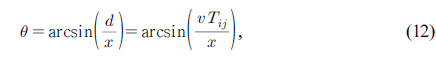
where
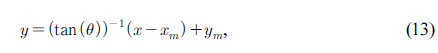
where
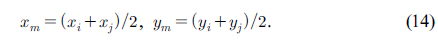
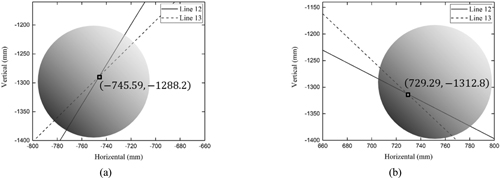
This line points out the position of the sound source estimated by the
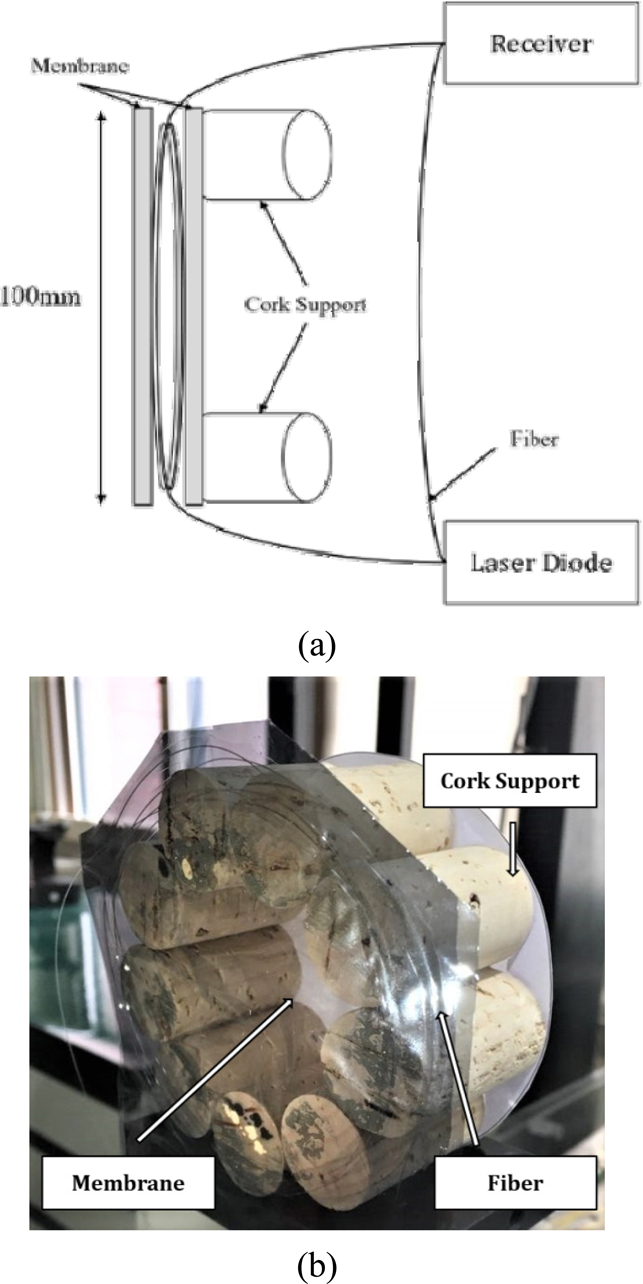
The optical sensor constructed is depicted in Fig. 4. To increase the refractive index change induced by the acoustic wave, a fiber with a diameter of a few hundred microns was wound with 5 turns. Two membranes acting as the diaphragm used in a conventional electrical microphone were attached to the fiber on both sides, and cork support was used for vibration isolation [12, 13]. The size of the membrane was about 100 × 100 mm. The remaining parts except for the sensing part, including the optical passive components, were sealed with sound absorbing material to avoid unwanted noise, and the optical bench was air isolated from the floor.
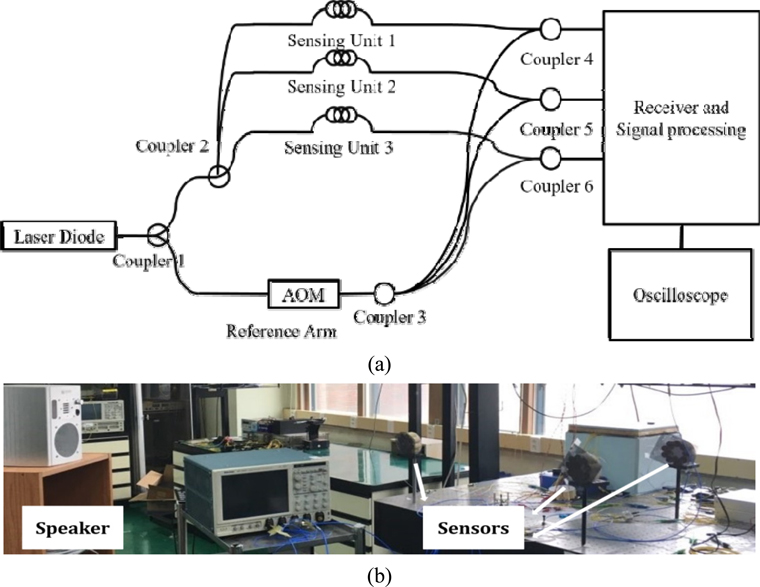
The experimental setup is depicted in the photograph in Fig. 5. A 1.55-µm laser diode was biased at dc to produce constant optical power, which was split into two through coupler 1: one to three optical sensors and the other to the acousto-optic modulator (AOM) used to avoid baseband noise. The upper power was again split into three through coupler 2 with each one propagating to the sensor. Output was combined through couplers 4-6 with one output (reference signal) from coupler 3 in order to obtain an interfered signal. After this, the interfered signal was detected at the receiver and converted into an electrical signal that was amplified and filtered to extract the frequency components corresponding to the acoustic wave. Finally, the sound wave was monitored with an oscilloscope.
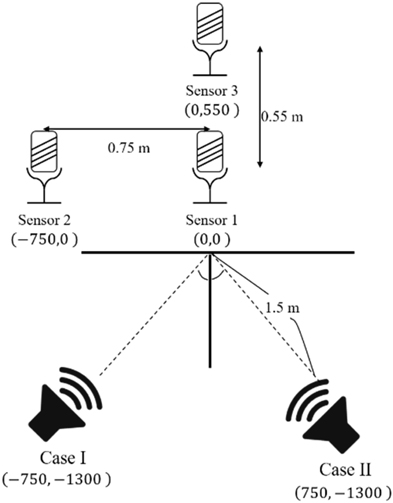
In this experiment, three optical sensors were arranged in a triangle with a horizontal length of 55 cm and a vertical length of 75 cm, as shown in Fig. 6. Position estimation was performed for two cases. In case I, the speaker was placed in front of the array at (−750 mm, −1300 mm) and for case II at (750 mm, −1300 mm). A recorded gunshot sound wave was employed as the sound source.
From the two signals extracted, two different angles
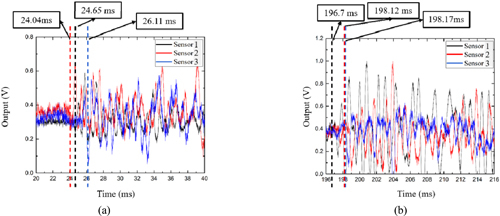
Figure 7 shows the gunshot waves detected by the optical sensors in the electrical time domain. The time delay between the sensors was calculated from the arrival times of the waves. In case I,
[TABLE 1.] Estimation error of the proposed method for case I and II
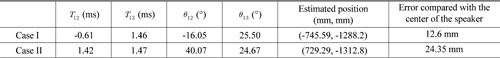
Estimation error of the proposed method for case I and II
It is likely that these errors were mainly due to the relatively short distance of about 1.5 m between the speaker and the sensor, the assumption of a plane wave, and a large dimension size, i.e. the relatively large size of the speaker and array compared to the distance between them. This could be improved by applying better algorithms for signal processing to estimate the position of arrival, like the minimum variance distortionless response beamformer, a best linear unbiased estimator, or a complex ambiguity function [14-16].
We demonstrated a position estimation method for a sound source using an array of three optical sensors. Each sensor was implemented based on an MZI structure. Especially, to increase the acousto-optic effect, the sensing fiber in one arm of the MZI was surrounded by membranes. The TDOA method was applied to estimate the direction of the sound source. Furthermore, estimation errors appeared to be tens of millimeters compared to the ideal center of the speaker in the presence of practical noises of electromagnetic interference and wall reflection. The proposed method could be used as a good estimation means through a distributed optical sensor network for a sound source placed far away.