The aerosol optical properties such as depolarization ratio (δ) and aerosol extinction-to-backscatter ratios (S, LIDAR ratio) and Ångström exponent (Å) derived from measurement with AERONET sun/sky radiometer at Gangneung-Wonju National University (GWNU), Gangneung, Korea (37.77°N, 128.87°E) during a winter season (December 2014 - February 2015) are presented. The PM concentration measurements are conducted simultaneously and used to identify the high-PM events. The observation period was divided into three cases according to the PM concentrations. We analysed the δ, S, and Å during these high PM-events. These aerosol optical properties are calculated by the sun/sky radiometer data and used to classify a type of aerosols (e.g., dust, anthropogenic pollution). The higher values of δ with lower values of S and Å were measured for the dust particles. The mean values of δ, S, and Å at 440-870 nm wavelength pair (Å440-870) for the Asia dust were 0.19-0.24, 36-56 sr, and 0.48, respectively. The anthropogenic aerosol plumes are distinguished with the lower values of δ and higher values of Å. The mean values of spectral δ and Å440-870 for this case varied 0.06-0.16 and 1.33-1.39, respectively. We found that aerosol columnar optical properties obtained from the sun/sky radiometer measurement are useful to identify the aerosol type. Moreover, the columnar aerosol optical properties calculated based on sun/sky radiometer measurements such as δ, S, and Å will be further used for the validation of aerosol parameters obtained from LIDAR observation as well as for quantification of the air quality.
Atmospheric aerosols are defined as suspended solid or liquid particles in the atmosphere. The atmospheric aerosols scatter or absorb incoming solar radiation, thus they can affect Earth’s radiation balance [1]. Atmospheric aerosols also play an important role in cloud formation by acting as cloud concentration nuclei (CCN). The Earth’s climate system can then be influenced by the clouds and precipitation [2-4]. The atmospheric aerosols reduce the visibility and are involved in various heterogeneous reactions in the atmosphere [5, 6]. The atmospheric aerosols can also contribute to a variety of human health problem [7].
East Asia is one of the important source regions of the atmospheric aerosols. These atmospheric aerosols originate from anthropogenic pollution, biomass burning, and dust regions, for instance, industrialized/populated regions in China, Russian forest areas, and desert regions. Korea is located in the downwind area of the Asian continent, thus Korea is frequently influenced by various atmospheric aerosols [8-10].
The climatic and environmental effects of atmospheric aerosols are critical issues in not only the regional community but also in global society. Nevertheless, assessment of climatic impacts of atmospheric aerosols is still a challenging matter due to variety of their sources, varying trends in aerosol loading and extreme heterogeneity in the temporal and spatial variability of their optical/microphysical characteristics [11]. Various aerosol types lead to different effects on the solar radiation spectral distribution [12]. Information on atmospheric aerosols at different heights is also important for understanding the variations of aerosol characteristics as well as the radiative influences particularly during the long-range transportation from source regions to Korea.
LIDAR (light detection and ranging) is a suitable method for studying the vertical properties of atmospheric aerosols. The depolarization ratio (δ) is a useful parameter to distinguish nonspherical particles such as dust or ice clouds among atmospheric aerosols [13]. The δ is used as an indicator of particle shape. The degree of depolarization decreases as sphericity of particles increases. The δ is typically obtained from the LIDAR observation [14, 15]. In the LIDAR research community it is widely used as a straightforward manner to identify the type of the atmospheric aerosols [16, 17]. Korean Meteorological Administration (KMA) has operated the Korean Aerosol LIDAR Observation Network (KALION, http://www.kalion.kr) since 2015 in order to integrate and utilize the LIDAR observation data in Korea. However, there is very limited data for the comparison or validation of aerosol properties obtained from LIDAR observation. Moreover, the LIDAR observation system involved in KALION is mostly an elastic LIDAR. Since the elastic backscatter LIDAR system does not provide the signal containing all of the information needed to fully resolve the LIDAR equation, aerosol extinction and back-scatter coefficient must be retrieved using assumed values such as the extinction-to-backscatter ratio (LIDAR ratio,
A sun/sky radiometer could also be used for retrieving spectral aerosol optical/microphysical properties [19]. The spectral radiance can be obtained from measurements of direct spectral solar and sky radiation using the sun/sky radiometer. The obtained radiances are used to retrieve aerosol characteristics such as Ångström exponent (Å), size distribution, refractive index, and single scattering albedo with an numerical inversion algorithm [20, 21].
Moreover, δ and
Up to now many studies on atmospheric aerosols in East Asia were conducted with aerosol parameters provided from AERONET such as refractive index and single scattering albedo [24-26], whereas, there are fewer studies for the retrieval of δ and
In this contribution the retrieval method of δ and
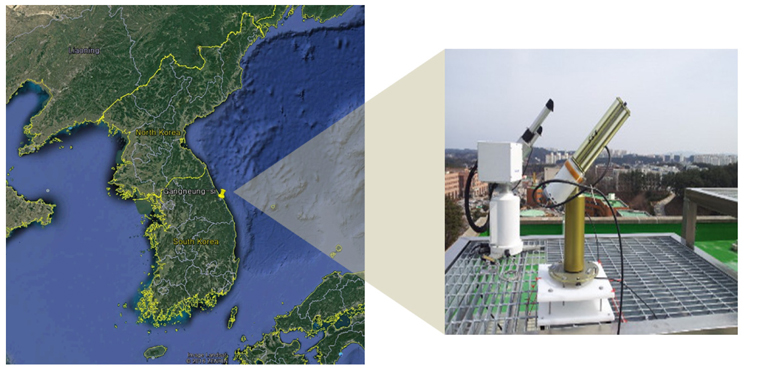
Observations for atmospheric aerosols were conducted by using sun/sky radiometer and PM measurement by gravimetric method and/or equivalent methods such as a β-ray absorption method at Gangneung, the northeastern part of the Korean peninsula (See Fig. 1) during the winter season. Gangneung is situated between the East Sea and the great Baekdu mountain ridge, and the site is approximately 5 km away from the east coast of the Korean peninsula.
A CIMEL 318-1 automatic tracking sun/sky radiometer has been operated on the rooftop of the research institute’s building at Gangneung-Wonju National University (GWNU) (37.77°N, 128.87°E, 60 meters above sea level) in order to monitor atmospheric environment of the northeastern part of Korea since 2012. This sun/sky radiometer measures direct solar radiation at 15-minute intervals and sky radiation at 1-hour intervals. The measured data are automatically sent to NASA Goddard Space Center for retrieval of aerosol optical/microphysical properties and radiative properties with a numerical algorithm [19]. The retrieved aerosol parameters are available at the webpage of the AERONET database (http://aeronet.gsfc.nasa.gov/). In the present study the Å, aerosol phase function, refractive index, particle size distribution (for radius range from 0.05 to 15μm), and single scattering albedo obtained from AERONET was used for the aerosol classification. Detailed information on the data retrieval algorithm for these aerosol parameters is given in Dubovik and King [20].
2.1.1. Depolarization Ratio
The δ is strongly dependent on particle sphericity. The δ can be calculated on the basis of data obtained from the sun/sky radiometer. Dubovik et al. [27] introduced kernel look-up tables for oblate and prolate particle shapes. The kernel look-up tables are used to infer the δ from the sun/sky radiometer measurement. We calculate δ at the four wavelengths (440, 675, 870, and 1020 nm) for the identification of the sphericity of aerosol particles. The retrieval method for δ with the sun/sky radiometer data can be briefly explained as follows:
The elements F11(λ) and F22(λ) of the so-called Müller scattering matrices [28] are calculated from the particle size distribution and the refractive index obtained from the AERONET. These parameters are strongly dependent on the angular and spectral distribution of the radiative intensity, which is measured by the sun/sky radiometer [29]. For the case of unpolarized incident light, F11(λ) is proportional to the flux of scattered light. The aspect ratio distribution is also needed in order to retrieve the δ. The aspect ratio describes the ratio of a particle’s longest axis to its shortest axis. For prolate particles the polar diameter is greater than the equatorial diameter. The AERONET model is retrieved with the assumption that the aspect ratio distribution is fixed, since scattering elements are mostly equivalent for all spheroid mixtures [27].
The δ then can be computed from the ratio of the elements F11(λ) and F22(λ) at the scattering angle of 180° as
2.1.2. Extinction-to-backscatter Ratio (LIDAR ratio; S)
The aerosol extinction-to-backscatter ratios (i.e., LIDAR ratio, denoted as
where, ω(λ) is the single scattering albedo at wavelength λ, P(180°, λ) is the phase function at 180° scattering angle and wavelength λ is linked to the ω(λ) and
2.2. Particulate Matter Measurement
Hourly averaged PM2.5 and PM10 concentrations, measured routinely at the Gangneung air quality observation site of the Korea Environment Corporation (KEC), were used to investigate the temporal variation of PM2.5 and PM10 concentration during the winter season of 2014-2015. The PM2.5 and PM10 concentrations are retrieved by the gravimetric method and/or the β-ray absorption method [30]. The observation site of KEC for the particulate matter is located within a maximum distance of approximately 2.5 km from the AERONET sun/sky radiometer observation site at GWNU. The PM2.5 concentrations are available from 2015 due to quality assurance of PM2.5 data. The KEC started to release the results of PM2.5 observation from 2015.
2.3. Analysis of Backward Trajectories and Satellite Data for Aerosol Source Tracking
In order to investigate the transport of atmospheric aerosols and source regions of particles, the HYSPLIT model [31] generates 120 hours backward trajectories for air masses arriving at the observation site. The results of the HYSPLIT model allows us to trace back the origin of the atmospheric aerosols affecting the atmospheric environment of the observation site during the high-PM events in this study.
The aerosol optical depth (AOD, τ) retrieved on the basis of data from the Moderate Resolution Imaging Spectro-radiometer (MODIS) on board Terra and Aqua satellites were also used to determine the intensity of atmospheric aerosols with respect to the pathway of aerosol transport. Terra and Aqua MODIS level 1b (L1B) calibrated radiance dataset, so-called MOD02 and MYD02 product (collection 6), were acquired from the NASA Goddard Earth science distributed active archive centre. MODIS L1B dataset includes calibrated and geolocated at-aperture radiances in W/m2/µm/sr for 36 bands across a 2,330 km wide swath. Temporal coverage for the daily data spans follow the observation period in this study. To derive τ from the MODIS L1B data, the MODIS satellite aerosol retrieval (MSTAR) algorithm is used. MSTAR has been developed for the acquisition for fine resolution τ based on a look-up table approach. The detailed descriptions for MSTAR algorithm are given by Lee et al. [32] and Lee and Kim [33]. The retrieval error of the τ by the MSTAR algorithm was reported to be <10% [33].
Figure 2 shows the temporal variation of PM10 concentration, PM2.5 concentration, and relative humidity, which are obtained from the air quality monitoring of KEC and Korean Meteorological Administration (KMA). During the observation period the mean value of PM10 was 62 ± 52 μg/m3 and the average of PM2.5 was measured as 22 ± 10 μg/m3 . The mean value of PM10 was measured as higher than an air quality guideline suggested by the World Health Organization (WHO), whereas the mean value of PM2.5 was measured as slightly lower than the air quality guideline of WHO (50 μg/m3, 25 μg/m3 for annual mean of PM10 and PM2.5, respectively). Moreover, the PM10 concentrations were peaked as high as 102 μg/m3, 98 μg/m3, and 363 μg/m3 on 29 December 2014, 11 February 2015, and 23 February 2015, respectively. The PM2.5 concentrations were also higher on these days. The high PM2.5 concentrations are measured as 49 μg/m3 and 52 μg/m3 for 11 and 23 February 2015, respectively. On a basis of this information, we divided the observation period into 3 cases (e.g., case I: 29-30 December 2014; case II: 10-11 February 2015; case III: 22-24 February 2015).
The average value of relative humidity for the entire observation period was 37 ± 13%. The mean values of the relative humidity are 38 ± 9%, 38 ± 1%, and 45 ± 13% for the cases I, II, and III, respectively. The corresponding values are summarized in Table 1. Cold and dry Siberian air masses usually influence the atmospheric environment in Korea during the winter season. The comparably lower relative humidity, measured during the observation period in this study, reflects this seasonal characteristic. The atmospheric aerosols observed in this study are considered to be less influenced by the moisture (i.e., less hygroscopic growth of particles).
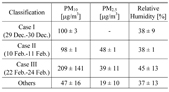
Average and standard deviation of PM10 concentration, PM2.5 concentration, and relative humidity for each classified case observed at Gangneung, Korea during a winter season (December 2014 - February 2015)
The spectral δ and the
We speculate that the aerosols that affected the atmospheric environment during the observation period originated from different aerosol sources.
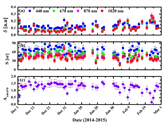
We classified the observation period into 3 according to the PM concentrations. The optical characteristics of atmospheric aerosols affecting each divided case are significantly different as shown in Fig. 4. The δ at 440 nm, 675 nm, 870 nm, and 1020 nm are 0.16 ± 0.08, 0.08 ± 0.03, 0.07 ± 0.01 for case I, 0.09 ± 0.02, 0.07 ± 0.02, 0.08 ± 0.02, and 0.06 ± 0.05 for case II, and 0.19 ± 0.01, 0.21 ± 0.02, 0.23 ± 0.04, and 0.24 ± 0.04 for case III, respectively. The δ is useful parameter for the identification of particle shape. For instance, high δ (~0.3) is considered as pure dust, which represents nonspherical particles [17, 34], whereas lower δ indicates the increase of spherical particles such as anthropogenic pollutants [17]. The values of δ measured during case III is considered to mean that the dust particles dominantly influenced the air quality of the observation. The δ for case III is measured as high as for dust particles (0.19-0.24). The δ for pure dust tends to decrease at 440 nm, whereas δ measured at other wavelengths increases [22].
In contrast with case III, lower values of δ are dominantly found in cases I and II. It is considered that the sphere-like particles such as anthropogenic particles are dominant. Anthropogenic plumes normally consist of spherical particles, for which lower values of δ dominate [35]. The values of δ decrease as the sphericity of particles increases. The δ for urban aerosol particles are measured as 0.03-0.07 at 532 nm [35].
The lower value of δ at 440 nm for case III might be caused by these strong light-absorption substances in dust particles. The light-absorption capacity of dust is strong in ultraviolet regions of the solar spectrum. The Asian dust particles observed in East Asia usually contain Fe2O3 or Al2O3, SiO2, and clays, which are known to have strong light-absorption characteristics at ultraviolet wavelengths. [19, 36-38]. In contrast with this, the other cases are less influenced by the dust particles. It is more likely to be influenced by the atmospheric particles, which have weaker light-absorption properties at 440 nm. As a result, the optical properties of atmospheric particles for each individual case are easily distinguishable.
The
The
In contrast, the higher values of
The Å440-870 obtained from AERONET for the individual cases differ significantly. The mean values of Å440-870 were 1.33 ± 0.17, 1.39 ± 0.02, and 0.48 ± 0.32 for cases I, II, and III, respectively. The Å is a useful parameter to identify the size of particles. Higher values (>1) are typically measured for accumulation-mode particles, whereas lower values (~0) are referred to as coarse-mode particles such as Saharan dust or Asian dust. The values between 0.2 and 0.3 are reported as the values of Å for dust particles. The values of Å ranged between 0.8 and 1.4 were found for heavily polluted continental aerosols [43-46]. The mean value of Å440-870 for case III was similar to the value of Å measured and reported as dust particles. On the other hands, the averages of Å440-870 for cases I and II are considered as accumulation-mode particles (e.g., anthropogenic or biomass burning particles).
The corresponding values of δ,
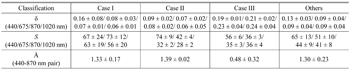
Averaged and standard deviation of as δ, S, and A440-870 derived from AERONET sun/sky radiometer data for each classified case at Gangneung, Korea during a winter season (December 2014 - February 2015)
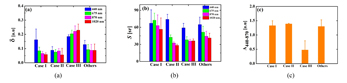
The HYSPLIT model with archived National Centre for Environmental Prediction (NCEP) reanalysis data is used to retrieve the backward trajectories of air masses that reached the observation site. 120 hour backward trajectories conditions for the arrival height were used for the HYSPLIT model for each classified case. The results of the HYSPLIT model are shown in Fig. 5. The significant differences in the transport route of air masses among the cases were found. As shown in Fig. 5(a), HYSPLIT model results show that the air mass that was observed during case I had predominantly passed over industrialized/populated regions of China before it arrived at the observation site. The air masses for case II also show similar pattern compared to case I. However, the air masses for case II penetrated the regions of North Korea before arrival. On the other hands, the HYSPLIT results show that the air mass mainly originated from desert areas in the Asian continent (e.g., Gobi desert) for case III.
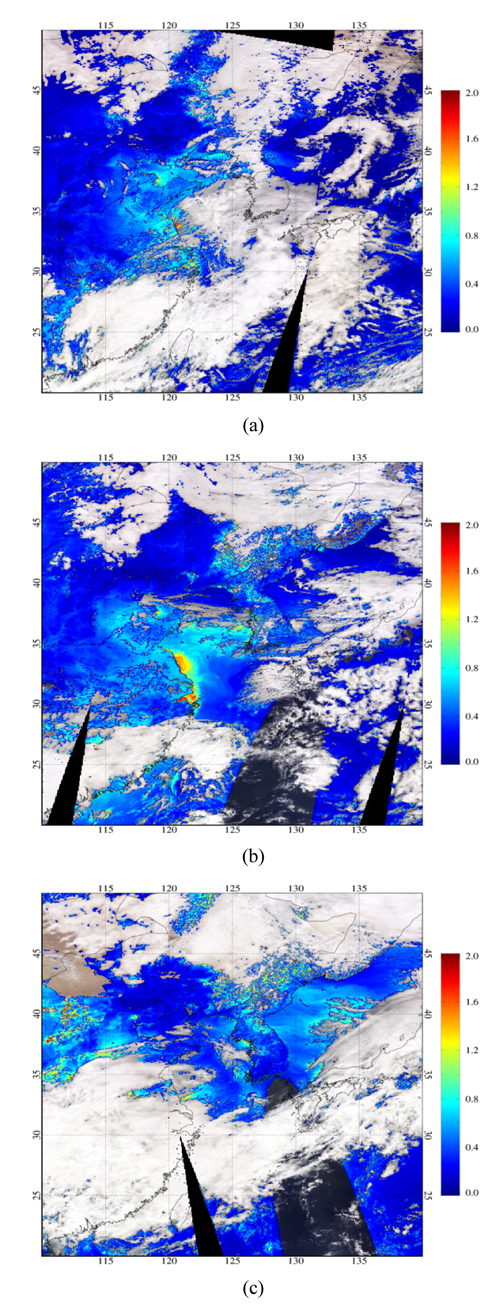
In order to estimate the spatial pattern of aerosols, satellite derived aerosol data were used. Figure 6 shows MODIS-retrieved τ at 550 nm combined MODIS RGB (red, green, and blue) colour composite image of North-East Asia for each individual case.
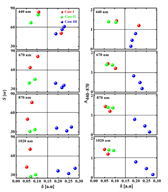
In case I higher τ were observed over industrialized/populated regions of China. These aerosol plumes with high τ from China are considered to lead the high-PM10 events for case I. Similarly, the higher value of τ was observed over the industrial area of China (around Shandong peninsula) for case II. The high values of τ were also measured around the region of North Korea for case II.
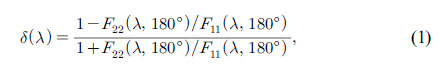
The dust particles can be distinguished with RGB image in case III. The dust aerosols are clearly seen around the Gobi desert regions for the case III. High τ values ranged from 1.2 to 1.8 around this region indicate that Asian dust plumes originated in the desert region and were transported from there to the Korean peninsula.
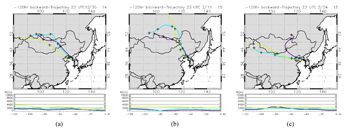
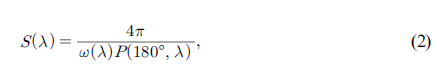
Figure 7 shows the scatterplot of
The correlation of δ with Å440-870 is significantl and clear. The influence of non-spherical particles (dust particles which show high δ) on the backscattered light decreases with increasing Å440-870. The higher values of δ were found with the lower values of Å440-870 for case III. However, the higher values of Å440-870 for cases I and II were found in the domain where the δ are measured as lower. Higher values of Å with lower values of δ indicate a considerable concentration of anthropogenic aerosol plumes.
The results of the
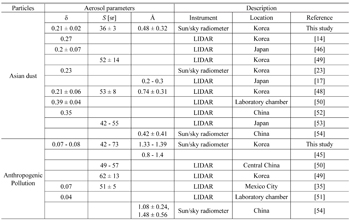
Values of δ, S, and A440-870 for dust and anthropogenic pollution measured in this study and worldwide locations
In this study the aerosol optical properties such as δ,
The optical properties of atmospheric aerosols for each classified case significantly change depending on the type of aerosols. We found lower values for the
Although cases I and II show similar values for δ and Å440-870, the mean value of
Our results suggest that the aerosol classification can be conducted by the utilization of optical properties such as δ,