검색 전체 메뉴
PDF
맨 위로
OA 학술지
Polarity Index Dependence of M13 Bacteriophage-based Nanostructure for Structural Color-based Sensing
  • 비영리 CC BY-NC
  • 비영리 CC BY-NC
ABSTRACT

Color sensor systems based on M13 bacteriophage are being considerably researched. Although many studies on M13 bacteriophage-based chemical sensing of TNT, endocrine disrupting chemicals, and antibiotics have been undertaken, the fundamental physical and chemical properties of M13 bacteriophagebased nanostructures require further research. A simple M13 bacteriophage-based colorimetric sensor was fabricated by a simple pulling technique, and M13 bacteriophage was genetically engineered using a phage display technique to exhibit a negatively charged surface. Arrays of structurally and genetically modified M13 bacteriophage that can determine the polarity indexes of various alcohols were found. In this research, an M13 bacteriophage-based color sensor was used to detect various types of alcohols, including methanol, ethanol, and methanol/butanol mixtures, in order to investigate the polarity-related property of the sensor. Studies of the fundamental chemical sensing properties of M13 bacteriophage-based nanostructures should result in wider applications of M13 bacteriophage-based colorimetric sensors.


KEYWORD
Bacteriophage , Color sensor , Polarity index , Nanostructure , Self-assembly
  • I. INTRODUCTION

    M13 bacteriophage is a novel biomaterial that can construct unique nanostructures due to its self-assembly property. Innovative structures fabricated using M13 bacteriophage have been used to produce piezoelectric nanostructures, virus-based full-color pixels, and highly effective surface plasmon resonance (SPR) sensors [1-10]. Furthermore, in less than a decade, M13 bacteriophage-based color sensor systems have shown great potential for the detection of cancer cells and various target chemicals, such as TNT, antibiotics, and endocrine-disrupting chemicals (EDCs) [11-19]. The natural filamentous structure of M13 bacteriophage comprises 2,700 copies of pVIII major coat proteins in its body and five copies of minor coat proteins (pIII and pIX) at its ends. The M13 bacteriophage is conical in shape, has a length of approximately 880 nm and a diameter of approximately 6.6 nm, and has a highly regular α-helical structure that lacks inversion symmetry.

    In this study, M13 bacteriophage was genetically engineered using a phage display and recombinant DNA technique to produce the designed physico-chemical characteristics. Using this approach, we genetically engineered the pVIII N-terminus with four negatively charged amino acid (glutamate, E) groups. In particular, the major coat protein was modulated to express a Glutamate (E)-Glutamate (E)-Glutamate (E)-Glutamate (E) sequence by replacing Ala-Glu-Gly-Asp-Asp residues (wild type) with Ala (A)-Glu (E)-Glu (E)-Glu (E)-Glu (E)-Asp (D) residues (4E type) in order to increase the M13 bacteriophage dipole moment directed from the amino- to carboxy-terminal direction. The surface of this 4E type M13 bacteriophage has a high-density negative charge and enables the use of this bacteriophage in various applications owing to its piezoelectric properties and strong binding affinity for many chemicals [12, 19]. For example, M13 bacteriophage-based colorimetric sensors change in color due to the swelling and deswelling of the virus bundle structure upon exposure to target molecules that show binding affinity with the genetically engineered M13 bacteriophage [16, 19, 20]. However, despite the success of M13 bacteriophage-based color sensor systems and other applications, the lack of fundamental studies of M13 bacteriophage-based nanostructures has inhibited further progress in this area. Therefore, more basic research on the M13 bacteriophage properties is necessary. In this study, we investigated the polarity dependence of M13 bacterio-phage using multiple alcohols and nonpolar solvents and a mixture of alcohols with different polarity indexes.

    II. METHODS

    M13 bacteriophage was purchased from New England Biolabs. All chemicals were purchased from Sigma-Aldrich and used without further purification unless mentioned otherwise.

    Genetic Engineering of M13 Bacteriophage and Mass Amplification M13 bacteriophage was genetically modified using a recombinant DNA engineering technique, as described in previous reports [1, 19]. Briefly, using the inverse polymerase chain reaction (PCR) cloning technique, the first (alanine) and fifth (aspartate) amino acid of the N-terminus of pVIII protein of wild-type M13 bacteriophage were replaced with the desired peptide residues. Stable peptide sequences were found using the phage display technique, and the position of primer insertion was selected by natural selection pressure by the Escherichia coli host. The obtained sequence was verified via DNA sequencing by Cosmo Gentech (Daejeon, Korea), and the genetically engineered M13 bacteriophage was amplified using the E. coli host.

    Fabrication of M13 Bacteriophage-based Structural Color Sensor M13 bacteriophage-based color sensors were fabricated using a simple pulling method [11-13]. The obtained color bands comprised M-13 bacteriophage through its self-assembly property, which could be controlled by changing the concentration of the bacteriophage solution and by varying the pulling speed between 10 and 100 μm min−1. The M13 bacteriophage solution (6 mg ml−1) was prepared using Tris-buffered saline (12.5 mM Tris and 37.5 mM NaCl, pH 7.5) and by controlling the pulling speed using a programmable syringe pump (KD Scientific Co., LEGATO 270). The obtained M13 bacteriophage-based color sensors exhibited three distinguishable color bands on gold-coated Si wafers (thickness = 525 μm; 100 nm of gold on a titanium adhesion layer, Platypus Co.).

    Detection of Various Alcohols and Mixtures Sample detection using M13 bacteriophage-based color sensors was performed using an in-house detection system [4-6]. 100 ppm of methanol, ethanol, 1-propanol, 1-butanol, benzene, and cyclohexane were injected into a sealed heated (60 °C) chamber through an inlet tube. Additionally, 100 ppm of methanol/butanol mixtures of 5%, 25%, 50%, and 75% as well as 95% methanol in 1-butanol (volume %) were injected. Alcohol mixtures were detected a manner same as that of detecting single alcohols. An M13 bacteriophage-based color sensor was placed on the top of the chamber and viewed with a microscope equipped with a CCD camera (Celestron, LLC.). Real-time ΔRGB intensity data and images of the color sensors were collected using MATLAB (MathWorks, Inc.). To prevent unwanted compensation brightness associated with the external light interference, the color sensor was shielded from the incident light. RGB signals and sensor images were captured every second, and all experiments were performed at least three times. In addition, mean values and standard errors were calculated.

    III. RESULTS AND DISCUSSION

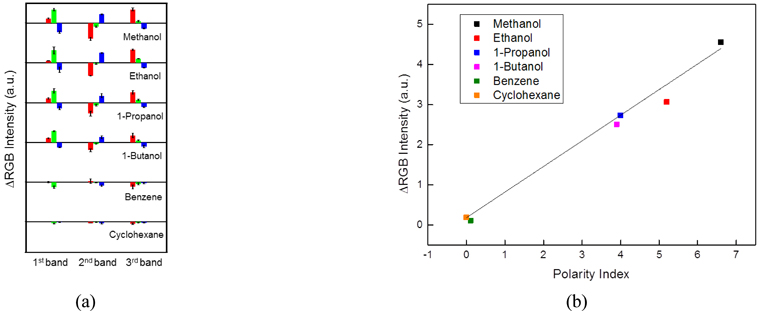
    To investigate the relation between the polarity index and reactivity with the M13 bacteriophage-based color sensor, we measured methanol, ethanol, 1-propanol, and 1-butanol using the color sensor. Additionally, benzene and cyclohexane were included in order to investigate the effects of lower polarity indexes and nonpolar solvents. Figure 1(a) shows the ΔRGB intensities of each band of the color sensor upon exposure to alcohols and organic solvents. During all measurements, the M13 bacteriophage-based color sensor showed distinctive color changes that were affected by the type of target chemicals due to the different polarity indexes of the solvents. The polarity indexes of the solvents were as follows: methanol (6.6), ethanol (5.2), 1-propanol (4.0), 1-butanol (3.9), benzene (0.11), and cyclohexane (0). All measurements were performed under the same conditions and concentration. It was found that the intensity changes of all three bands increased consistently with increasing solvent polarity. Figure 1(b) shows the polarity dependence of the ΔRGB signals. The solid line in Fig. 1(b) corresponds to one of the most distinct signal forms of all bands: the blue signal of the first band; the R2 value of the line was 0.983, and its slope was 0.639, indicating that a linear relation exists between ΔRGB intensity and the target chemical polarity due to the dipole moment of the M13 bacteriophage surface. All intensity values were calculated by subtracting initial ΔRGB values from the final values.

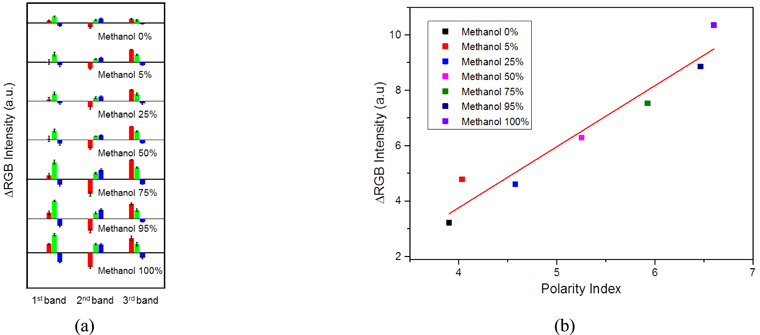
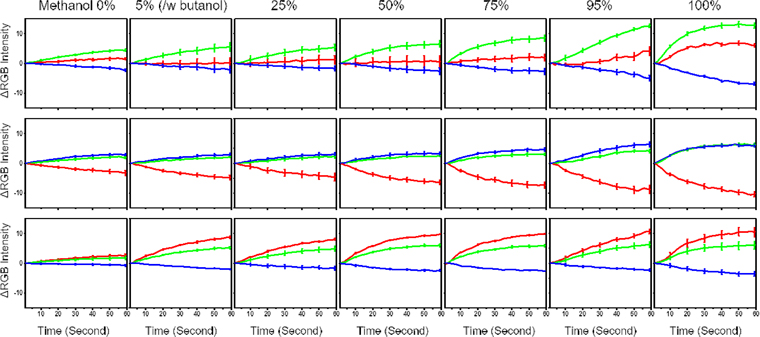
    To confirm the relation between the M13 bacteriophage-based color sensor and the polarity index, we performed the measurements of methanol/1-butanol mixtures in various ratios. The polarity index of methanol is 6.6, whereas that of 1-butanol is 3.9. For the mixtures containing 5%, 25%, 50%, 75%, and 95% of methanol, the polarity indexes were 4.035, 4.585, 5.25, 5.925, and 6.465, respectively. Here, the percentage indicates the volume %; therefore, methanol 0% in Fig. 2 corresponds to 100% of 1-butanol. The percentage of other mixtures correspond to the mixture compositions in the same manner. Figure 2(a) shows a consistent increase in ΔRGB intensity when the M13 bacteriophage color sensor was exposed to the mixtures containing increasing methanol fractions. The solid line in Fig. 2(b) corresponds to the red signal, i.e., the second band. In this case, the R2 value was 0.928 and the slope of the solid line was 2.205. These results show that a linear increasing relation exists between the color sensor’s ΔRGB intensity and the percentage of methanol present in the solution. Real-time ΔRGB intensity data are shown in Fig. 3. All intensity values were calculated by subtracting the initial values from the final color component values.

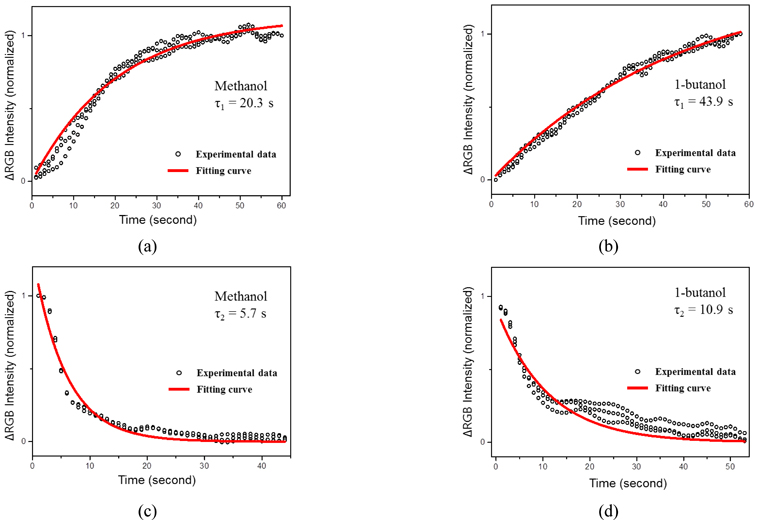
    Finally, we calculated the response times of the M13 bacteriophage-based color sensor after exposure to methanol and 1-butanol (polarity indexes 6.6 and 3.9, respectively). The time constants τ1 (response time) and τ2 (recovery time) were determined by fitting the ΔRGB intensities i(t) obtained by the measurements to the following equations:

    image

    where a is the fitting constant and t is time in seconds [13].

    Figure 4 shows the fitting results used to obtain the time constants for methanol and 1-butanol by performing measurements using the M13 bacteriophage-based color sensor. The response times to methanol and 1-butanol were 20.3 and 43.9 s, respectively, and the recovery times were 5.7 and 10.9, respectively. In both cases, the results were nearly twice as large for 1-butanol, which presumably was due to the difference in the polarity indexes of methanol and 1-butanol. All measurements were repeated three times to ensure accurate fitting.

    IV. CONCLUSION

    We measured and studied the polarity index-dependent characteristics of the developed M13 bacteriophage-based color sensor using different alcohols and methanol/butanol mixtures. The reactivity of the 4E-type M13 bacteriophage-based color sensor with these alcohols was found to be proportional to the polarity. The lack of fundamental studies of the M13 bacteriophage chemical properties has inhibited the progress in the field. We believe that studies on the polarity-related properties of M-13 bacteriophage-based nano structures will result in new smart applications for M13 bacteriophage-based colorimetric sensors.

참고문헌
  • 1. Shin D.-M., Han H. J., Kim W.-G., Kim E., Kim C., Hong S. W., Kim H. K., Oh J.-W., Hwang Y.-H. (2015) “Bioinspired piezoelectric nanogenerators based on vertically aligned phage nanopillars,” [Energyu & Environmental Science] Vol.8 P.3198-3203 google cross ref
  • 2. Kim W.-G., Kim K., Ha S.-H., Song H., Yu H.-W., Kim C., Kim J.-M., Oh J.-W. (2015) “Virus based Full Colour Pixels using a Microheater,” [Scientific Reports] Vol.5 P.13757 google cross ref
  • 3. Kim W.-G., Song H., Kim C., Moon J.-S., Kim K., Kim S.-W., Oh J.-W. (2016) “Biomimetic self-templating optical structures fabricated by genetically engineered M13 bacterio-phage,” [Biosensors and Bioelectronics] Vol.85 P.853-859 google cross ref
  • 4. Oh D. H., Qi J., Han B. H., Zhang G., Carney T. J., Ohmura J., Zhang Y., Shao-Horn Y., Belcher A. M. (2014) “M13 Virus-Directed Synthesis of Nanostructured Metal Oxides for Lithium?Oxygen Batteries,” [Nano Letters] Vol.14 P.4837-4845 google cross ref
  • 5. Lee Y. J., Yi H., Kim W. J., Kang K., Yun D. S., Strano M. S., Ceder G., Belcher A. M. (2009) “Fabricating genetically engineered high-power lithium-ion batteries using multiple virus genes,” [Science] Vol.324 P.1051-1055 google
  • 6. Lundstrom I. (2000) “Artificial noses: Picture the smell,” [Nature] Vol.406 P.682-683 google cross ref
  • 7. Baik J. M., Zielke M., Kim M H., Turner K. L., Wodtke A. M., Moskovits M. (2010) “Tin-oxide-nanowire-based electronic nose using heterogeneous catalysis as a functionalization strategy,” [ACS Nano] Vol.4 P.3117-3122 google cross ref
  • 8. Ko W. R., Jung N. C., Lee M. C., Yun M. H., Jeon S. M. (2013) “Electronic nose based on multipatterns of ZnO nanorods on a quartz resonator with remote electrodes,” [ACS Nano] Vol.7 P.6685-6690 google cross ref
  • 9. Lotsch B. V., Ozin C. A. (2008) “Clay Bragg stack optical sensors,” [Advanced Materials] Vol.20 P.4079-4084 google cross ref
  • 10. Redel E., Mirtchev P., Huai C., Petrov S., Ozin G. A. (2011) “Nanoparticle films and photonic crystal multilayers from colloidally stable, size-controllable zinc and iron oxide nanoparticles,” [ACS Nano] Vol.5 P.2861-2869 google cross ref
  • 11. Oh J.-W., Chung W.-J., Heo K., Jin H.-E., Lee B. Y., Wang E., Zueger C., Wong W., Meyer J., Kim C., Lee S.-Y., Kim W.-G., Zemla M., Auer M., Hexemer A., Lee S.-W. (2014) “Biomimetic virus-based colourimetric sensors,” [Nature Communications] Vol.5 P.3043 google
  • 12. Moon J.-S., Park M., Kim W.-G., Kim C., Hwang J., Seol D., Kim C.-S., Sohn J.-R., Chung H., Oh J.-W. (2017) “M-13 bacteriophage based structural color sensor for detecting antibiotics,” [Sensors and Actuators B: Chemical] Vol.240 P.757-762 google cross ref
  • 13. Moon J.-S., Lee Y., Shin D.-M., Kim C., Kim W.-G., Park M., Han J., Song H., Kim K., Oh J.-W. (2016) “Identification of endocrine disrupting chemicals using a virus-based colorimetric sensor,” [Chemistry: An Asian Journal] Vol.11 P.3097-3101 google cross ref
  • 14. Moon J.-S., Kim W.-G., Shin D.-M., Lee S.-Y., Kim C., Lee Y., Han J., Kim K., Yoo S. Y., Oh J.-W. (2017) “Bioinspired M-13 bacteriophage-based photonic nose for differential cell recognition,” [Chemical Science] google cross ref
  • 15. Zhou X., Cao P., Zhu Y., Lu W., Gu N., Mao C. (2015) “Phage-mediated counting by the naked eye of miRNA molecules at attomolar concentrations in a Petri dish,” [Nature Materials] Vol.14 P.1058-1064 google cross ref
  • 16. Wang Y., Ju Z., Cao B., Gao X., Zhu Y., Qiu P., Xu H., Pan P., Bao H., Wang L., Mao C. (2015) “Ultrasensitive rapid detection of human serum antibody biomarkers by biomarker-capturing viral nanofibers,” [ACS Nano] Vol.9 P.4475-4483 google cross ref
  • 17. Peng G., Tisch U., Adams O., Hakim M., Shehada N., Broza Y. Y., Billan S., Bortnyak R. A., Kuten A., Haick H. (2009) “Diagnosing lung cancer in exhaled breath using gold nanoparticles,” [Nature Nanotechnology] Vol.4 P.669-673 google cross ref
  • 18. Bardhan N. M., Ghosh D., Belcher A. M. (2014) “Carbon nanotubes as in vivo bacterial probes,” [Nature Communications] Vol.5 P.4918 google cross ref
  • 19. Lee B. Y., Zhang J., Zueger C., Chung W. J., Yoo S. Y., Wang E., Meyer J., Ramesh R., Lee S.-W. (2012) “Virus-based Piezoelectric Energy Generation,” [Nature Nanotechnology] Vol.7 P.351-356 google cross ref
  • 20. Merzlyak A., Lee S.-W. (2009) “Engineering Phage Materials with Desired Peptide Display: Rational Design Sustained through Natural Selection,” [Bioconjugate Chemistry] Vol.20 P.2300-2310 google cross ref
이미지 / 테이블
  • [ FIG. 1. (a) ]  ΔRGB intensities of the first, second, third bands of the M13 bacteriophage-based color sensor upon exposure to alcohols under the same conditions, (b) ΔRGB intensities were found to depend on the polarity indexes of the target alcohols and solvents.
    ΔRGB intensities of the first, second, third bands of the M13 bacteriophage-based color sensor upon exposure to alcohols under the same conditions, (b) ΔRGB intensities were found to depend on the polarity indexes of the target alcohols and solvents.
  • [ FIG. 2. ]  (a) ΔRGB intensities of the first, second, and third bands of the M13 bacteriophage-based color sensor upon exposure to mixtures of methanol and 1-butanol. Percentages indicate the volume % of methanol in 1-butanol. Methanol 0% corresponds to 1-butanol 100%, (b) ΔRGB intensities were found to depend on the polarity indexes of methanol and 1-butanol mixtures.
    (a) ΔRGB intensities of the first, second, and third bands of the M13 bacteriophage-based color sensor upon exposure to mixtures of methanol and 1-butanol. Percentages indicate the volume % of methanol in 1-butanol. Methanol 0% corresponds to 1-butanol 100%, (b) ΔRGB intensities were found to depend on the polarity indexes of methanol and 1-butanol mixtures.
  • [ FIG. 3. ]  Real-time ΔRGB intensities of during measurement of methanol/1-butanol mixtures, as determined using the M13 bacterio-phage color sensor. 0% corresponds to 100% 1-butanol, and 5% corresponds to 5% methanol/95% 1-butanol.
    Real-time ΔRGB intensities of during measurement of methanol/1-butanol mixtures, as determined using the M13 bacterio-phage color sensor. 0% corresponds to 100% 1-butanol, and 5% corresponds to 5% methanol/95% 1-butanol.
  • [ ] 
  • [ FIG. 4. ]  Response and recovery time of the M13 bacteriophage-based color sensor upon exposure to methanol and 1-butanol. (a) Response to methanol, (b) response to 1-butanol, (c) recovery after exposure to methanol, and (d) recovery after exposure to 1-butanol.
    Response and recovery time of the M13 bacteriophage-based color sensor upon exposure to methanol and 1-butanol. (a) Response to methanol, (b) response to 1-butanol, (c) recovery after exposure to methanol, and (d) recovery after exposure to 1-butanol.
(우)06579 서울시 서초구 반포대로 201(반포동)
Tel. 02-537-6389 | Fax. 02-590-0571 | 문의 : oak2014@korea.kr
Copyright(c) National Library of Korea. All rights reserved.