It has been a challenge for researchers to accurately measure high temperature creep strain online without damaging the mechanical properties of the pipe surface. To this end, a noncontact method for measuring high temperature strain of a main steam pipe based on digital image correlation was proposed, and a system for monitoring of high temperature strain was designed and developed. Wavelet thresholding was used for denoising measurement data. The sub-pixel displacement search algorithm with curved surface fitting was improved to increase measurement accuracy. A field test was carried out to investigate the designed monitoring system of high temperature strain. The measuring error was less than 0.4 ppm/°C, which meets actual measurement requirements for engineering. Our findings provide a new way to monitor creep damage of the main steam pipe of a boiler of an ultra-supercritical power plant in service.
The main steam pipe of a boiler of an ultra-supercritical power plant operates in an environment with high temperature (surface temperature 605°C) and high pressure steam over a long period of time, thus accelerating the damage due to material creep and raising great safety concerns. How to accurately measure high temperature strain online without damaging mechanical properties of a pipe surface has been a hot topic that relevant scholars and users are concerned with. As a high temperature field disturbs imaging, it is difficult to apply regular thermal strain measuring methods such as strain gauges, moire interference, electronic speckle interference and holographic interference [1-4] in this area. Digital image correlation (DIC) [5-8] is considered as the most promising high temperature whole-field optical measuring method due to its easy installation, low cost and lower susceptibility to high temperature. Pan
2D-DIC is used to measure the high-temperature strain of the main steam pipe of a boiler of an ultra-supercritical power plant in service. Due to the noise signal in the complicated on-site environment, it is necessary to filter and denoise the image collected on-site, and use a sub-pixel displacement search to improve measurement accuracy. On this basis, high temperature strain is calculated.
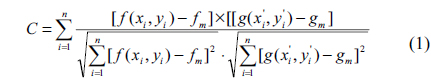
By tracking two speckle images collected before and after surface deformation of an object, 2D-DIC conducts correlation processing of interest points to calculate their displacement component, and measures the deformation field of the object. For calculation of the correlation function, a normalized and standardized covariance cross-correlation function with strong resistance to interference is selected to measure the level of similarity of images before and after deformation. The expression is as follows [14, 15]:
Where , ,
2.2. Denoising Method for Image
Wavelet thresholding is used for filtering and noise reduction. The soft threshold function is calculated as follows [16]:
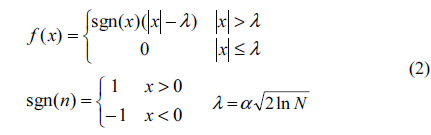
Where
It can be seen from the experimental results in Table 1 below that wavelet thresholding reduces the noise of the digital speckle image collected.
[TABLE 1.] Comparison of three denoising approaches based on SSIM function
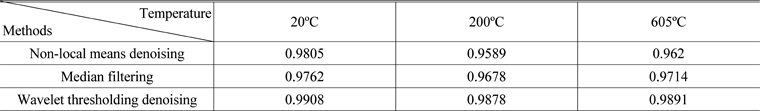
Comparison of three denoising approaches based on SSIM function
2.3. Sub-pixel Displacement Search
To increase measurement accuracy and measurement speed at the same time, the binary quadric surface fitting method is improved in the present study. The reciprocal of Eq. (1) is used as the correlation coefficient of the improved method to achieve sub-pixel search. The expression is as follows:
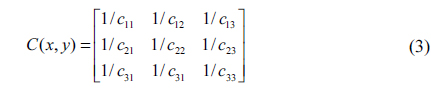
Where
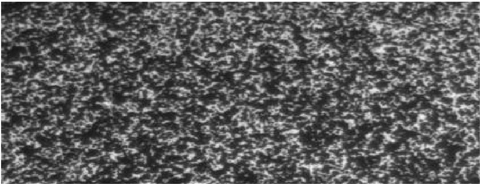
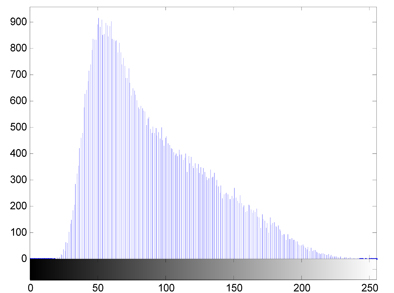
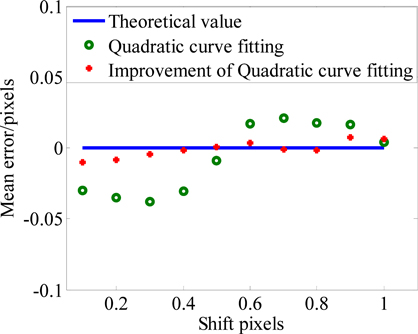
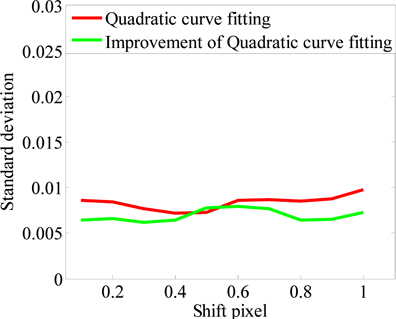
The simulated speckle in Fig. 1 (total size: 162 × 428 pixels, size of speckle: 4 pixels) is used. The histogram of Fig. 1 is shown in Fig. 2. By equally spaced translation of 0.1 pixel within the range of 0-1 pixel in Fig. 1, the speckle image after deformation is obtained. Sub-pixel displacement of images before and after deformation is solved using the improved method and the binary quadric surface fitting method. The performance of the two methods is compared by calculating mean error and standard deviation. The results are shown in Fig. 3 and Fig. 4.
By comparing Fig. 3 and Fig. 4, it can be seen that the standard deviation of the improved quadratic fitting method is slightly greater than that of the binary quadric surface fitting method, while its mean error is much smaller than that of the binary quadric surface fitting method. The accuracy of the improved quadratic fitting method reaches 0.1 pixel.
2.4. Calculation of High Temperature Strain and Coefficient of Thermal Expansion
The accuracy of the high temperature strain algorithm is verified by using the coefficient of thermal expansion of the known materials and comparing the coefficient of thermal expansion calculated by DIC.
Supposing the object deforms in the same form within a small area, the first-order polynomial (4) is used to describe the displacement of all points in the area.
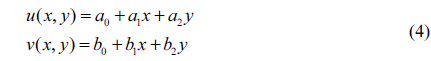
Where
The least squares method is used to solve the coefficient of Eq. (4), namely {
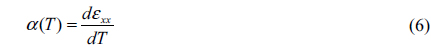
The coefficient of thermal expansion
III. MONITORING SYSTEM OF HIGH TEMPERATURE STRAIN
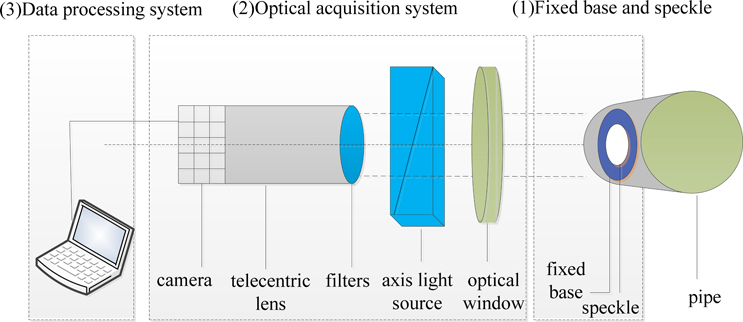
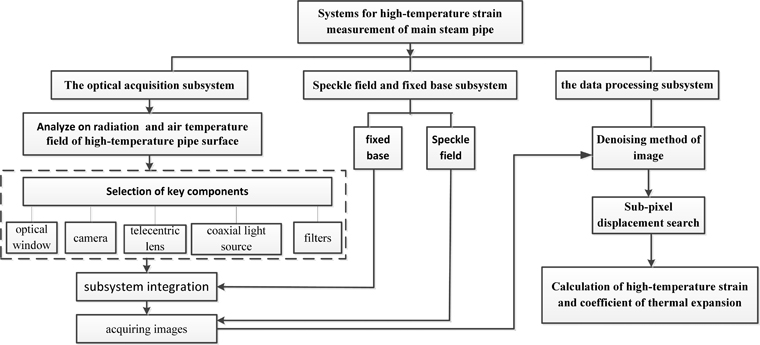
The structure and flowchart of the design process of the monitoring system of high temperature strain are separately shown in Fig. 5 and Fig. 6. It mainly includes the subsystem consisting of speckle field and fixed base, which is used for developing speckle field and fixing optical acquisition system; the optical acquisition subsystem consisting of optical window, camera, telecentric lens, coaxial light source, and filters, which is used for acquiring images before and after deformation; the data processing subsystem is used for calculating high temperature strain and coefficient of thermal expansion.
3.1. Speckle Field and Fixed Base Subsystem
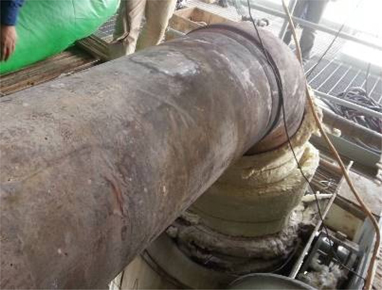
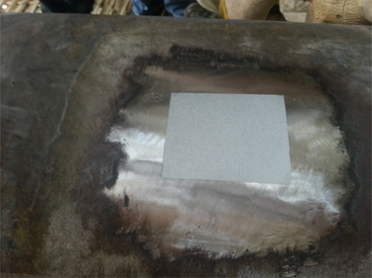
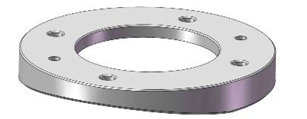
The main steam pipe of the boiler of an ultra-supercritical power plant in service to be measured (ф = 388 × 67cm) is shown in Fig. 7, its material is P92 and surface temperature is 605°C. The black and white high temperature-resistant (1000°C-resistant) paint was used to prepare the speckle field. Specifically, the black paint was first sprayed evenly onto the pipe in Fig. 7. After the black paint was dried slightly, the white paint was sprayed randomly to form irregular speckles, as shown in Fig. 8. The fixed base in Fig. 9 was used to control the optical acquisition system and achieve in situ reappearance of acquired images both within the focal distance of the lens and the perpendicularity of the system. Based on the size of the camera and the light source, the outer diameter, inner diameter and height of the fixed base were obtained, i.e. 100 mm, 56 mm, and 2 mm, respectively. The same material as the main steam pipe was selected to prevent qualitative change of pipe material. The fixed base was welded onto the pipe in Fig. 7 upon the completion of the welding procedure qualification.
3.2. Optical Acquisition Subsystem
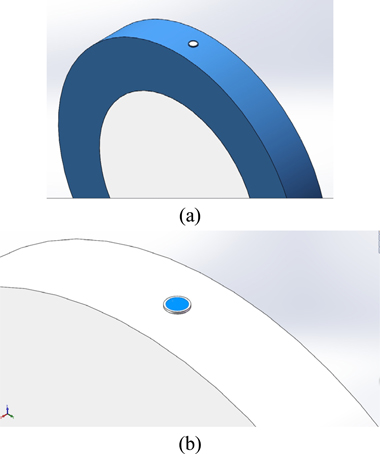
To understand the distribution of the air temperature field of the high temperature pipe surface and its influence on the optical window, the simulation analysis of both air temperature field on a pipe surface and air temperature field 2 mm away from the pipe was performed using Fluent (fluid simulation software). The model was established as shown in Fig. 10. The fixed base and its inside were selected as the analysis object. The fixed base was represented by a cylinder. The boundary conditions are as follows: the given temperature at the air boundary is 878 K, the air temperature at infinity is set at 293 K, the turbulence model is the standard k-ε model, ideal gas is selected as the object of calculation, specific heat capacity is 1006.43 J/kg.K, heat conductivity coefficient is 0.0242 w/m.k, and convective heat transfer coefficient is 6 w/m2.k.
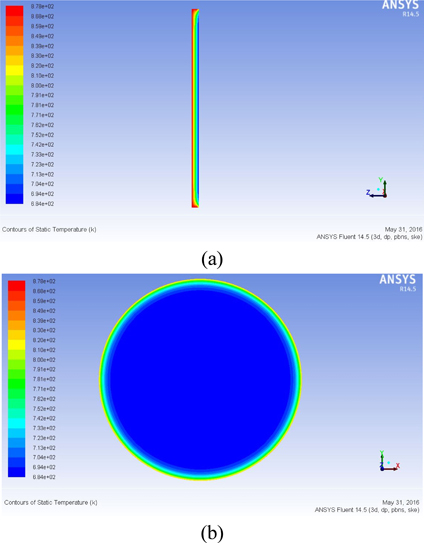
Fig. 11 shows the temperature field distribution on the pipe surface and the air temperature field distribution inside the cylinder 2 mm away from the pipe surface. It can be seen that the air temperature field 2 mm away from pipe is lower than that on the pipe surface, the temperature field near the cylinder wall is higher, and the air temperature field inside the cylinder is the minimum and distributed relatively evenly. The results indicate that the error of optical window caused by temperature can be ignored only by placing the optical window in the position inside the cylinder where air temperature field is distributed evenly.
The minimum ratio of the diameter
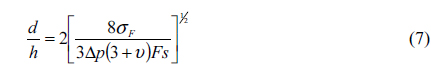
Where Δ
The thickness
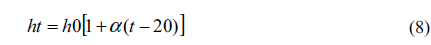
Where
The material of the optical window is fused silica, and the diameter of the window is 50 mm. The minimum thickness of the window calculated according to Eq. (7) is 2.5 mm. Based on Eq. (8) and the characteristics of the manufacturing process, the designed window thickness at 605°C is 5 mm.
In addition, the pixel size of selected CCD camera is 3.69 μm, and the quantum efficiency at the wave length of 510 nm is the highest. To reduce the influence of high temperature radiation on camera acquisition, the 460-480 nm blue filter that is close to the radiation of the pipe surface was introduced to eliminate the influence of other wave lengths. The corresponding 468-480 nm blue coaxial light source was used as a secondary light source to irradiate the object surface evenly. Since relatively small displacements from the surface can cause significant measurement error for in-plane displacement, the object telecentric lens with an amplification ratio of 0.3 and a focal distance of 110 mm was selected.
IV. EXPERIMENTAL RESULTS AND ANALYSIS
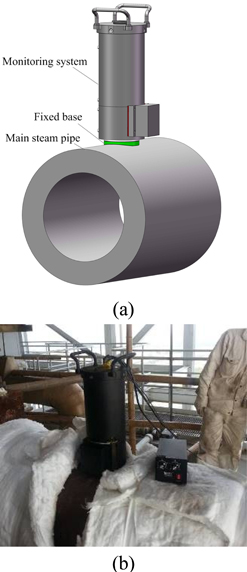
The monitoring system of high temperature strain was installed on the main steam pipe shown in Fig. 7. See Fig. 12 for schematic diagram and actual installation. The thermal strain and coefficient of thermal expansion at different temperatures were calculated by using the measuring methods in Section 2. The surface temperature of the pipe during the test was obtained by measurement with a thermocouple. Fig. 13 (a) shows the image acquired at 20°C during pipe maintenance, which is used as a reference image. Fig. 13(b) shows the image acquired at 200°C after welding heat treatment. Fig. 13(c) shows the image acquired at 605°C after 90 days of operation. The average correlation coefficient of the image at 605°C is 0.9122, indicating that the design high temperature strain measuring system can obtain high quality images which meet the monitoring requirements.
The size of image’s region of interest was set at 602 × 271 pixels. Non-local means denoising, median filtering and wavelet thresholding denoising (using Eq. (2)) were compared using SSIM function [20], as shown in Table 1. The results indicate that wavelet thresholding performs better in eliminating image noise.
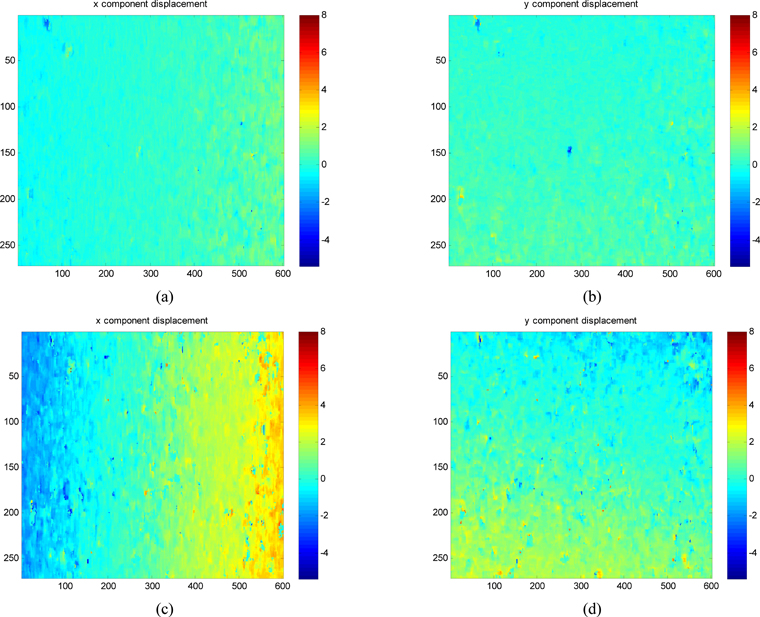
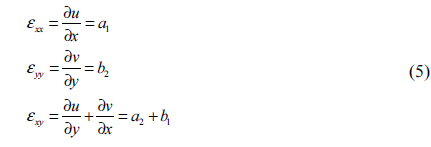
The surface high temperature strain and coefficient of thermal expansion in the pipe’s regions of interest in Fig. 7 at 200°C and 605°C were calculated using DIC. The axial direction of the pipe is the X direction, while that vertical to the axial direction is the Y direction. Fig. 14 (a), (b), (c) and (d) show the displacement field in the X direction and Y direction at 200°C and 605°C, respectively. By removing bad pixels and using the improved quadratic fitting method, we calculated the maximum deviation of displacement. The results show that the maximum deviation of displacement in the X direction and Y direction at 200°C is 1.9 pixel and 1 pixel, and that in the X direction and Y direction at 605°C is 3 pixels and 2.01 pixels.
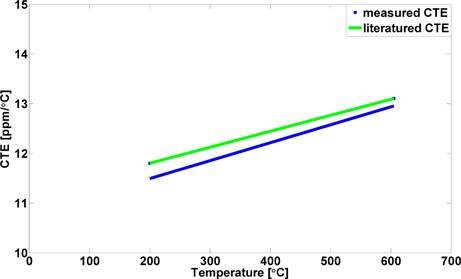
Based on the data of the displacement field in Fig. 14, we calculated thermal strain using Eq. (5). The results show that the thermal strains in the X direction and Y direction at 200°C are 0.1703 and 0.2028, respectively, and that in the X direction and Y direction at 605°C are 0.6382 and 0.6944, respectively. The coefficient of thermal expansion was also calculated using Eq. (6). The results show that the coefficients of thermal expansion in the X direction and Y direction at 200°C are 11.46 and 11.51, and the average coefficient of thermal expansion is 11.49; the coefficients of thermal expansion in the X direction and Y direction at 605°C are 13.07 and 12.83, and the average coefficient of thermal expansion is 12.95.
Based on Yang
A noncontact approach was proposed to measure the high temperature strain of the main steam pipe of a boiler of an ultra-supercritical power plant in service at high temperature by using 2D-DIC. A monitoring system for high temperature strain was designed. During the design of an optical window, finite element was used to analyze the air temperature field distribution, both on the main steam pipe surface and 2 mm away from the pipe surface, as well as its influence on an optical window, and the thickness of optical window was also provided. The designed optical acquisition system solved the optical imaging problem caused by high temperature radiation very well. The high temperature strain was measured successfully by means of wavelet thresholding denoising, the improved sub-pixel displacement search algorithm with curved surface fitting, and the calculation method of thermal strain. To verify the effectiveness of the proposed method and system, the developed monitoring system of high temperature strain was tested on the real main steam pipe. The measured coefficient of thermal expansion shows good consistency with the data recorded in the literature, and the maximum error between them is less than 0.4 ppm/°C. Therefore, the proposed method and system can be used to measure the creep strain of the main steam pipe of a boiler of an ultra-supercritical power plant in service, and to meet the actual measurement requirements for engineering.