The objectives of this study were to determine the effects of stream nutrient regime, N:P ratios and suspended solids on fish tolerance/trophic compositions and stream ecosystem health, based on multi-metric model, during 2008–2013. Also, stream ecosystem health was evaluated in relation to chlorophyll-a (CHL) as a measure of algal productivity or indicators of trophic state to water chemical parameters. Total number of sampled fish species were 50 and showed a decreasing trend from 2008 to 2013. The minnow of Zacco platypus, based on the catch per unit effort (CPUE), was the most dominant species (25.9%) among the all species. Spatial heterogeneity was evident in the fish tolerance guilds that showed the dominance of sensitive species (89%) in the headwaters (S1) and the dominance of tolerant species (57%) in the urban. These conditions were directly influenced by concentrations of nutrients and organic matter (COD). The N:P ratios, as a barometer of water pollution, had a negative linear function (R2 = 0.40, P < 0.01) with CHL, and the ratios had an important role in changes of COD concentration (R2 = 0.40, P < 0.01). Under the circumstances, the N:P ratio directly influenced the relative proportions of fish trophic/tolerance compositions. According to the regression analysis of omnivore (Om) and insectivore sp. (In) on total nitrogen and total phosphorus, nitrogen had no significant influences (P > 0.05) to the two compositions, but phosphorus influenced directly the two guilds [slope (a) = -32.3, R2 = 0.25, P < 0.01 in the In; a = 40.7, R2 = 0.19, P < 0.01 in the Om]. Such water chemistry and fish trophic guilds determined the stream ecosystem health, based on the multi-metric fish model.
Bouchung Stream is one of the major tributary streams in Geum River and has the total length of 72.11 km, and basin area of 553.38 km2. Mean slope of the basin is 32.1%, and has longitudinal difference between the upstream and downstream region. The base water level is low in the upstream region, resulting in a steep gradient, but the base level in the downstream is relatively high. Such stream gradient is a key factor in determining physical habitat, chemical water quality and biological components or biological diversity (Lee and Bang 1999) and closely related with landuse pattern in Korea.
Forest cover of 67% in the stream is mainly located in the upstream region, and the covers of cropland (26%) and urban (4%) are relatively low in the stream. The downstream environment of Geum River, which is influenced by tributary of Bouchung Stream, has been rapidly changed due to three weirs (Sejong, Geumgang, and Baekje weir) constructed by 4 major river project in 2010. The key modifications are reported as increases of stagnant area, decreases of riffle area, and frequent algal blooms in the downriver region. These conditions resulted in impairment of the ecological river health (Lee et al. 2013) along with massive fishkill (Kwon et al. 2013) and nutrient enrichment of nitrogen and phosphorus (Ahn et al. 2013). Under this circumstance, upstream monitoring and management are important in protecting downstream environment such as physical habitat, water quality, and biodiversity.
Previous studies reported on river maintenance flow of Bouchung stream watershed (Ahn et al. 2001), estimation of nutrient loading from point-source and non-point sources (Shin 2007) and watershed managements in hydrological aspects (Jeon et al. 2005). Also, researches on chemical water quality such as nutrient enrichments and organic pollution (Park et al. 2012) were conducted in the watershed. Such chemical and hydrological monitoring may not detect ecological integrity in the stream due to large seasonal variations of nutrient budget and hydrology by Asian monsoon rain in Korea (An 2000, An and Shin 2005). For this reason, US EPA (1993) and Barbour et al. (1999) suggested biological integrity concept, based on the different trophic levels of aquatic taxa (periphyton, macroinvertebrate, and fish) and stream health assessments. Especially, multi-metric modeling approach of fish has been widely applied to wadable streams and rivers of North America (US EPA 1993, Barbour et al. 1999) and Europe (Noble et al. 2007, Aparicio et al. 2011).
Similar studies on Index of Biological Integrity (IBI) using fish assemblages have also been done in four major watersheds of Han River (Pyungchang River, An et al. 2001a), Geum River (Gap Stream, An et al. 2001b, Jo et al. 2012), Yeongsan River(An et al. 2007), and Nakdong River (Choi et al. 2007, Geumho River, Kim et al. 2012). Thus, now the multi-metric model of IBI, based on fish assemblages, became a national model for river health assessments in Korea. Recently, An et al. (2013) pointed out that biological integrity of fish is closely associated with N:P ratios or nutrient regime. Currently, stream ecosystem health assessments, based on fish community, are widely used but the research is short-term studies. Also, still little is known about the relations between the water chemistry (N, P) and ecological health.
The objectives of this research are to determine the effects of stream nutrient regime, N:P ratios and suspended solids on fish tolerance/trophic compositions along with long-term variations of stream ecosystem health, based on multi-metric model, during 2008-2013. Our study was conducted as following reason; this stream have water quality problems, especially in the urban area, so the finding the specific problems in the sampling sites are so important in this watershed for better watershed management. We analyzed the relations between water chemistry (nitrogen, phosphorus, and N:P ratios) and chlorophyll-a (CHL) and then inferred relations between the chemical factors and fish bioindicators.
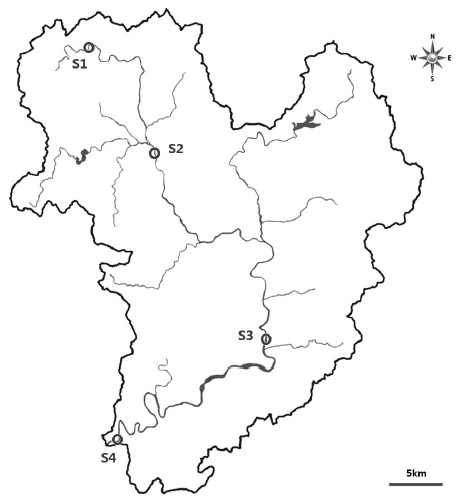
This study was conducted at four sites in the Bouchung Stream (Fig. 1). Fish Samplings were twice a year in April-June as premonsoon period and September-October as postmonsoon period, during 2008-2013.
Fish sampling was followed the wading method (Ohio EPA 1989), arranged by An et al. (2001b). Sampling time was 50 minutes and sampled stream distance was 200 m at each site. We used two types of sampling gears as cast net (mesh 5 × 5 mm) and kick net (4 × 4 mm). Collected fish species were identified according to the methods of Kim and Park (2002).
>
Ecological health assessment
Habitat stream ecological health index, based on multimetric model were applied in this stream. The metric model used in this study is Index of Biological Integrity (IBI), biological health assessment using fish assemblage developed by Karr (1981) and adjusted to Korean stream watershed (An et al. 2006). Each metric score assigned ‘5’, ‘3’, ‘1’, then summed to obtain ecological health index value.
In this study, we used some parameters including chemical oxygen demand (COD), total nitrogen (TN), total phosphorus (TP), chlorophyll-a (CHL) and total suspended solid (TSS) to analyze relationships between water quality and the fish trophic composition and tolerance level. N:P ratio was calculated as water contamination indicator. Monthly dataset for six years gleaned from water quality monitoring network (http://water.nier.go.kr/) of Ministry of Environment, Korea (MEK). Statistical analysis including correlation and regression analysis using water quality variables and fish assemblage variables was performed by SPSS ver. 21.0 for Windows (SPSS Inc., Chicago, IL, USA).
>
Species composition and its annual trend
The analysis of fish compositions and fauna monitored in the watershed of Bouchung Stream showed that total number of species and the number of individuals sampled was 50 and 7,865, respectively. The species diversity was high compared to the previous study of this stream (Ryu et al. 2010) and other streams (Lee et al. 2008, Hur et al. 2009) within Geum River watershed. The minnow of
[Table 1.] Fish fauna, various guilds and individual number of fishes collected in Bouchung Stream
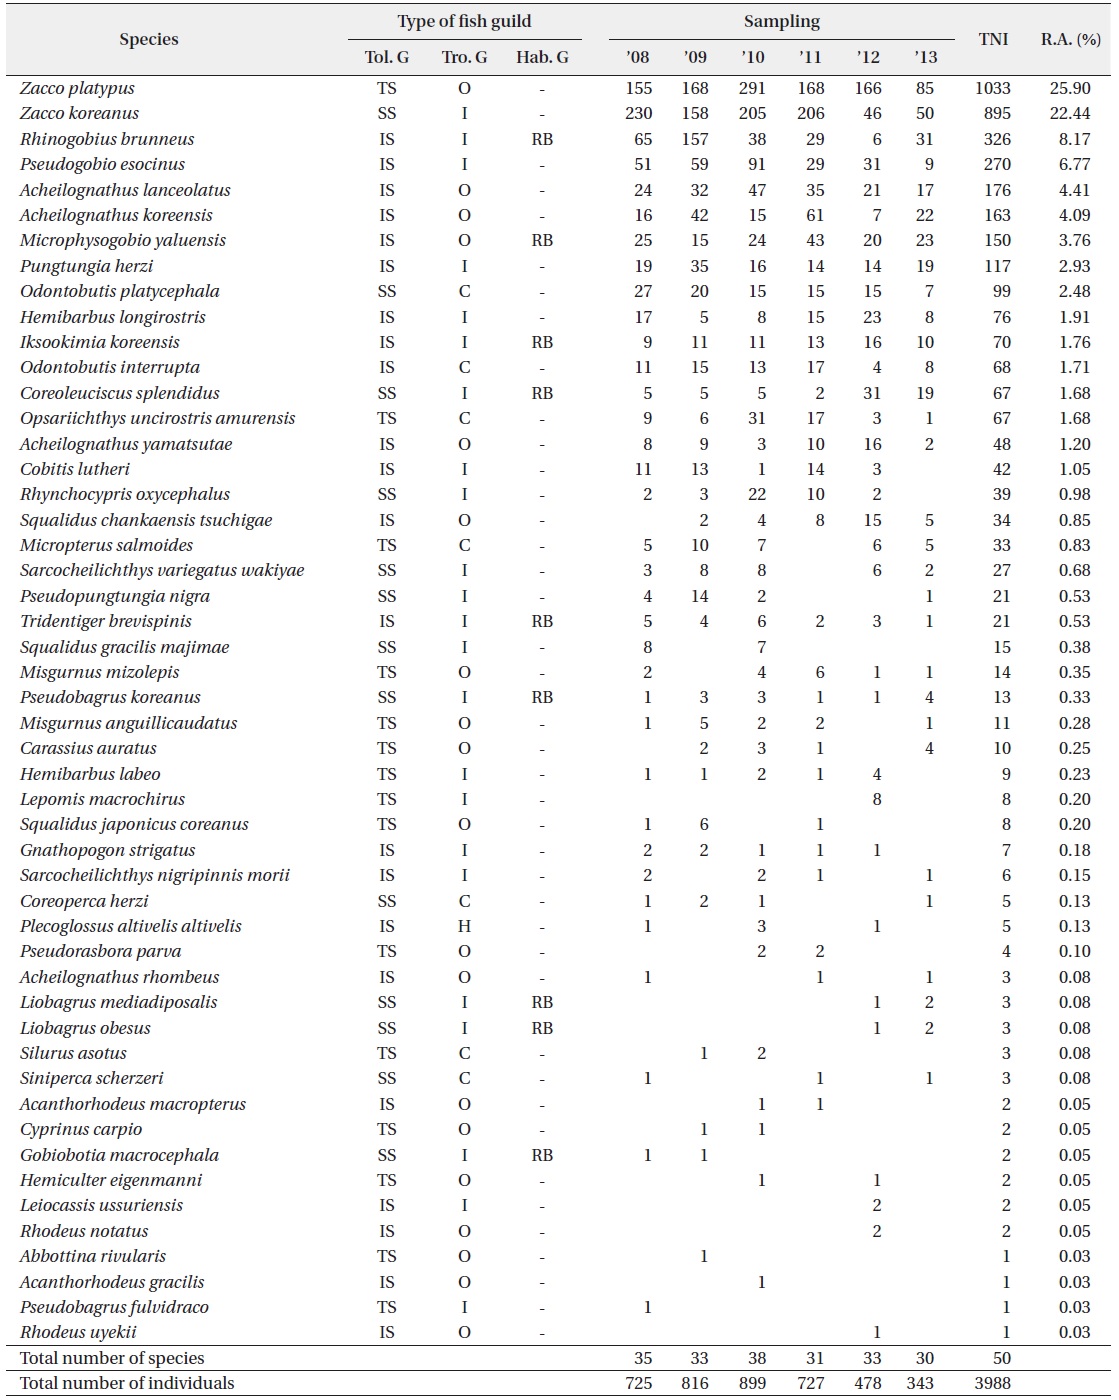
Fish fauna, various guilds and individual number of fishes collected in Bouchung Stream
Spatial distribution pattern analysis of fish showed that sensitive and tolerant species in the headwater region (S1) with a forest landuse were 89% and 4%, respectively, whereas these species in the urban region were 1% and 57%, respectively. This finding suggests that fish compositions changed largely within this watershed depending on the landuse pattern. In contrast, trophic composition analysis showed that insectivores, omnivores, and carnivores were 51%, 42%, and 7%, respectively. Thus, there were no distinct differences of the relative abundance among the three trophic guilds. According to interannual trend analysis of fish fauna, based on CPUE, total number of species decreased from 35 species in 2008 to 30 species in 2013 and also total number of individual decreased from 725 in 2008 to 343 in 2013. Especially, the number of individuals of
>
Stream ecosystem health assessments
Multi-metric fish model values were calculated from the Index of Biological Integrity (IBI) as shown in Table 2. Mean IBI was 28.6 and ranged from 18 to 38, which was judged as a values were calculated from the criteria of An et al. (2006). During 2008-2013, annual mean of the stream health varied from the IBI as shown in Table 2. Mean IBI was 28.6 and ranged from 26.5 to 29.8, respectively, indicating in degradations of fish community, and this was probably due to an impaired water quality in the urban zone (Table 2). The health impairment in the urban region was mainly attributes to habitat simplification by channel modification and weir constructions along with chemical pollutions of nutrients and organic matters. In fact, qualitative habitat evaluation index (QHEI) was judged as “poor” condition in the urban region. Our data of physical habitat health, based on QHEI, supported the low IBI in the urban region.
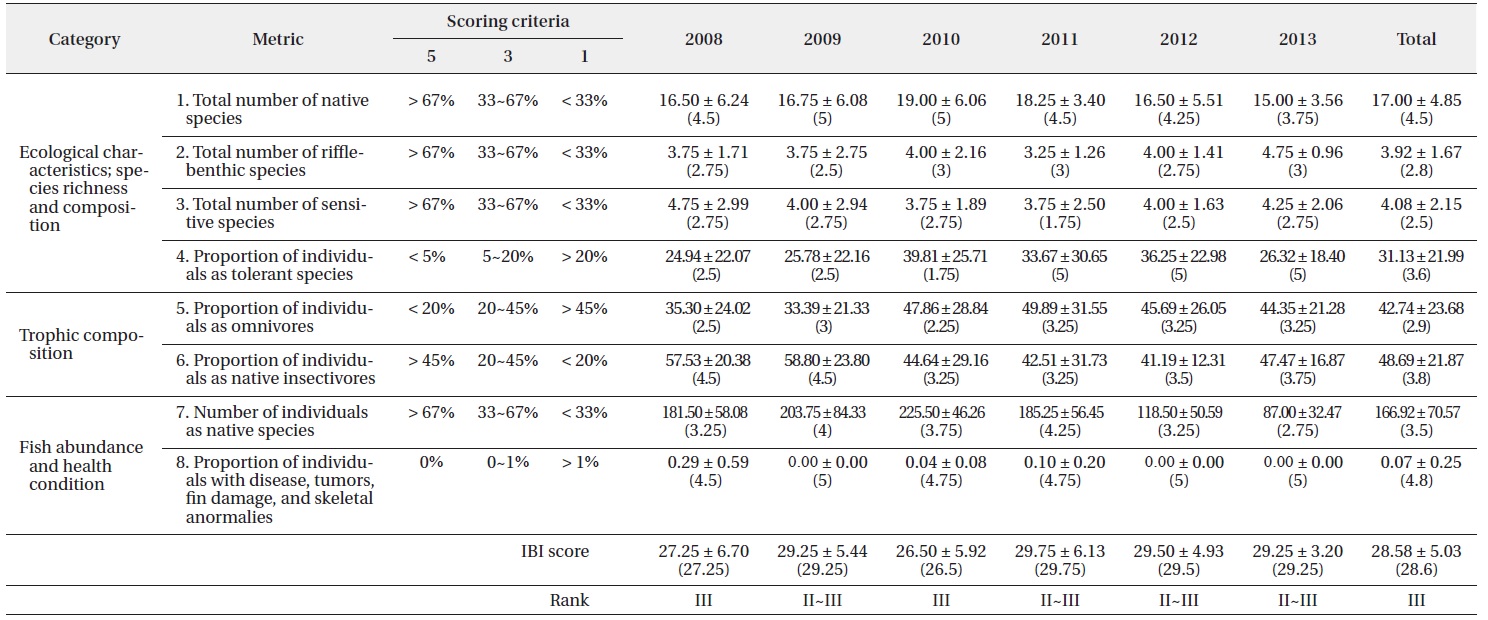
The Index of Biological Integrity (IBI) scores based on 8-metric models in Bouchung Stream
>
Effects of N:P ratios on tolerance guilds and trophic compositions
The effects of N:P ratios on tolerance guilds and trophic compositions analyzed are shown in Table 3. Mass ratios of N: P in the ambient water averaged 63.76 and ranged from 11.98 to 342.67 in the ambient water. Tolerance guilds of fish were largely determined by the N:P ratios; the proportion of sensitive species increased under high N:P ratios, and conversely the proportion of tolerant species increased under low N:P ratios. When the mass N:P ratios were >200, the proportion of sensitive species was >90% of the total (Table 3). In contrast, when the N:P ratios were <25, the proportion of tolerant species was >40% of the total (Table 3). Similarly, trophic compositions were also determined by the N:P ratios; the proportion of omnivore increased under low N:P ratios, and conversely the proportion of insectivore increased under high N:P ratios. When the N:P ratios were <25, the proportion of omnivore was >64% of the total (Table 3). In contrast, when the N:P ratios were <25, the proportion of tolerant species was >40% of the total (Table 3). These relations suggest that the N:P ratio is a good barometer for the determinations of relative proportions of tolerance guilds and trophic compositions. Also,
[Table 3.] Guild composition of fish community and dominant species relation to N:P ratio section
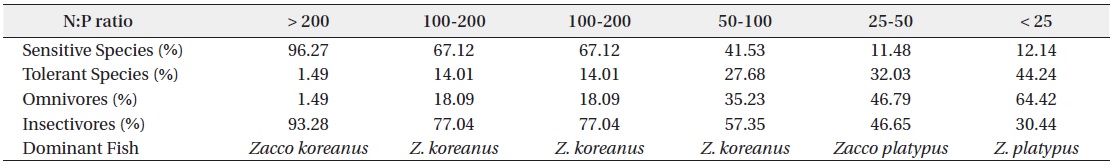
Guild composition of fish community and dominant species relation to N:P ratio section
>
Fish compositions depending on nutrients (N, P) and suspended solids in the ambient water
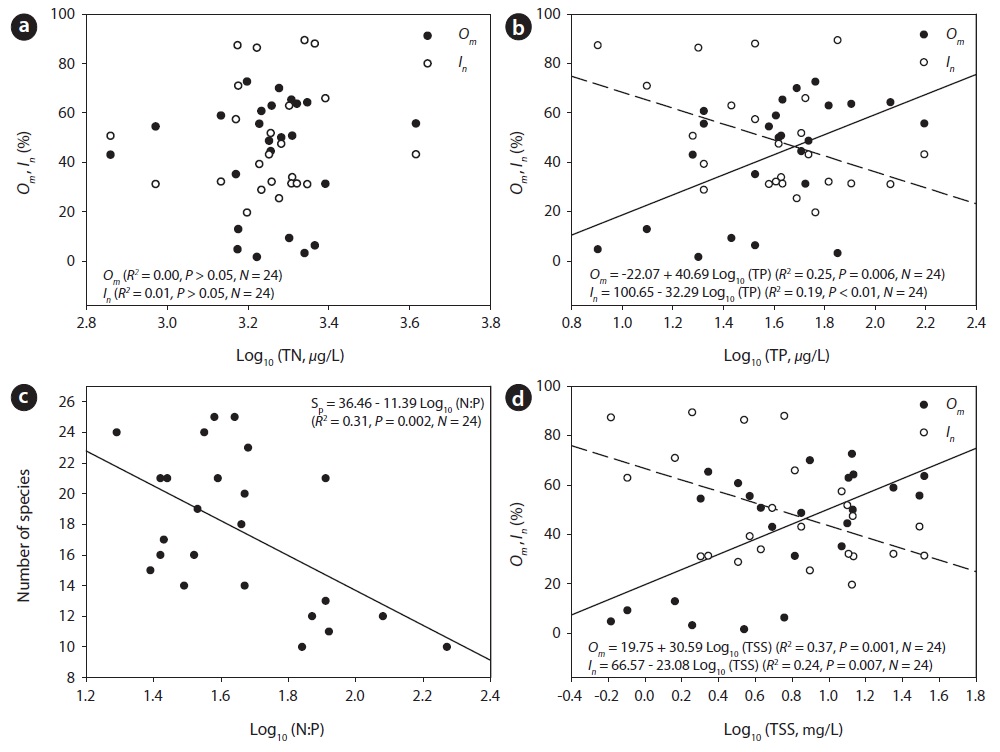
We analyzed concentrations of nitrogen and phosphorus in the ambient to determine the effects of trophic and tolerance guilds (Fig. 2). Regression analysis of omnivore (
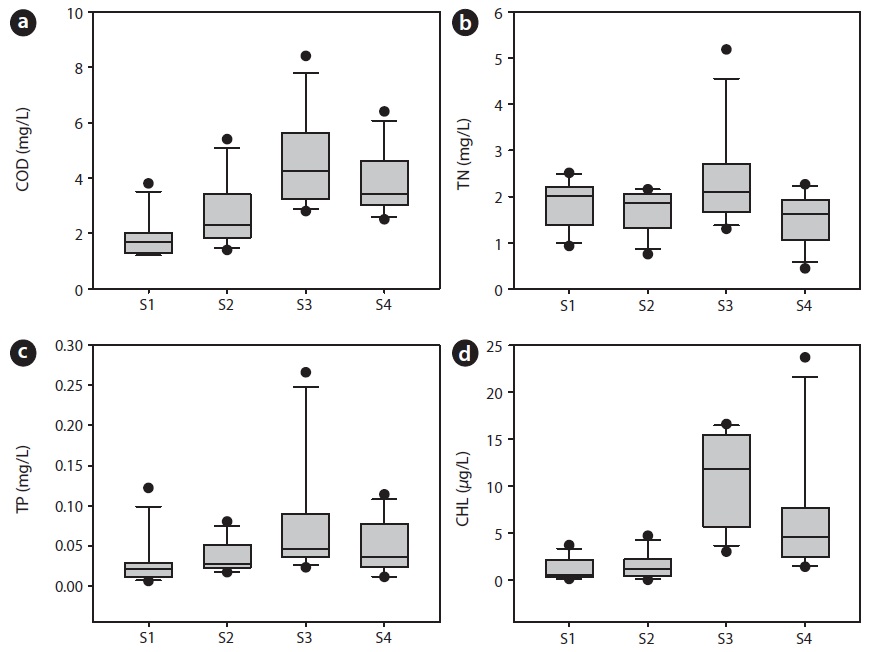
According to dataset of 6 years, water quality, based on organic matter (COD), nutrients (TN, TP) and CHL, was best in the headwater (S1) and worst in the mid-stream of S3 (Fig. 3). Mean COD was minimum in S1 (1.9 mg/L) and maximum in S3 (4.6 mg/L), respectively. Mean TP showed a similar spatial pattern with COD, so TP in the ambient water was highest in the S3. In the meantime, mean TN values were similar among the sampling sites, except for TN in the S3. In other words, values of COD, TP, and TN were maximum in the S3, where is influenced by effluents of wastewater disposal plants and industrial complex (Fig. 3). This result indicates that water pollution especially, in terms of nutrient and organic matters is most pronounced in the S3 due to influences of the point-sources. Thus, the nutrient enrichment in S3 resulted in highest CHL of >10
>
Annual trend of N:P ratios and the relations with other CHL:N and CHL:P ratios
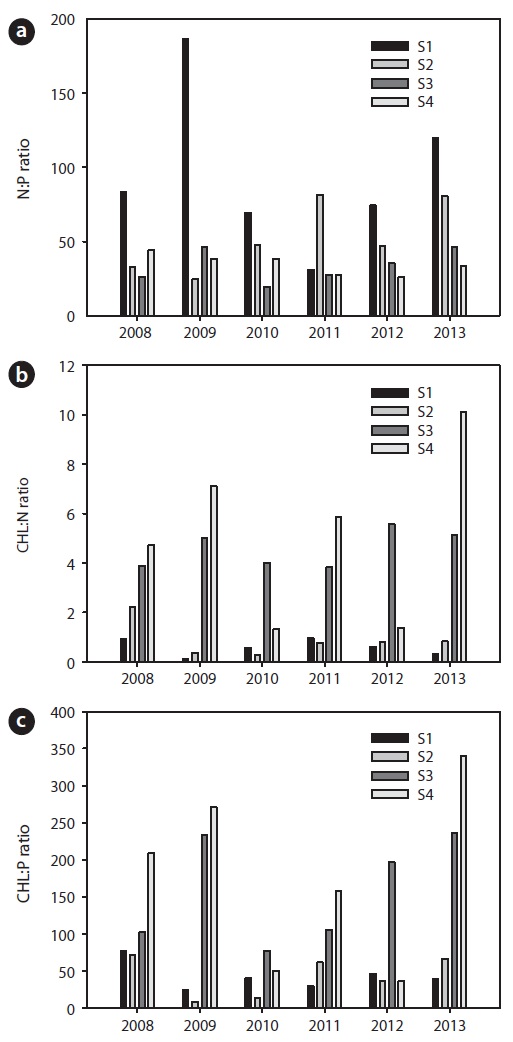
Mass ratios of N:P averaged 53.6 during 2008-2013 and ranged from 19.3 to 186.6 in the stream (Fig. 4), indicating a large inter-annual variation. The N:P ratios showed a positive increasing trend, if we excluded one site of S1 from all the data. Also, values of CHL:N and CHL:P, as indicators of unit nitrogen and phosphorus contents on the CHL, were higher in downstream and greater in 2013 than 2008 (Fig. 4). In other words, increases of CHL:N and CHL:P ratios means the increases of algal production, thus eutrophication increased over the time. Biological stream health, however, based on the multi-metric IBI, did not differ among the sampling years (Table 2). The annual variations of water quality were influenced by combined effects of the Asian monsoon intensity of the year and effects of chemical inputs.
>
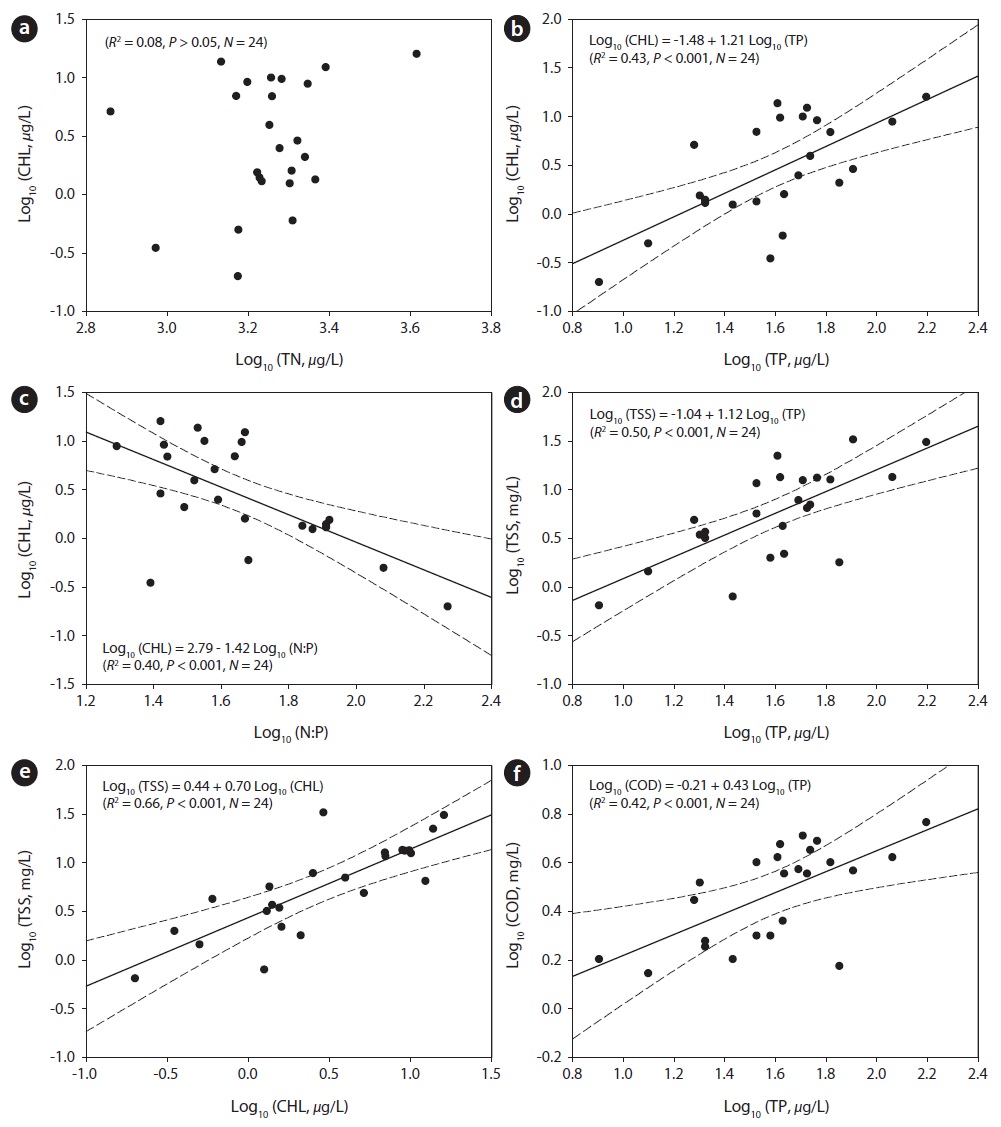
Empirical models of CHL on TN, TP, and N:P ratios
Empirical linear model of CHL, based on 6 years data, had no significant influences (
Overall, our results suggest that primary limiting nutrient regulating the algal productivity (as sestonic phytoplankton CHL) is phosphorus and nitrogen may be enough for the CHL growth. Generally, numerous studies on streams (Carlson 1991, Lind et al. 1993, Hill et al. 1995) suggested that primary limiting factor in stream ecosystems is short water residence time or inorganic turbidity (light limitation). In fact, Song et al. (2012) pointed out that inorganic turbidity was the key factor regulating the algal biomass in other Korean river (Yeongsan River). However, we believe that such general phenomena are evident in high flood season of July-August, and may be weak in non-monsoon seasons in Korea. Therefore, the phosphorus or N:P ratios may be key regulators of primary productivity over the all years, except for the short period. Our primary productivity influenced total suspended solids (TSS) directly [
Under these circumstances, nutrient enrichment (high P, low N:P ratios) and organic matter pollution from the watershed resulted in dominance of omnivore fish in trophic guilds and tolerant species in tolerant guilds (US EPA 1993, Miltner and Rankin 1998, Barbour et al. 1999) in Bouchung Stream. Also, such conditions (high pollution) changed the species compositions in the stream;