동중국해는 한국, 일본, 중국에 둘러싸인 해역으로 쓰시마 난류, 양자강 유출수, 그리고 황해저층냉수가 유출입하여 다양한 해양환경이 나타나는 해역이다. 또한 이 해역은 국내 주요 수산 어종의 주요 산란장 및 성육장이며, 어업 생산량이 국내 연근해와 비교시 상대적으로 높은 해역으로 알려져있다(FRA, 2013; Liu, 2013). 따라서 동중국해와 같은 국내 주요어장의 관리를 위해서 수산자원의 시·공간적인 분포 및 현존량에 대한 기초적인 연구가 지속적으로 수행되고 있다.
국내에서 수산자원의 분포 및 현존량 파악을 위한 조사는 주로 트롤, 자망 등의 어획 기법을 통해서 진행되고 있다(Kim et al., 2010; Choi et al., 2012; Seo et al., 2013). 이러한 조사는 다양한 어종이 혼재되어 분포하는 우리나라 연근해 어류의 종조성을 명확하게 규명할 수 있다는 장점을 가지고 있지만 상대적으로 많은 시간과 비용, 노동력 등이 소요된다고 알려져 있다(Kim, 1991). 반면 수중음향을 이용한 수산자원조사는 어획기법을 이용하는 조사에 비해 단기간에 적은 노동력과 비용으로 넓은 해역을 조사 할 수 있다는 장점을 가지고 있다. 또한 음향조사는 연구자의 주관을 배제시키고 사전에 설정된 조사정선으로부터 연속적이며 수층 전체에 대한 객관적인 자료를 얻을 수 있으며, 우점종이 분포하는 해역에서 우점어류의 음향 반사강도(Target strength, TS) 특성이 제공된다면 현존 자원량까지 산정이 가능하다(Simmonds and MacLennan, 2005). 하지만 측정한 음향자료를 우점 어종의 밀도로 변환시 주요 음향변수인 어류의 음향산란특성은 어종 별로 편차를 보이고, 국내 주요 어종 중 아직 연구되지 못한 어종이 많기 때문에 단독으로 수산 자원량을 산정하기 위해서는 부족한 점이 있다(Hwang, 2015). 따라서 전 세계적으로 어획과 음향의 두가지 기법을 병행하여 수산자원 연구를 진행 중에 있다(Von Szalay et al., 2007; Zwolinski et al., 2012).
국내 주요 수산자원조사 기법 중 하나인 저층 어획조사는 해저면 부근에 분포하는 저어류를 대상으로 연구를 진행한다. 반면에 생물음향 기법의 경우 저층 어류에 대해서는 해저면 신호의 분리에 대한 단점 때문에 저서 어군의 군집 크기, 분포 특성 및 군집의 안정성 파악에는 한계를 가지고 있다. 따라서 음향조사는 해저면 부근 어종 식별에 한계가 있기 때문에 전 세계적으로 중층어류의 분포 및 자원량 산정에 집중되어 있다(Honkalehto et al., 2011; Zwolinski et al., 2012). 저층 어류 신호 분석에 대한 제한점을 극복하기 위해서 획득한 음향자료에 대한 음향자료처리의 중요성이 대두되고 있다(Kang et al., 2011). 이러한 음향자료처리 기술의 발달로 인하여 해저면과 분리가 가능한 조건에서 저서어류의 시·공간적인 구조 및 자원량 조사가 제한적으로 진행되고 있다(McQuinn et al., 2005). 국내에서도 최근 들어 음향자료처리 기술 발달과 더불어 음향과 어획 기법을 활용하여 저층어류 분포 특성 및 자원량에 대한 연구가 진행되고 있다(Kang et al., 2008; Lee et al., 2012; Lee et al., 2015).
본 연구에서는 제주도 인근 북부 동중국해 저어류를 대상으로 어획과 음향 기법을 이용한 수산자원 조사를 실시하였다. 저층 트롤조사를 통해 획득한 어획자료와 동시에 획득한 음향자료를 이용하여 조사해역 내 어류 밀도를 추정하였고, 추정된 두 기법의 자료를 비교하여 음향기법을 이용한 저층 어류 신호 분석 및 자원량 추정 가능성을 확인 하였다.
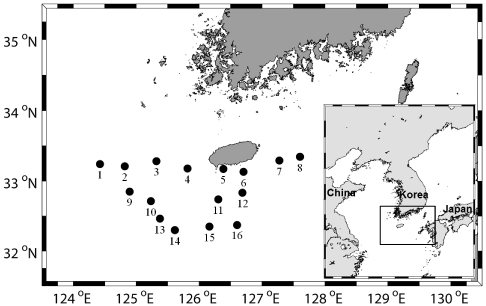
본 연구는 제주도 남부의 북부 동중국해 해역에서 동계시기인 2014년 11월 29일부터 12월 11일까지 국립수산과학원의 자원조사선인 탐구 20호(R/V Tamgu 20)를 이용하여 트롤어획 및 음향학적 조사를 16개 정점에 대해서 실시하였다(Fig. 1).
[Fig. 1.] Location of the hydroacoustic and bottom trawl survey area in the Northern East China Sea.
어획 조사는 저층 트롤 어구(Hand rope: 41 m, Net pendant: 96 m, Cod end size: 20 mm)를 이용하여 주간시기에 진행하였고, 정점 별 약 3노트의 선속으로 30분 동안 예망하였다(Table 1). 조사정점 별 수심은 69-141 m (평균93 m)이였고, 해저면부터 약 3.5 m까지의 범위에 대해서 어획조사가 진행되었다. 어획된 어류는 조사선 내에서 Kim et al. (2005)를 기준으로 종수준까지 동정하였고, 동정 된 어류는 종 별로 개체수, 중량(1 g), 길이(0.1 cm)를 측정하였다. 어획자료 분석시 음향조사 결과와 비교를 위해 어획된 어류 중 음향자료처리가 불가능한 해저면 부근 데드존(dead zone)에 서식하는 어류를 제외하였다. 조사해역 내 어류 밀도의 단위면적 당 개체수(inds./km2)와 생체량(kg/km2)은 소해면적법을 사용하여 산정하였고, 어획효율 (q)은 기존 연구를 토대로 0.5로 설정하였다(Prodo, 1990). 환경조사는 어획조사 후 16개의 정점에 대해서 CTD (conductivity-temperature-depth; Sea-Bird, SBE 911plus)를 이용하여 실시하였다.
[Table 1.] Detail on the acoustic and bottom trawl surveys
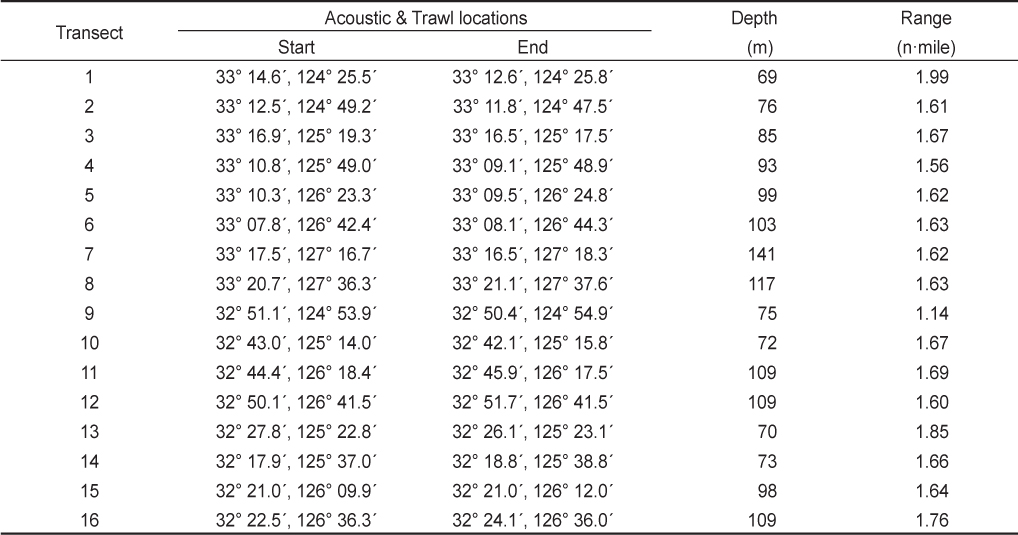
Detail on the acoustic and bottom trawl surveys
음향조사는 조사선에 설치된 선저형 과학어군탐지기(EK60 scientific echosounder; Simrad, Norway)를 이용하여 실시하였다. 본 조사에 사용한 음향센서는 분할빔 방식(split- beam)의 38 kHz와 200 kHz 주파수를 사용하였고, 음향자료 획득시 신호 길이(pulse length)와 송신 간격(pulse duration)은 각각 1.024 ms와 2 pings/s로 설정하여 음향 자료를 획득하였다(Table 2). 음향 조사 전 음향 시스템은 교정구(calibration sphere)를 이용하여 교정을 실시하였고, 자세한 음향 시스템 변수는 Table 2에 정리하였다.
[Table 2.] System parameters calibrated for the acoustic survey
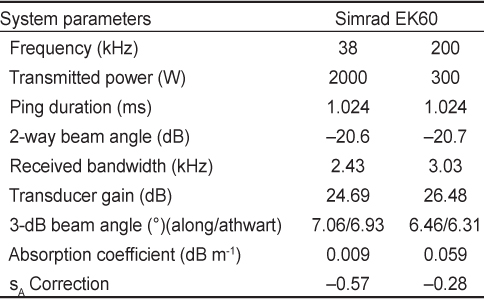
System parameters calibrated for the acoustic survey
음향자료처리는 획득한 후방체적산란강도(Volume backscattering strength, SV) 자료 중 어획 조사가 실시된 음향 정선에 대해서 분석을 실시하였다. 분석은 음향자료처리 전용 프로그램(Echoview ver 6.1; Myriax software Pty Ltd, Hobart, Tasmania, Australia)을 이용하여 가상 에코그램 방식으로 진행하였다. 음향자료처리는 조사해역에서 획득한 신호를 해저면, 어획 장비 운영 등에 의해서 발생한 노이즈 제거 후, 저층 어획자료와 비교를 위해 음향자료를 해저면부터 해저면 위 3.5 m 수층을 분리하였다.
분리된 음향 신호 내 어류 외 기타 산란체인 동물플랑크톤 및 해파리 등 기타 생물 신호의 제거를 위해서 후방체적산란강도 차이법(Mean Volume Backscattering Strength, MVBS)을 이용하였다(Kang et al., 2002). MVBS 기법의 활용시 두 주파수의 신호 범위는 어류의 자원량 산정에 큰 영향을 준다. Kang et al. (2002)은 명태(walleye pollock)에 대해서 ‒1 dB < MVBS38-120 kHz < 4 dB, Gauthier and Horne (2004)은 청어(herring)에 대해서 3 dB
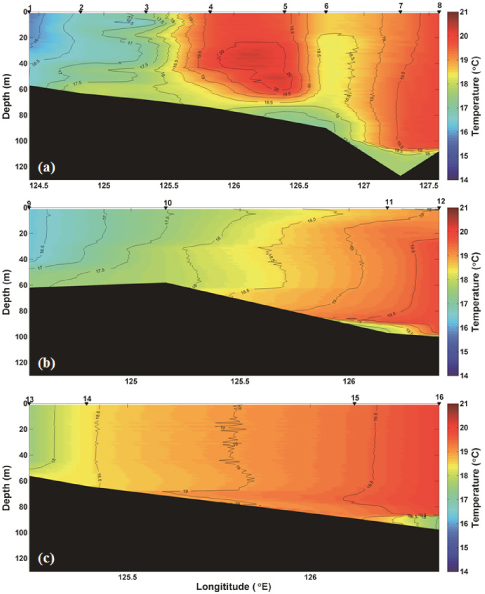
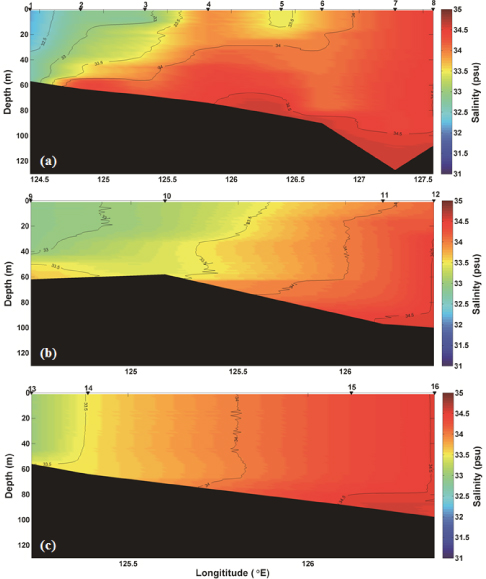
본 조사해역의 해양환경은 수온과 염분 각각 15.72-20.25℃와 32.15-34.62 psu로 동계시기이기 때문에 수온 및 염분 모두 수직적인 분포가 유사하였다(Fig. 2, Fig. 3). 조사해역의 수평적인 해양환경은 동쪽해역은 서쪽해역에 비해서 상대적으로 높은 수온 분포를 보였고, 남쪽해역으로 갈수록 수온이 상승하였다(Fig. 2). 염분 또한 동쪽해역이 서쪽해역에 비해서 상대적으로 높았고, 남북의 염분 분포는 유사하였다(Fig. 3).
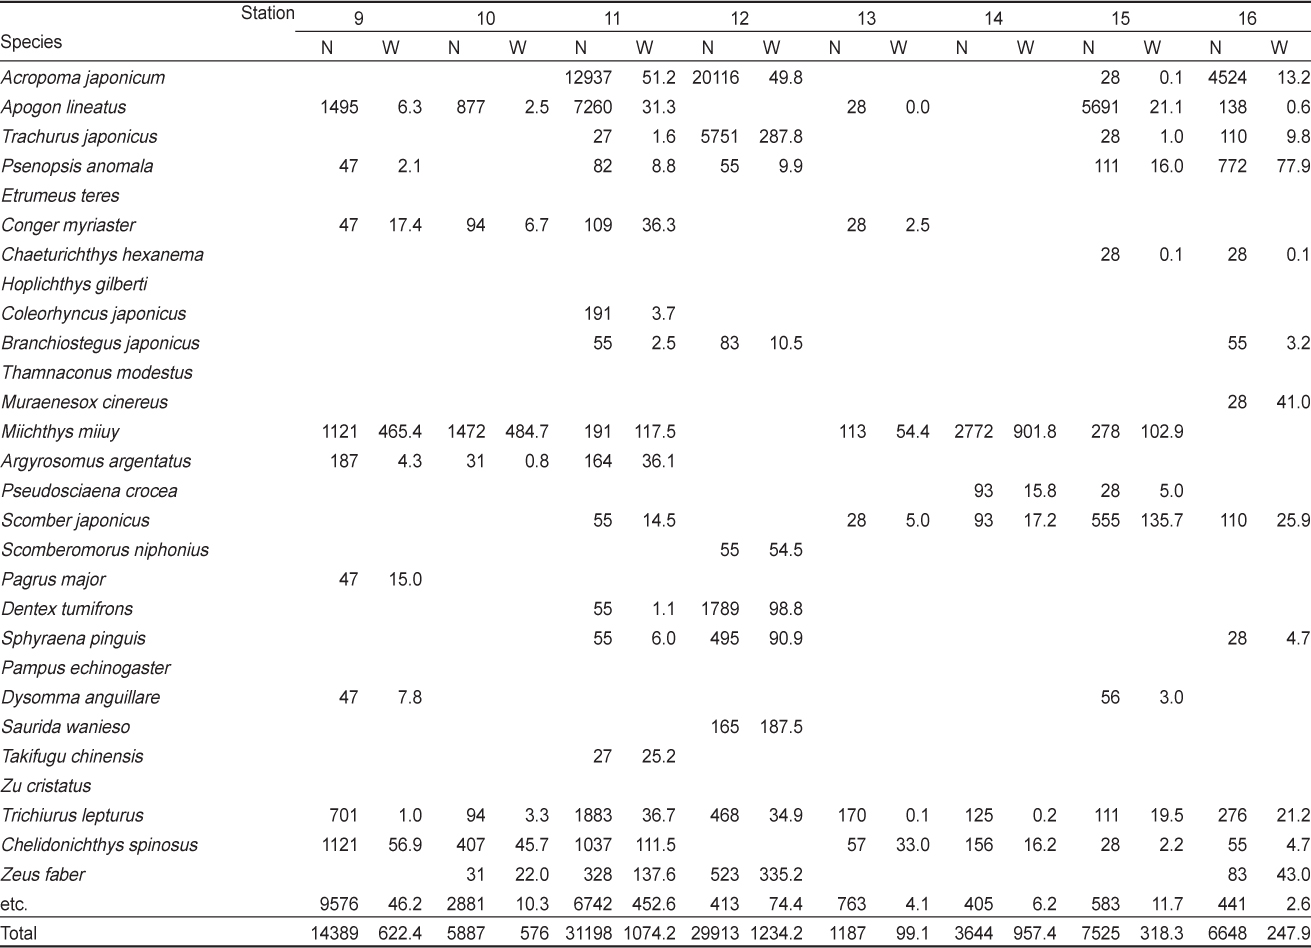
어획조사는 총 16개의 정선 1.14-1.99 n·mile범위에 대해서 진행되었으며, 수심은 69-141 m였다(Table 1). 트롤 조사를 진행한 거리를 고려한 소해면적 범위는 0.0429-0.0796 km2 였다. 어획된 자료와 음향 자료와의 비교를 위해 음향 데드존에 분포하는 가자미목, 홍어목, 아귀목 등 총 10종을 제외한 종조성은 Table 3과 같았다. 음향 데드존에 분포하여 제외된 어종의 개체수는 1% 미만이었다. 어획된 어류의 정점 별 출현 어종수는 6-32종으로 분류되었고, 단위면적 당 어획된 어류의 개체수와 생체량은 272-133,040 ind./km2와 26.1-8,055.0 kg/km2 의 범위를 보여 정점 별로 큰 편차를 보였다. 주요 어종은 조사정점 별로 차이를 보였지만 샛돔(
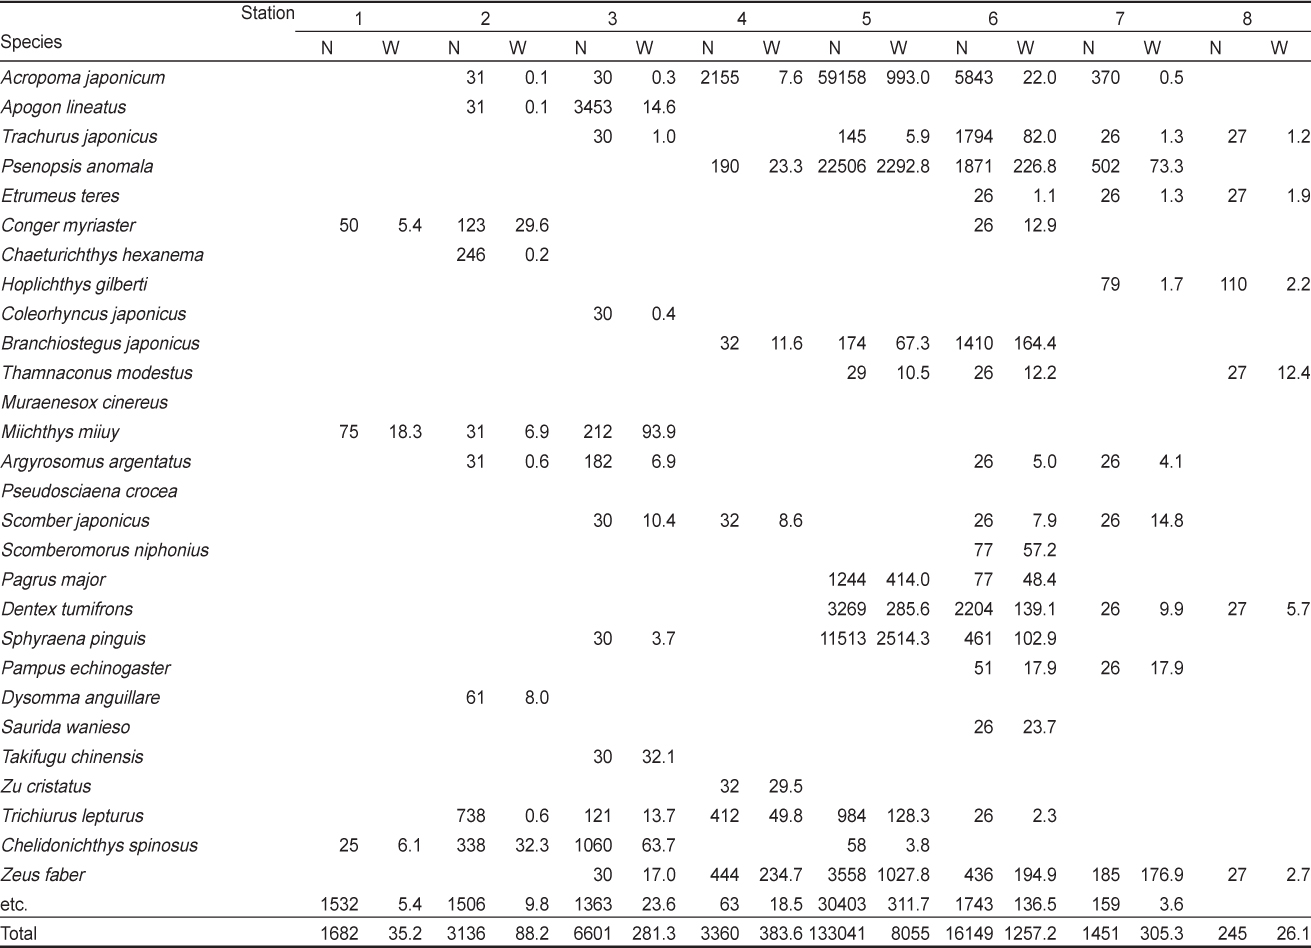
Species composition of fish collected by a bottom trawl in the Northern East China Sea, 2014. N and W are number of individuals per unit area (ind./km2) and wet weight per unit area (kg/km2), respectively

Species composition of fish collected by a bottom trawl in the Northern East China Sea, 2014. N and W are number of individuals per unit area (ind./km2) and wet weight per unit area (kg/km2), respectively
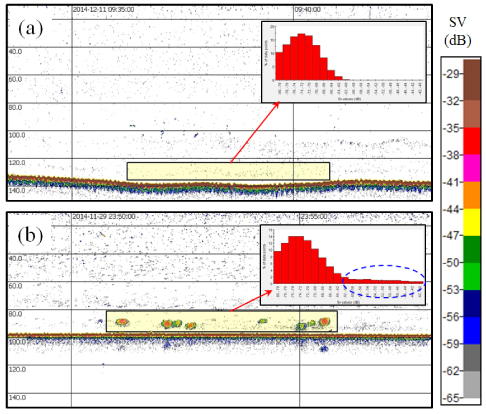
Fig. 4는 각각 St. 8과 St. 5에서 38 kHz를 이용하여 수신된 에코그램의 예이다. St. 8의 경우 전 수층에 어류 신호가 거의 없고, 어획 조사가 실시된 해저면 부근 또한 ‒80 ~ ‒60 dB 범위의 낮은 강도 신호가 측정되었다[Fig. 4(a)]. 반면 St. 5는 어류로 판단되는 ‒60 dB 이상의 범위의 강한 음향 신호가 해저면 부근에 혼재되어 수신되었다[Fig. 4(b)]. 본 신호들은 자료처리를 통해서 상대적인 음향 밀도로 추출하여 어획 결과와 비교하였다.
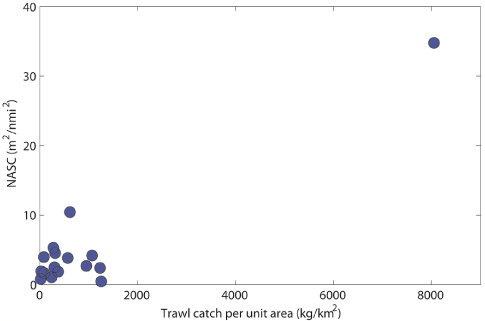
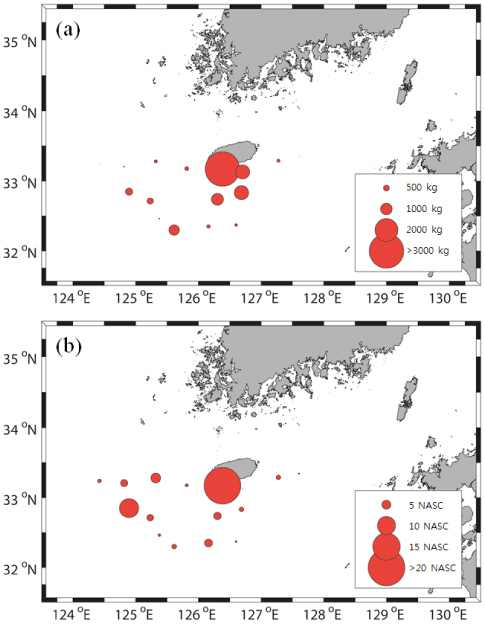
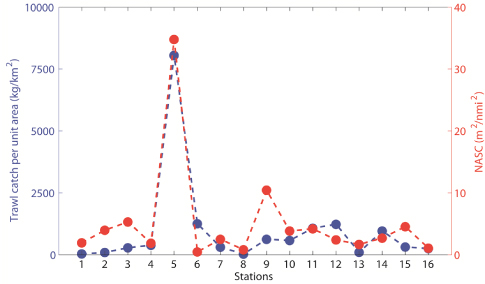
어획기법 조사에서 가장 높은 자원밀도와 가장 낮은 자원밀도를 보인 정점은 각각 St. 8과 St. 5로 약 300배 이상의 큰 차이를 보였다[Fig. 5(a)]. 음향기법을 이용하여 저층어류 신호에 대하여 NASC를 이용한 상대적인 밀도를 분석한 결과 0.45-34.80 m2/n∙mile2의 범위로 나타났다[Fig. 5(b)]. 조사 해역 중 가장 높은 NASC 값을 보인 지역은 St. 5 였고, 반대로 가장 낮은 NASC 값을 보인 지역은 St. 8로 정점 별 편차를 보였으나 최대와 최소 음향 밀도 정점은 어획 결과와 동일하였다.
중층 어류의 분포 및 자원량은 해양환경에 큰 영향을 받는 것으로 알려져 있다. 그 예로 남해 주요 중층 어종인 멸치와 오징어의 경우 수온의 민감한 어종으로 알려져 있다(Kang et al., 2014; Kim et al., 2014). 반면 기존 남해에서 음향 및 저층 어획조사를 통해서 연구된 저어류의 경우 수온에 큰 영향이 없었고(Lee et al., 2015), 본 연구결과 또한 어획 및 음향자료를 통한 어류의 분포와 저층 수온 및 염분과의 상관성을 찾을 수 없었다. McConnaughey and Smith (2000)의 연구에서는 해저면 퇴적물 타입과 저층 어류 분포 및 밀도와의 상관성에 대한 연구가 진행 중에 있다. 따라서 조사 해역 내 해저면 퇴적물 타입과 저층 어류 종조성 및 자원량에 상관성에 대하여 추가로 진행 할 것이다.
음향기법을 이용하여 획득한 상대적인 밀도인 NASC 결과와 어획 결과는 높은 상관성을 보였다(
음향을 이용한 저층어류의 밀도는 기존에 연구된 조사해역인 제주 서쪽 연안의 경우 NASC가 0.2-231.6 m2/n∙mile2의 범위로 본 연구의 조사해역 내 최대 밀도인 34.8 m2/n∙mile2보다 약 6.7 배 크게 나타났다(Kang et al., 2008). 이는 연안 해역의 경우 상대적으로 어류의 변동이 많고 낮은 수심으로 인한 부어류의 유입 가능성 때문에 본 조사결과 보다 높은 자원량이 분포한 것으로 판단된다. 따라서 본 조사해역 내 지속적인 음향 조사를 통해서 NASC 결과를 이용한 밀도 산정에 대한 연구가 진행되어야 한다.
NASC는 음향 생물량을 나타내는 척도로 사용된다. 현장에서 획득한 SV는 음향 빔 내에서 탐지되는 개개 어종에 대한 음향반사강도 함수[TS=20·log10(fish length, cm)+b20]를 이용하여 조사 해역의 어류 밀도로 변환 및 현존량 산정이 가능하여 국내 일부 해역에서 저층 어류에 대한 연구가 진행되었다(Simmonds and MacLennan, 2005; Kang et al., 2008; Lee et al., 2012). 음향 기법을 이용한 어류 밀도는 조사해역 우점 어류의 음향 특성과 길이 분포를 이용하여 산정이 가능하다. 하지만 조사 해역 16 개 정점에서 우점 어종 별 큰 편차를 보였고, 민어를 제외한 어종의 우점 비율은 60% 였다(Table 3). 또한 조사 해역 내 주요 어종의 음향 특성은 고등어, 갈치 등의 중층 주요 어종을 제외하고는 음향 특성에 대한 연구가 진행되지 않았고, 저층 어종의 형태는 일반 어종과는 차이를 보이기 때문에 저층 어종에 대한 음향 특성 연구가 진행되어야만 정확한 밀도 산정이 가능할 것으로 판단된다.
2009 년부터 국립수산과학원에서는 국내 모든 근해에서 저층 트롤을 이용한 어획조사와 과학어탐을 이용한 음향조사가 동시에 진행되고 있다. 차 후 국내 근해의 저층 어류 분포 및 자원량에 대한 연구를 본 결과를 바탕으로 진행하여 국내 저층 어류의 변동에 대한 연구에 기초 자료가 될 것으로 판단된다.
음향기법을 통한 어류 자원량 산정을 위해서는 각 대상 우점 어종에 대한 음향산란특성을 파악하여야 한다. 하지만 국내 저층어류에 대한 음향특성 연구는 부어류에 비해서 상대적으로 거의 이루어지지 않았다. 따라서 향후 저층 어류에 대한 음향산란특성이 보안된다면 두 기법의 장점을 상호보완적으로 활용하여 동중국해는 물론 우리나라 연근해의 수산자원을 보다 정도 높은 현존량 변동 추정이 가능할 것으로 판단된다.