The region of the atmosphere commonly called the Mesosphere and Lower Thermosphere (MLT) includes an area with the lowest temperature among the Earth’s atmosphere, and is located at the end of the homosphere. Accordingly, the effect of molecular diffusion is more important than the mixing of gases, and meteors falling into the Earth are burned down in this area. Furthermore, because of the absorption of sunlight and chemical reactions, various airglows are emitted in this region (Chamberlain 1961); enormous energy is accumulated as atmospheric gravity waves, that have been formed in the lower layer and have propagated to the upper layer, dissipate in this region; and the effect of the lower atmosphere is amplified due to a low density. Thus, this area is closely related to the lower as well as the upper layer (Taylor & Hapgood 1988).
Owing to the difficulty in accessibility, studies on the MLT region have been performed using remotely controlled observation devices and surface observation devices such as sounding rockets, satellites, radars, and Lidar. With the recent development of optical instruments, such as a CCD, it is possible to observe faint airglows that show a wave phenomenon similar to ripples that are formed by atmospheric gravity waves at the lower layer or the atmospheric layer right above the lower layer, propagate freely, and effectively deliver energy and momentum (Hecht & Walterscheid 1991; Taylor & Hill 1991; Taylor et al. 1995, 1997, 1998).
It is known that an important factor controlling the kinematic changes, the thermodynamic structure, and the large-scale atmospheric circulation in the MLT region is a short-period (<1 hr) gravity wave that propagates freely (Taylor 1997). A gravity wave is formed by the disturbance of the atmospheric flow by mountainous terrains, strong convections, and jet streams, and is transmitted from the lower layer to the MLT region because of a combined action of buoyancy and gravity based on the changes in the atmospheric density. A gravity wave affects the density and temperature of gases that emit faint light due to the absorption of sunlight and chemical reactions in the MLT region, and this effect is observed as a wave phenomenon on the image obtained by an All-Sky Camera (ASC) that can observe various airglows through the installation of a narrowband filter. In this regard, the obtained two-dimensional allsky image provides information on the apparent wavelength, velocity, and the period and the moving direction of the gravity wave (Garcia et al. 1997).
Chung et al. (2005) reported the band shape and ripple pattern of gravity waves on the OH Meinel band and OI 557.7 nm images obtained from the all-sky camera installed at Mt. Bohyun, Korea. Recently, Kim et al. (2010) analyzed the seasonal variation of the mesosphere gravity waves by analyzing the OH Meinel, OI 557.7 nm, and O2 atmospheric airglow images observed using the all-sky camera at Mt. Bohyun, Korea. According to their study, the gravity waves observed over the Korean Peninsula showed the maximum occurrence rate in the summer and the minimum occurrence rate at the vernal/autumnal equinoxes, and the gravity waves propagated to the west in the autumn and winter and to the east in the spring and summer.
In the present study, to examine the occurrence rate, shape, spatial distribution, and seasonal variation of atmospheric gravity waves that mechanically affect the MLT region over the Korean Peninsula and the Japanese Islands, the 2004–2005 all-sky image data at Shigaraki, Japan were analyzed using the image processing and gravity wave selection method that had been applied to the 2001–2005 data at Mt. Bohyun; and the two data were statistically compared.
2. AIRGLOW OBSERVATIONS USING AN ALLSKY CAMERA
In Korea, Chungnam National University and the Korea Polar Research Institute installed an all-sky camera at Mt. Bohyun (36.2° N, 128.9° E and 1,124 m above sea level), and observed atmospheric gravity waves over the Korean Peninsula from July 2001 to September 2005 by studying OI 557.7 nm, OI 630.0 nm, O2 Atmospheric band, OH Meinel bands, and Na airglow (Kim et al. 2010). In Japan, the Solar-Terrestrial Environment Laboratory (STEL) at Nagoya University has been carrying out observations in overseas area as well as in Japan since 1998, starting from Shigaraki (34.8° N, 136.1° E) (Shiokawa et al. 1999). Fig. 1 shows the locations of the Mt. Bohyun and Shigaraki stations. As shown in the figure, the two stations have different longitudes and similar latitudes. Thus, a comparison of the all-sky images showing gravity waves obtained from the two stations would be useful for understanding the characteristics of the upper atmosphere in Northeast Asia.
The two all-sky cameras installed at Mt. Bohyun and Shigaraki were manufactured by Keo Consultant, and they broadly consist of three parts: an optical system, a detector, and an operating system. Both of these cameras use a fisheye lens with a field of view of 180°; and the filters used in the two cameras are presented in Table 1.
[Table 1.] Filters used in the all-sky cameras at Mt. Bohyun and Shigaraki

Filters used in the all-sky cameras at Mt. Bohyun and Shigaraki
3. STATISTICAL CHARACTERISTICS OF GRAVITY WAVES OVER THE KOREAN PENINSULA AND JAPAN
For gravity wave selection from the observed all-sky image, the image processing and analysis methods (star removal, space standardization, and image projection) that were applied to the images obtained for Mt. Bohyun for the 2001–2005 period were also applied to the Shigaraki images for the purpose of data comparison and for the statistical reliability of the gravity wave occurrence rate (Chung 2005; Kim et al. 2010).
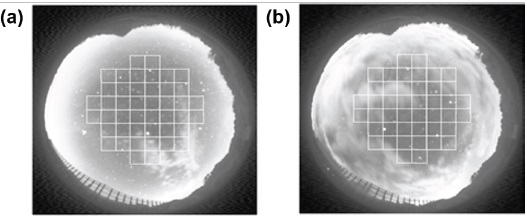
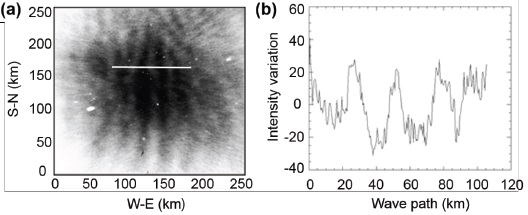
First, an effective image, where the characteristics of the all-sky camera lens and weather (especially, the amount of cloud and the phase of the Moon) satisfied the condition shown in Fig. 2, was selected. Due to the fish-eye lens used in the all-sky camera, distortion occurs while moving from the center of the lens to the periphery. Thus, for an accurate calculation of the parameters, waves should be located near the zenith. Similarly, airglow with a relatively weak intensity could experience light pollution due to strong moonlight, and thus, (1) there should no effect of moonlight in anangular distance of 50° from the zenith and (2) the amount of clouds should be less than 30% at the center of the allsky image. For this purpose, 44 grids were distributed in an angular distance of 50° from the zenith on the all-sky image; the images in which clouds occupied more than 13 out of the 44 grids were excluded, while the one in which clouds occupied less than 12 grids (27%) was classified as an effective image. Fig. 2 shows the examples of (a) an effective image and (b) a non-effective image, through the placement of grids at the center of the image. The image classified as an effective image was converted to an 8-bit image with the maximum brightness of 255 and the minimum brightness of 0, through space standardization and image projection. For the converted image, the one-dimensional brightness distribution of the area, that is expected to be the form of a wave, was presented in a diagram using Fast Fourier Transform (FFT). As the wave detected by the allsky camera is due to the perturbation of the airglow, the vertical axis in the one-dimensional brightness distribution was presented as the amount of perturbation that was subtracted from the average total brightness of the 8-bit image. When the number of detected wave forms where the amount of perturbation for the one-dimensional brightness distribution perpendicular to the wavelength being above ±10 was more than two, it was classified as a wave (Fig. 3).
3.2 Calculation of the Gravity Wave Parameters
The calculation of the parameters was performed based on the final image that went through space standardization and image projection, and the horizontal wavelength, apparent velocity, apparent period, and the moving direction of the wave could be obtained. The wavelength was calculated through the power spectrum obtained from the FFT of the image; the apparent velocity could calculated from the migration of the wave in the preceding and following images with a time difference; and the period of the wave was calculated using the following equation based on the wavelength and velocity.
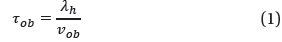
where
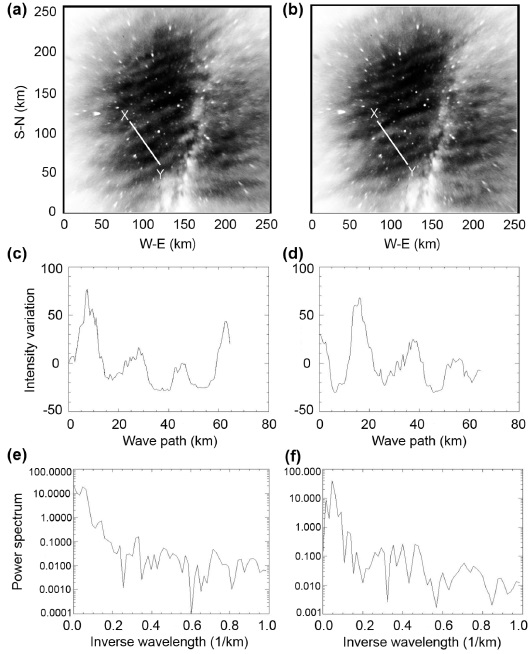
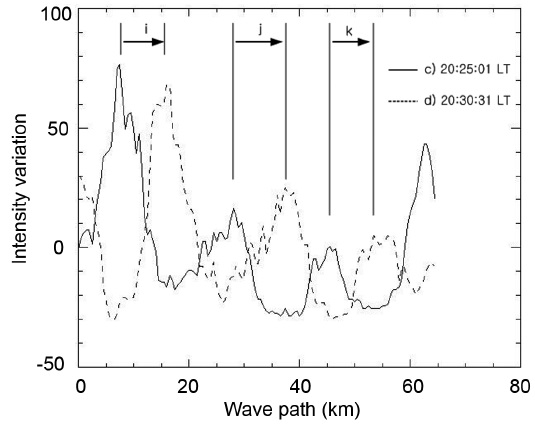
Figs. 4(a) and 4(b) show images obtained using the OH filter at Shigaraki (August 11, 2004) after completing space standardization and projection onto a map; these images were filmed at 20:25:01 and 20:30:31 UT. Wave phenomena with a ripple pattern are distinctly observed in a) and b). The one-dimensional brightness distribution along the two lines, X and Y that pass through the wave and power spectrum of the brightness distribution through 2-D FFT are shown in Figs. 4(c)-4(f ). Excluding the spot where the wave number is ‘0’ in Figs. 4(e) and 4(f), the maximum wavelength in the image was observed at 0.049 (km-1), and thus the wavelength of the gravity wave would be 1/0.049 = 20.4 km. The two all-sky images were filmed at a 05:30 (330 sec) interval. A video in which the images are connected in the order of observation was made to examine the moving direction of the wave, and the result showed that the direction of the wave observed in the image was southeastward (X→Y direction on the image) at an azimuth of 150° (measured from north to east). In Figs. 4(c) and 4(d), the trough and crest of the wave are shown. When these were overlapped (Fig. 5), the three crests of the wave in Fig. 4(c) moved by i, j, and k, respectively, after 330 sec as shown in Fig. 4(d). The lengths of
3.3 Statistical Comparison and Seasonal Variation
Gravity wave data obtained using the all-sky camera at Mt. Bohyun (36.2° N, 128.9° E) from July 2001 to September 2005 were analyzed (Chung 2005; Kim et al. 2010). The total observation time was 21,186 min, and wave phenomena were observed during 3,069 out of 10,086, 137 out of 1,077, and 1,655 out of 10,022 min observations using the OI 557.7 nm, OH Meinel band, and O2 865.0 nm filters, respectively. The wave occurrence rates during the four years were 30%, 16%, and 13% for the OI 557.7 nm, O2 Atmospheric band, and OH Meinel band filters.
For gravity wave data obtained at Shigaraki (34.8° N, 136.1° E) from January 2004 to December 2005, the total observation time was 21,756 min, and wave phenomena were observed during 6,860 out of 18,594 and 1,068 out of 3,163 min observations using the OI 557.7 nm and OH Meinel band filters, respectively. The wave occurrence rates during this period were 37% for the OI 557.7 nm and 34% for the OH Meinel band. Similar to the data at Mt. Bohyun, the rate of OI was higher than that of the OH layer with a low altitude of airglow emission. For both filters, observations of waves were more frequent at this site than at Mt. Bohyun.
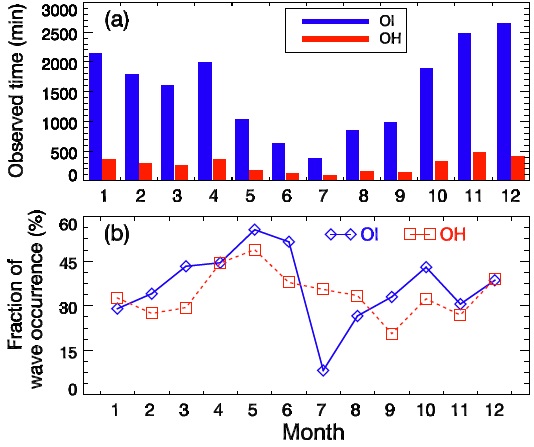
Figs. 6(a) and 6(b) show the monthly total observation times and wave occurrence rates at Shigaraki station, which was determined using the same selection criteria of waves at Mt. Bohyun (Kim et al. 2010). Compared to other seasons, effective observation time at the two stations was insufficient in summer (June to August) due to rain. The maximum emission altitudes of OH, O2, and OI airglows were 86 km, 92 km, and 96 km, respectively. The higher frequency of airglow emission at a higher altitude compared with that in Fig. 3(b) of Kim et al. (2010) is consistent with the fact that gravity waves are amplified at a high altitude due to the exponential decrease in atmospheric density based on hydrostatic equilibrium. In the case of Shigaraki, the occurrence rate of OI airglow was also high except during summer when the number of effective observation days was small.
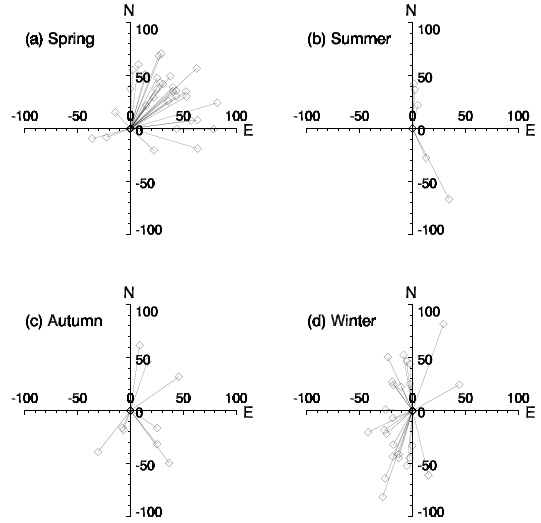
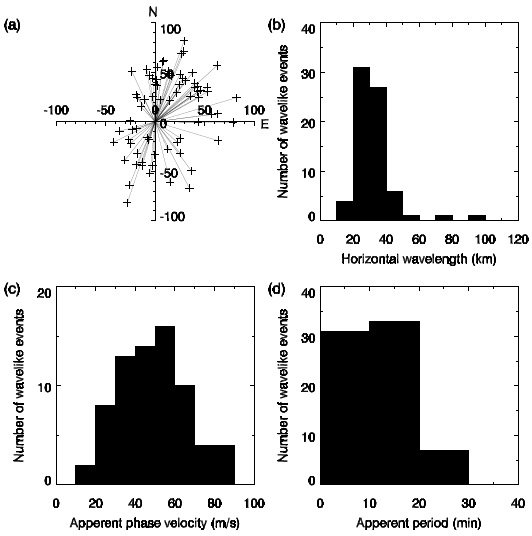
When gravity waves formed in the lower layer propagate to the upper layer, only waves in a specific direction are transmitted by winds in the stratosphere and mesosphere. Thus, the seasonal trend in the direction of waves helps in understanding the dynamic characteristics of these two atmospheric layers. Monitoring of the 2001–2005 gravity wave data at Mt. Bohyun (Kim et al. 2010 Fig. 5) revealed that most waves were biased towards the west in autumn and winter and the directionality could not be determined in summer due to insufficient observations. However, many waves moved north during spring, and relatively strong waves moved northeast (Chung 2005). In 71 cases, parameters were obtained among the wave images observed using the two filters of the all-sky camera at Shigaraki between 2004–2005. For these cases, the horizontal velocity vectors of the gravity waves and the moving directions of the waves are presented for each season using the Shigaraki station as the origin in Fig. 7. During spring, relatively more parameters were obtained compared to other seasons and waves tended to move northeast. Unlike that at Mt. Bohyun, the distinct bias towards the west in autumn and winter was not observed. Fig. 8 show the characteristics of the atmospheric gravity waves observed at Shigaraki (2004–2005). The geographic locations of Mt. Bohyun(Kim et al. 2010 Fig. 4) and Shigaraki were different but the ranges of the horizontal wavelength, apparent velocity, and apparent period at the two stations were 10–100 km, 5–90 m/s, and 3–40 min, which were consistent with the characteristics of a short-period internal gravity wave.
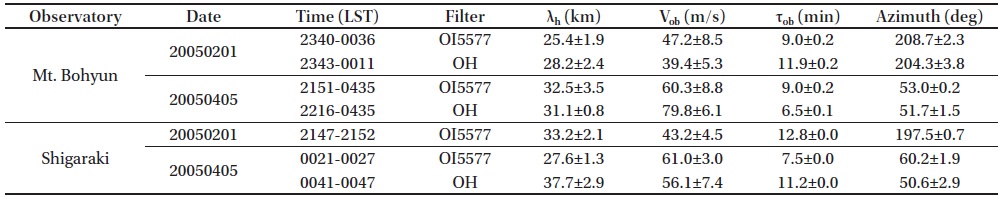
During the common observation period of Mt. Bohyun and Shigaraki (2004–2005), the number of days for obtaining an effective image through same-day observations was only 11 because the weather changed depending on the latitude and longitude of the two regions. Gravity waves were observed on February 1 and April 5, 2005, and the parameters were compared (Table 2). As summarized in Table 2, the waves moved in the same direction each day and their directions observed on the same day showed an error of only several degrees. In addition, the wavelength, velocity, and period for each day were similar. However, it is difficult to suggest that the same gravity wave was observed because the observation times were different and the two sites are approximately 700 km apart. Although the trend and parameters of the waves observed on these two days were similar, it is difficult to suggest that the sources of the gravity waves were identical without further case studies. It is well known that the source of a gravity wave is a local phenomenon that is strongly affected by geography and topography such as mountainous terrain distribution, convection, and weather front. Thus, the gravity waves observed at Mt. Bohyun and Shigaraki might have been formed by a small-scale source that only affected each region. To investigate a large-scale source that simultaneously affects the Korean Peninsula and the Japanese Islands, the parameters of the gravity waves from effective images obtained on the same day (during different years) need to be further examined.
[Table 2.] Parameters of the gravity waves observed on the same day at Mt. Bohyun and Shigaraki
Parameters of the gravity waves observed on the same day at Mt. Bohyun and Shigaraki
To statistically compare the occurrence rate, shape, spatial distribution, and seasonal variation of atmospheric gravity waves over the Korean Peninsula and the Japanese Islands, data for Shigaraki, Japan from January 2004 to December 2005 and Mt. Bohyun from July 2001 to September 2005 presented by Kim et al. (2010) were used. For a consistent comparison, the all-sky image analysis method (Garcia et al. 1997) and gravity wave selection method (Kim et al. 2010) previously used for the Mt. Bohyun data were applied to the Shigaraki all-sky images. The actual observation times at Shigaraki considering the phase of the Moon and the weather conditions were 18,594 min for the OI 557.7 nm airglow filter and 3,163 min for the OH Meinel band filter. A wave phenomenon classified as a gravity wave was observed for 6,860 and 1,068 min. In Mt. Bohyun, the wave observation rates were 30%, 13%, and 17% for the OI 557.7 nm, OH Meinel band, and O2 Atmospheric band filters (Kim et al. 2010). In Shigaraki, the rates were higher at 36% for the OI 557.7 nm and 34% for the OH Meinel band. At both stations, wave phenomena were more frequently observed as the altitude of the airglow layer increased. This is consistent with the theory that atmospheric waves are amplified at a high altitude due to the decrease in atmospheric density.
For 71 wave cases among the 293 all-sky images obtained using the two filters at Shigaraki for two years, the apparent horizontal wavelength, velocity, period, and moving direction were determined. The ranges of the wavelength, apparent velocity, and apparent period were 12–93 km, 18–87 m/s, and 3–30 min, respectively. These values are consistent with the characteristics of a short-period internal gravity wave that is defined by a wavelength range of 10–100 km and a period of less than 1 hr.
The directions of the waves were strongly biased towards the west in autumn and winter as revealed by the Mt. Bohyun data but no distinct seasonal bias was observed in the Shigaraki data. This suggests that the sources of the gravity waves around the two stations were considerably different. If the source of a gravity wave is limited to the lower layer such as the troposphere, only waves in a specific direction would be observed. This is because gravity waves are reflected or absorbed during propagation to the upper layer by the wind in a specific direction that changes seasonally (filtering effect) while passing through the stratosphere and the mesosphere. Therefore, this result suggests that the gravity waves around Shigaraki could be substantially formed at a higher altitude without the filtering effect of the wind that occurs at a medium altitude or at a lower layer.