세계 인구의 2/3 이상이 해안에 살고 있으므로 연안역 개발은 불가피하며, 인간 활동에 기인한 암반조간대 생태계도 심각한 교란에 직면해 있다. 이러한 암반조간대에 서식하는 해조류는 연안생태계의 중요한 일차생산자로서 영양염과 탄소순환에 기여하고 있으며, 어류 및 무척추동물을 포함한 다양한 해양 생물의 은신처, 산란장 및 먹이장으로서 중요한 기능을 수행한다(Lindstrom, 2009; Wan et al., 2009; Whitaker et al., 2010; Janiak and Whitlatch, 2012; Perkol-Finkel et al., 2012; Satheesh and Wesley, 2012). 이외에도, 해조류 군집은 해양에 유입되는 유기 및 무기 오염물질을 제거하는 생물여과자(bio filter)로써 역할을 하지만, 반대로 서식지 환경(교란, 혹은 오염)의 변화됨에 따라 군집구조가 바뀌기 때문에(Lemieux and Cusson, 2014), 연안의 환경상태의 안정도를 평가하는 생물지표자로도 이용된다(Worm et al., 2000; Piazzi and Cinelli, 2001; Orfanidis et al., 2003; Rindi and Guiry, 2004; Wells et al., 2007; Scherner et al., 2013).
연안생태계에서 형태와 구조적 복잡성 및 종다양성을 가진 해조류 군집은 해양생물의 종다양성을 증가시키는 생물공학자(bioengineer)의 역할을 하며, 환경오염의 경고자로서 관심이 증대되고 있다(Feely et al., 2004; Pandolfi et al., 2011; Perkol-Finkel et al., 2012; Satheesh and Wesley, 2012). 최근에 온실가스인 CO2 의 증가로 인한 수온 상승과 CO2 농도 증가에 따른 해양산성화, 그리고 조식동물의 증가로 인하여 연간 4억 6천만 톤의 탄소를 흡수하는 해중림이 지속적으로 감소되고 있어(Harley et al., 2012; Muraoka, 2004; Ordoñez et al., 2014), 해중림 복원에 대한 연구가 많이 수행되고 있다(Whitaker et al., 2010; Perkol-Finkel et al., 2012). 따라서, 지구온난화와 연안의 환경 상태 변화를 반영하는 지표생물인 해조류의 종다양성과 군집구조 변화에 대한 자료 축적이 매우 중요한 시점이다(Orfanidis et al., 2001; Diaz-Pulido et al., 2011; Roleda et al., 2012).
우리나라 암반해안에 서식하는 해조상에 대한 연구는 일본인 Okamura (1892)에 의해 최초로 시작되었으며, 한국인으로서는 Kang (1966)에 의해 지역별 출현종 연구를 근거로 지리학적 분포가 구분되었다. 이후, 국내 해조류 연구는 방형구를 이용한 피도와 빈도 측정을 통한 우점종과 수직분포를 규명하였으며, 계절별 생물량의 변동 등에 대한 정성 및 정량 평가가 이루어졌다(Song, 1971; Lee et al., 1975; Kim, 1983; Sohn, 1987; Yoo and Kim, 1990).
또한, 해조류의 형태 및 생존전략에 따라 6개 기능형 그룹(엽상형, 사상형, 성긴분기형, 다육질형, 유절산호말형, 각상형)이 구분되었고, 그들의 구성비율로 연안역의 환경상태가 평가되었다(Littler and Littler, 1984; Steneck and Dethier, 1994; Padilla and Allen, 2000). 이외에도, Orfanidis et al. (2003)은 해조류 출현종의 외형, 생장률, 표현형의 적응성, 수명 및 천이 속도를 고려하여 5개 기능형으로 구분된 후 생태학적평가지수(EEI, ecological evaluation index)가 제시되었다.
현재, 해양국립공원은 연안 개발과 관광객 증가로 유·무기 오염물의 유입량이 급증하고 있으며, 심각한 환경변화가 일어나고 있다(Choi, 2008; Ahn et al., 2013). 이러한 해양국립공원의 연안생태계 건강도에 대한 등급을 판단하고 지속가능하도록 유지하기 위하여 관리가 매우 필요한 시점이다. 따라서, 본 연구는 해양국립공원 내 서식하는 해조류의 군집구조의 특성과 각 국립공원의 생태학적평가지수(EEI)를 판단하고 관리하고자 수행하였다.
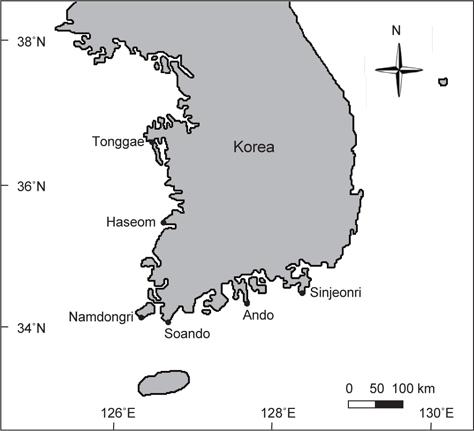
해양국립공원 내 6개 정점(통개-태안, 하섬-변산, 남동리-진도, 소안도-완도, 안도-여수, 신전리-통영)에서 2015년 3월부터 11월까지 계절별로 최 간조기에 해조류를 정량 및 정성 채집하였다(Fig. 1). 정량조사는 조간대 상·중·하부에 각 2-3개의 방형구(50 cm × 50 cm)를 무작위적으로 놓고 방형구 내에 존재하는 해조류를 전량 채집하였으며, 해조상을 파악하기 위하여 다양한 기질과 조위에서 서식하는 모든 해조류를 정성 채집하였다. 채집된 해조류는 포르말린-해수 용액(5-10%)으로 현장에서 고정시켜 실험실로 운반한 후 현미경을 사용하여 분류 및 동정하였으며, 출현종 목록 및 국명은 국가 생물종 목록집(Kim et al., 2013)에 따랐다. 정량 채집된 해조류는 담수로 수회 세척하여 모래와 불순물을 제거하고, 종별로 구분하여 105℃로 설정된 건조기에서 24 h 동안 건조한 후 건중량을 측정하였고 단위 면적당 생물량(g dry wt./m2)으로 환산하였다. 해조류 종별 평균 생물량과 단위면적당 생물량 구성비(%)를 구하여 생물량 구성비가 30% 이상인 종은 우점종으로, 10-30%인 종은 준우점종으로 구분하였다(Kim et al., 1995; Kim et al., 1997). 또한, 정점별 출현종과 생물량 자료를 이용하여 풍부도지수(richness index, R), 다양도지수(diversity index, H')와 균등도지수(evenness index, E)를 계산하였다(Margalef, 1958; Fowler and Cohen, 1990). 우점도지수(dominance index, DI)는 군집 내에서의 생물량 순서에 따라 제1, 2우점종을 선택하고 2종의 생물량 합에 대한 총 생물량의 비율로 산출하였다(McNaughton, 1967; Lee et al., 1983).
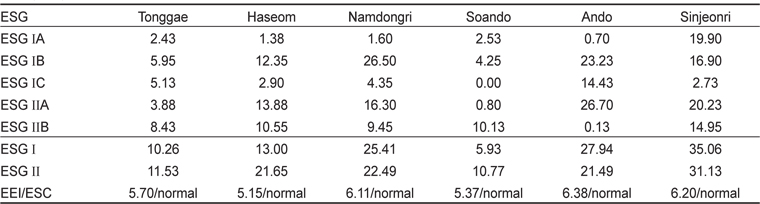
해조류의 기능형은 출현종의 외부형태, 내부구조, 광합성효율 등에 따라 엽상형, 사상형, 성긴분기형, 다육질형, 유절산호말형, 각상형의 6개 그룹으로 구분하고(Littler and Littler, 1984), Orfanidis et al. (2003)이 엽상체의 외형, 생장속도, 표현형의 적응성, 엽상체의 수명 및 천이속도를 고려하여 제시한 출현종을 5개 그룹(ESGⅠA=thick perennial; ESGⅠB= thick plastic; ESGⅠC=shade-adapted plastic; ESGⅡA= fleshy opportunistic; ESGⅡB= filamentous sheet-like, opportunistic.)으로 구분하고 이를 생태학적상태그룹Ⅰ(ecological status group, ESG)과Ⅱ로 구분하였다. Orfanidis et al. (2003)의 ESGⅠ과Ⅱ을 이용하여 EEI 등급을 구하는 공식은 다음과 같다.
ESG Ⅰ(% coverage) = [(ⅠA*1)+(ⅠB*0.8)+(ⅠC*0.6)] = x
ESG Ⅱ(% coverage) = [(ⅡA*0.8)+(ⅡB*1)] = y
EEI = a + b*(x/100) + c*(x/100)2 + d*(y/100) + e*(y/100)2 + f*(x/100)*(y/100)
a = 0.4680; b = 1.2088; c = -0.3583; d = -1.1289; e = 0.5129; f = -0.1869
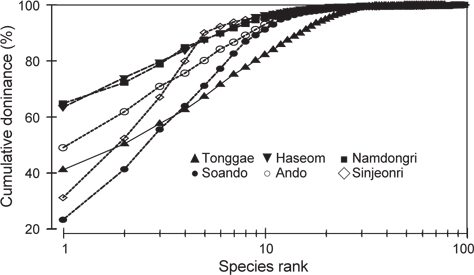
해조상의 특성을 파악하기 위하여 정성 채집된 해조류를 분류 및 동정한 후 출현종 수로 갈조류에 대한 녹조류의 비(C/P), 갈조류에 대한 홍조류 비(R/P), 갈조류에 대한 녹조류 및 홍조류의 비로 (R+C)/P를 구하였다(Feldmann, 1937; Segawa, 1956; Cheney, 1977). 해조류의 생물량으로 K–dominance 곡선을 그렸으며(Lambshead et al., 1983), 군집지수의 산출 및 도식화에는 PRIMER version 6 (Clarke and Gorley, 2006)을 사용하였다.
본 연구기간에 해양국립공원 내 6개 정점에서 출현한 해조류는 총 193종(녹조류 27종, 갈조류 40종, 홍조류 126종)이었으며, 홍조류는 전체 출현종인 65.28%를 차지하여 녹조류와 갈조류에 비해 출현 빈도가 높았다. 정점별 출현종수는 하섬에서 72종으로 가장 적었고 신전리에서 104종으로 가장 많았다(Table 1). 해양국립공원 6개 정점에서 연중 관찰되는 해조류는 잎파래(
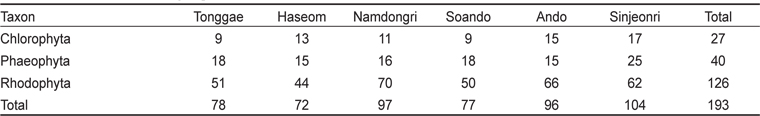
The number of macroalgal species observed at Marine National Park, western-southern coasts of Korea
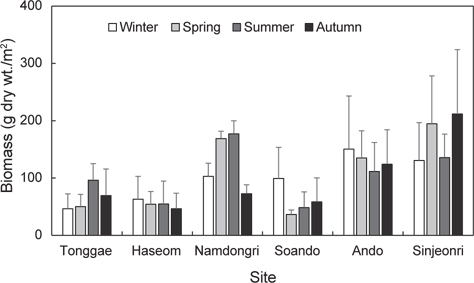
해양국립공원에 서식하는 해조류의 연평균 생물량(g dry wt./m2)은 101.50 g dry wt./m2이였고 신전리에서 168.12 g dry wt./m2로 최대였고 하섬에서 54.49 g dry wt./m2로 최소였다. 6개의 연구정점에서 계절별 생물량은 97.03–106.45 g dry wt./m2로 추계에 최소였고 춘계에 최대로 확인되었다. 정점별 생물량을 보면, 태안군 통개에서 46.21–96.18 g dry wt./m2로 동계에 가장 낮았고 하계에 가장 높은 값을 보였다. 하섬의 해조류 생물량은 계절별 변동이 거의 없었으며, 남동리에서는 72.62–176.96 g dry wt./m2로 춘계와 추계에 생물량이 높게 나타났다. 소안도에서 해조류 생물량은 동계에 99.07 g dry wt./m2로 최대값을 기록하였으며, 다른 계절에는 큰 변화가 없었다. 또한, 안도의 생물량은 111.41 g dry wt./m2으로 하계에 최소였고 동계에 150.36 g dry wt./m2로 최대로 나타났다. 신전리에서 생물량은 동계에 130.58 g dry wt./m2로 최소였고 추계에 211.61 g dry wt./m2으로 최대로 확인되었다(Fig. 2).
해조류의 연평균 생물량의 구성비를 근거로 한 우점종(> 30%)과 준우점종(10-30%)을 살펴보면, 통개에서 지충이 생물량은 전체 생물량(65.44 g dry wt./m2)의41.12%로 우점 하였으며, 하섬에서도 지충이(63.67%, 34.69 g dry wt./m2)가 우점종이었으며, 전체 생물량(54.49 g dry wt./m2)의 10.74%를 차지하는 구멍갈파래가 준우점종이었다. 남동리에서는 지충이(65.14%, 84.84 g dry wt./m2)가 최대 생물량을 보였고, 소안도에서는 전체 생물량의 30%이상인 종은 없었으며, 톳(23.58%, 14.28 g dry wt./m2), 잎파래(18.04%, 1,093 g dry wt./m2)와 패(14.54%, 8.81 g dry wt./m2)가 준우점종으로 나타났다. 안도에서도 지충이(49.33%, 64.19 g dry wt./m2)가 우점하였으며, 돌가사리(12.98%, 16.89 g dry wt./m2)가 준우점하였고 신전리에서는 지충이(31.98%, 53.77 g dry wt./m2)가 우점하는 가운데 패(21.32%), 개서실(14.74%), 톳(12.88%) 그리고 구멍갈파래(10.16%)가 준우점종으로 분포하였다(Table 2, Fig. 3).
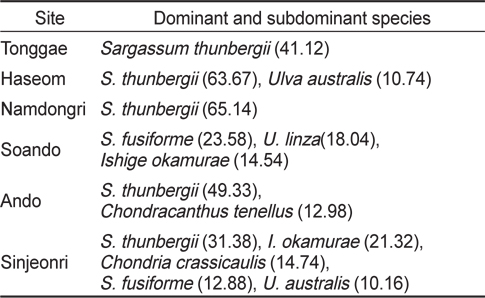
Dominant (≥ 30%) and subdominant (10-30%) species in terms of average biomass percentage (%) at six study sties in Marine National Park, western-southern coasts of Korea
해조류 생물량과 출현종수로 계산된 군집지수를 살펴보면, 해양국립공원의 정점별 평균 우점도지수(DI)는 0.55였고 신전리에서 0.31으로 최소였고 소안도에서 0.69로 가장 높았다. 풍부도지수(R)는 평균 8.63으로 나타났으며 하섬(7.30)에서 최소였고 남동리(10.06)에서 최대였다. 출현종수와 생물량에 따라 변화하는 균등도지수(J')는 정점별 평균 0.40을 보였으며 하섬과 남동리에서 0.33으로 최소였고 통개에서 0.49로 최대를 보였다. 출현종수와 종간의 풍부도 데이터(생물량)의 분포인 균등도지수에 의해 결정되는 다양도지수(H')는 하섬(1.15)에서 최소, 통개(1.86)에서 최대값을 나타냈다. 해조상의 지역적 특성을 나타내는 C/P, R/P, (R+C)/P값은 각각 0.50-1.00, 2.52-4.38, 3.20-5.40의 범위로 해상해안국립공원은 온대 및 열대 사이의 혼합형 해조상을 나타냈다(Table 3).
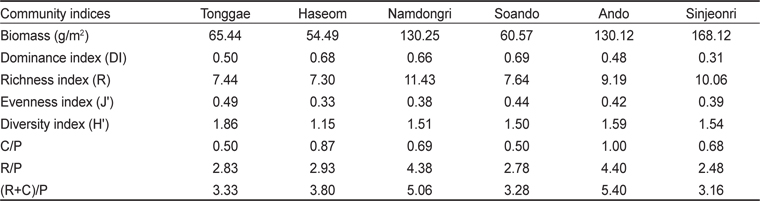
Average biomass (g dry wt./m2) and various community indices of seaweeds at the six study sites in Marine National Park, western-southern coasts of Korea
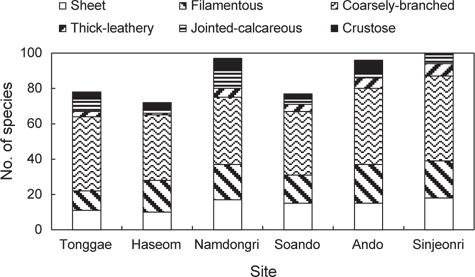
해양국립공원 6개 정점에서 출현한 해조류를 기능형 그룹을 보면, 엽상형은 10-18종으로 하섬에서 최소, 신전리에서 최대를 보였고, 사상형은 11-22종으로 통개에서 최소, 안도에서 최대를 보였다. 성긴분기형은 36-48종으로 소안도에서 최소였고 신전리에서 최대였으며, 다육질형은 1-7종으로 하섬에서 최소였고 신전리에서 최대로 확인되었다. 유절산호말형은 2-10종으로 하섬에서 최소, 남동리에서 최대였고, 각상형은 소안도에서 3종으로 최소, 남동리에서 7종으로 최대를 보였다. 또한, 생태그룹 ESGⅡ의 출현종 비율을 살펴보면, 통개에서 28.21%로 최소, 소안도에서 40.26%로 최대를 보였다(Fig. 4).
연구정점 6곳의 해조류 출현종을 Orfanidis et al. (2011)가 제안한 5개 기능형으로 구분한 후 종별 연평균 피도를 이용하여 생태학적상태등급을 구분한 결과 EEI값은 하섬에서 최소(5.15)였고 안도에서 최대(6.38)로 확인되었으며, 해양국립공원 조사정점의 평균값은 5.82로 보통(normal)으로 확인되었다(Table 4)

Evaluation of ecological status classes and community stability using ESG based on seaweed coverage as modified by Orfanidis et al. (2003)
해양국립공원 내 6개 정점에서 출현한 해조류는 총 193종(녹조 27종, 갈조 40종, 홍조 126종) 이었으며, 정점별로 72-104종으로 확인되었다. 인근 해역의 해조류 출현종수는 서해안에 위치한 태안군 학암포에서 2007-2010년까지 58-65종이 확인되었으며(Heo et al., 2015), 변산 5개 정점에서 68종(Han et al., 2014), 고군산군도 7개 정점에서 58종(Kim et al., 2011)으로서, 본 연구 정점에서 출현한 해조류 종수(통개 78종, 하섬 73종)는 인근 해역에 비해 높은 수준이었다. 이외에도 서남해안에 위치한 해남에서 87종(Oh et al., 2002), 진도 금갑에서 56종(Yoo et al., 2015), 고흥군 무인도서에서 80종(Song et al., 2011), 관매도와 영산도에서 89종(Han et al., 2016), 완도 정자도에서 112종(Yoo et al., 2014)이 서식하는 것으로 확인되었다. 남해 동부에 위치한 통영에서 82종(Park et al., 2011), 남해 고성에서 102종(Kang and Nam, 2015), 한려해상국립공원 해역에서 145종(Oh et al., 2015)으로 나타났다. 따라서, 2015년도에 채집된 해양국립공원 해역에 서식하는 해조류의 종수는 선행연구결과에 비해 많은 것으로 확인됨으로써 국립공원이 타해역에 비해 청정한 곳으로 판단된다. 이에 따라 해양국립공원내 해역은 해조류 서식지로 적합한 환경이라고 할 수 있으며, 청정해역인 해양국립공원을 보전하기 위하여 좀더 지속적인 모니터링으로 자료를 축적하고 해조류의 종다양성을 확보하기 위한 관리방안을 마련해야 할 것으로 사료된다.
본 연구에서 해양국립공원 내 해조류의 연평균 생물량은 101.50 g dry wt./m2로 변산 하섬에서 최소(54.49 g dry wt./m2)였고 통영 신전리에서 168.12 g dry wt./m2 로 최대였다. 해조류 생물량은 태안 학암포에서 88.78 g dry wt./m2였으며(Heo et al., 2015), 변산에서 91.45 g dry wt./m2 (Han et al., 2014), 관매도와 영산도에서 115.89 g dry wt./m2 (Han et al., 2016), 완도 정자도 에서 154.78 g dry wt./m2를 보였다(Yoo et al., 2014). 또한, 고흥군 4개의 무인도서의 하계 생물량은 평균 50.85 g dry wt./m2를 보였다(Song et al., 2011). 통영에서 생물량은 622.61 g wet wt./m2를 보였다(Park et al., 2011). 이외에도 한려해상국립공원 내 9개 정점에서 358.00 g dry wt./m2 (Oh et al., 2015), 경남 욕지도 인근 해역의 생물량은 235.30 g wet wt./m2 였다(Choi et al., 2008). 본 연구에서 해조류 생물량은 건중량으로 측정하여 습중량으로 측정한 결과와의 직접적인 비교는 어렵지만, 건중량(습중량의 1/5)으로 환산하면(Tanigychi, 1998), 진도 금갑의 연평균 생물량 109.79 g dry wt./m2 (Yoo et al., 2015), 남해 고성에서 263.12 g dry wt./m2 (Kang and Nam, 2015), 통영에서 생물량은 124.52 g dry wt./m2 (Park et al., 2011)으로 추정할 수 있다. 금번에 조사된 해양국립공원 해역의 해조류 생물량은 국립공원 외해에 위치한 정점보다 내해에서 높은 생물량을 보여 해조류가 살기에 적합한 환경으로 판단되어진다.
해조류는 형태 및 생태학적 특성에 따라 비교적 안정된 해역에서 서식하는 다육질형, 성긴분기형, 유절산호말형, 각상형 해조류(ESGⅠ)와 교란이나 환경오염 해역에서 빠른 생장을 보이는 엽상형과 사상형 해조류(ESGⅡ)로 구분되고 기능형군 구성비율은 해조류 서식 환경상태와 밀접한 관련을 보인다고 알려져 있다(Arévalo et al., 2007; Littler and Littler, 1984; Orfanidis et al., 2001; Pinedo et al., 2007; Wells et al., 2007). 본 연구에서는 ESGⅡ의 비율이 36.92%로 나타났으며, 태안 학암포에서 34.65% (Heo et al., 2015), 고군산군도 44.8% (Kim et al., 2011), 진도 금갑 32.14% (Yoo et al., 2015) 고흥군 4개 정점에서 33.96%로 나타났다(Song et al., 2011). 본 연구 해역은 ESGⅡ의 비율이 다른 해역과 유사하여 아직까지는 해조류가 서식하기에 안정된 환경으로 판단된다. 또한, 생태학적상태지수(EEI) 값이 6보다 높으면 안정된 영안 생태계로 생태학적상태등급을 양호(good) 또는 매우 양호(very good)로 판단하고 6보다 낮을 경우 생태계의 복원이 필요하다고 평가하였다(Orfanidis et al., 2001, 2003; Ponti et al., 2009). 본 연구에서는 사상형 및 엽상형 해조류가 우점하는 하섬에서 5.15로 가장 낮은 EEI값을 보였고, 안도에서 6.38로 가장 높은 EEI값을 보였다. 그리고 해양국립공원 평균 EEI값은 5.82로서 보통(normal)등급으로 확인되었다. 국내의 대부분 연구에서는 Littler and Littler (1984)의 분류방식으로 환경영향 평가를 함으로써 Orfanidis et al. (2011)의 EEI값과 직접적인 비교가 힘들어 국내 연안의 생태학적상태등급을 알기 위해서는 학자들의 보다 많은 연구가 필요할 것이다.
현재, 해양국립공원은 화려한 경관과 해수욕장이 잘 발달되어 다양한 해안 레저와 관광을 위해 방문객이 증가하면서 방문객에 의한 환경변화가 심할 것으로 예측되는 지역이나 국립공원 외부에 위치한 정점들보다 높은 종조성, 생물량 등을 보이고 있어 양호한 환경상태로 판단되어진다. 그러나 해양국립공원 내 해조류에 대한 연구와 모니터링은 지속적으로 이루어지지 않아 국립공원 내 해양서식지를 관리하기 위한 기초자료가 부족한 실정이다. 이에 따라 해양국립공원 내의 해양서식지 보전 및 가치 증대를 위해서는 생태계의 기초생산자이자 서식지 역할을 하는 해조류를 지속적인 모니터링을 통하여 자료를 축적하고 이를 통하여 관리방안 마련에 기초자료로서 사용되어야 될 것이다.