Plasmas support a wide variety of plasma waves that carry information to remote observers (Lee et al. 2014; Hwang 2015). Ultra-Low Frequency (ULF) waves in the ion cyclotron range of frequency, which can interact with electrons and ions (Rauch & Roux 1982;Horne & Thorne 1997; Song et al. 1999), are often observed in planetary magnetospheres (Russell et al. 2008; Boardsen et al. 2012) as well as in Earth’s magnetosphere and ionosphere (Kim et al. 2010, 2011b).
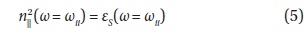
In the ion cyclotron frequency range, the wave dispersion relations can be simplified to
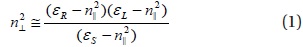
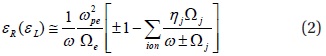
where n is the wave refractive index (kc/ω), and subscripts ⊥ and || represent the perpendicular and parallel directions to the ambient magnetic field (B0), respectively. εR,L,S are the tensor elements for multiple ions,
and
where ω = 2πf is the angular frequency, ωpj(e) and Ωj(e) are the plasms and cyclotron frequencies of jth ion (electron), respectively, and ηion=Nion/Ne is the ratio of the ion density (Nion) to electron density(Ne).
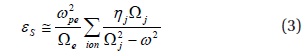
For perpendicular propagation (n||→0), the dispersion relation in Eq. (1) exhibits a resonance (n⊥→∞) where eS(ωbb) = 0,
which is Buchsbaum frequency (bi-ion frequency (bi-ion frequency) (Buchsbaum 1960). For oblique propagation (n|| ≠ 0), the perpendicular resonance (n⊥→∞) occurs at the location (ωii(x) = ω) where
Between each pair of gyrofrequencies, there is a mode conversion location that is referred to as the Ion-Ion Hybrid (IIH) resonance, with a corresponding frequency (ωii) called the IIH frequency (Lee et al. 2008). When Fast compressional Waves (FWs), propagating across magnetic flux surfaces and satisfying the IIH resonance condition, encounter inhomogeneity for the heavy ion concentration and/or magnetic field strength, it may be possible for the wave to satisfy the resonance condition (5), where energy from incoming FWs concentrates at the IIH resonance location and the mode converts to field-aligned propagating IIH waves that satisfy the dispersion relation of
The IIH resonance can exhibit significant differences because of the different conditions in planetary magnetospheres. For Mercury, where the magnetic field is relatively weak, the wavelength of field-aligned modes can be comparable to the size of the magnetosphere. Therefore, IIH waves oscillate globally along the magnetic field lines for Mercury, similar to the field line resonance on Earth (Othmer et al. 1999; Glassmeier et al. 2003, 2004; Klimushkin et al. 2006; Kim et al. 2008, 2011a, 2013, 2015a, b). On the other hand, on Earth, the magnetic field strength is larger and the wavelength is shorter, which typically localizes mode converted waves between the Buchsbaum cutoff locations, which occur at around 10 degrees latitude. The modes that result from mode conversion are typically linearly polarized ElectroMagnetic Ion Cyclotron (EMIC) waves, which can be generated via mode conversion near the IIH resonance location (Lee et al. 2008). These waves have a significantly different polarization from EMIC waves, which are excited by proton temperature anisotropy (Cornwall 1965; Kennel & Petschek 1966; Williams & Lyons 1974a, b; Taylor & Lyons 1976). Because the incoming FW absorption at the IIH resonance (the generation of linearly polarized EMIC waves) occurs at a limited wave frequency and heavy ion density ratio, linearly polarized waves can be used as a diagnostic tool to estimate the heavy ion density ratio (Kim et al. 2015c).
In planetary magnetospheres, as the mode-converted IIH waves near the magnetic equator propagate to higher magnetic latitudes, the waves reach cutoff (n|| = 0 and εS = 0) at ω = ωbb and parallel resonance (n||→∞ and εS→∞) locations at ω = Ωion. Because the IIH waves are partially reflected at the Buchsbaum resonance location where ω = ωbb, the waves are possibly localized near the magnetic equator between two Buchsbaum resonance locations (Klimushkin et al. 2010; Vincena et al. 2011). The localization of modeconverted IIH waves is referred to as IIH Alfven resonance, and is experimentally detected in laboratory plasmas (Vincena et al. 2011, 2013; Farmer & Morales 2014).
Recent 2D full wave simulations of Mercury’s dipolar magnetosphere (Kim et al. 2015a), which assumed constant particle densities, clearly showed the reflection of the IIH resonant waves at the Buchsbaum resonance location and wave tunneling through the wave stopgap between cutoff and resonance. However, as shown in Eq. (4), the Buchsbaum frequency is a function of the heavy ion density concentration ratio as well as the ambient magnetic field strength. Therefore, it is useful to examine the solutions of IIH resonant waves in more detail to determine how the wave structure and absorption of energy depend on variations in the magnetic field strength and density.
In this paper, we use a multi-ion fluid wave code to demonstrate mode conversion that occurs at the IIH resonance when impulsive FWs enter the plasma with a 2D inhomogeneous density structure, which is assumed to result from the sputtering of material from the surface of Mercury. We find that mode converted IIH waves can be localized in the density well along the magnetic field line, and also exhibit harmonic frequency structure.
We employ the fluid wave simulation model developed by Kim & Lee (2003). Similar to previous wave simulations (Kim et al. 2008, 2013), we adopt the plasma conditio ns present on Mercury, and thus the background magnetic field (B0 = 86 nT) and the electron density (Ne = 3 cm-3) are assumed to be constant. The ambient magnetic field lies in the Z direction and the inhomogeneity is introduced in the x-z plane. We limit ourselves in that all perturbations are proportional to exp(ikyy), where ky is the given wavenumber in the y direction and, for the sake of simplicity, is assumed to be 0. Because the magnetopause of Mercury is located near 1.4 RM (Anderson et al. 2011), we assume a shorter radial distance of 1 RM than the magnetopause location in the X direction, where RM is the radius of Mercury. The length in the Z direction (Lz) is assumed to be 0.93 RM, which is similar to field line length at LM = 1.5 in dipole coordinates, where LM is the magnetic L-shell number for Mercury. We adopt a grid with dimensions Nx × Nz = 300×100, and to save computing time, the ratio of proton mass (mH) to electron mass (me) is assumed to be 100 (mH/me = 100).
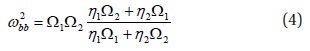
Because sodium is one of the major heavy ions on Mercury (Zurbuchen et al. 2011; Raines et al. 2014), we adopt an electron-proton-sodium plasma, similar to previous numerical studies (Kim et al. 2008, 2011a). We assume the sodium density (NNa) has a minimum value (i.e., sodium density well) at the center of the simulation domain, as shown in Fig. 1. The electron density is assumed to be the sum of the ion densities. Thus, the ratio of the proton density to electron density is ηH = NH/Ne = 1 – ηNa, where ηNa = NNa/Ne, and ηH is maximum in the middle of the simulation domain.
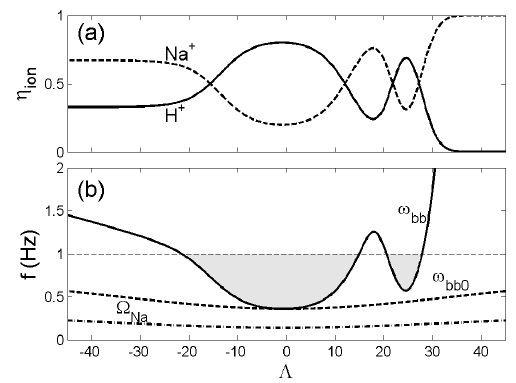
The simulation is driven by imposing an impulse in Ey at X =x/Lx = 1 during the interval 0 ≤ τ =t/tci ≤ 2.5, where tci = 2π/ΩH, as shown in Fig. 2(a) and 2(b) shows the initial field-aligned wave structures along Z = z/Lz at X = 1. Because the width of the source is closely related to the initial wavevector, a wide source corresponds to a more perpendicular propagation. The boundaries become perfect reflectors after the impulsive stimulus ends (τ = 2.5), and thus the total energy in the box model will remain constant in time after this interval.
We stored the time history of the electromagnetic fields at each grid point (X, Z) during the simulation run time (0 < τ < 55) and obtained the wave power spectra using a fast Fourier transform. To examine wave properties along and across the magnetic field line, we selected two points in X and Z, with X0 = 0.55 and Z0 = 0.7, as shown in Fig. 1. Under the given conditions, and because the density inhomogeneity lies in the X and Z directions, Ex represents the mixture of the IIH resonant wave and FW modes, while Ey shows the pure FW mode.
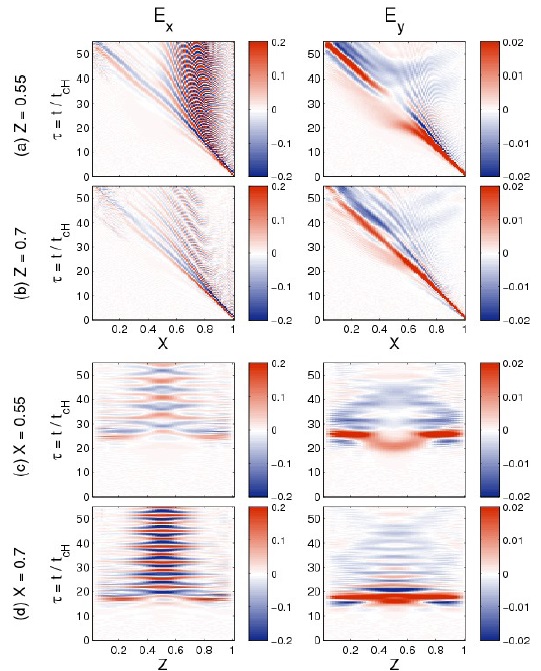
Figs. 3(a) and 3(b) show the time history of the transverse component of B0 of the electric fields (Ex and Ey) along X at Z = Z0. In this figure, the FWs launched at X = 1 propagate toward the Na+ density well and reach the inner boundary at X = 0. The evidence of a wave stopgap and wave tunneling near X ≈ 0.5 at Z = 0.55 are also found in Ey. On the other hand, as soon as the FW packet reaches the region 0.5 < X < 1, the IIH resonant wave modes exhibit standing oscillations in Ex and the period of the oscillation decreases as X decreases (decreasing ηNa concentration). However, for X < 0.5, no oscillation of the mode-converted waves is found in Ex.
The wave time history along the Z direction at X = X0 is plotted in Figs. 3((c) and 3((d). In this case, the FWs in the Ey component reach the boundaries in a short time and reflect. In this figure, it can be seen that Ey in each location along Z has a different period of wave oscillation. Near the boundaries, Ey exhibits a mixture of long and short period waves, while long period waves only appear near the center of the Z direction. On the other hand, waves with Ex polarization are localized to within the middle of Z. As shown in Figs. 3(a) and 3(b), the wave periods at Z = 0.55 are lower than at Z = 0.7.
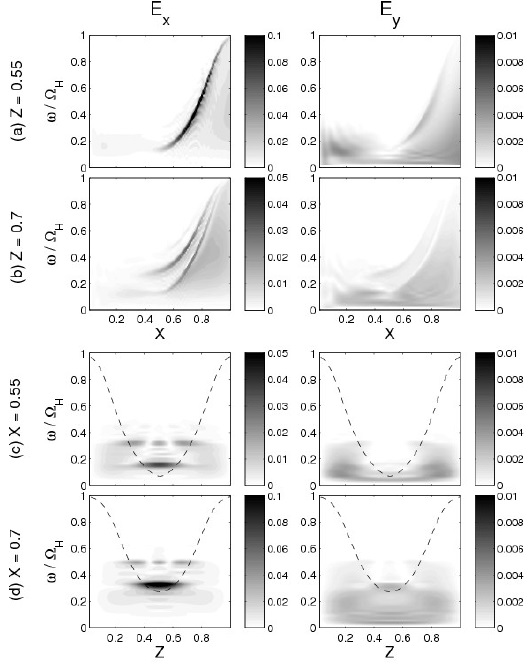
Fig. 4 shows the wave spectra of Ex and Ey. Ex in Figs. 4(a) and 4(b) shows a strong continuous band at the IIH resonance wave in the X direction, which is consistent with previous numerical results. Because the field-aligned wavenumber is not fixed, several harmonics of the IIH waves can be seen. The wave power spectra along Z in Figs. 4(c) and 4(d) also clearly show that the mode-converted IIH waves have several eigenfrequencies and are localized between the two Buchsbaum resonance locations. The second harmonic of the IIH waves has a node near Z = 0.55 and an antinode near Z = 0.7; therefore, Ex only shows a strong fundamental band in Fig. 4(a) but strong fundamental and second harmonics in Fig. 4(b).
The FWs in the Ey component propagate to the middle of the simulation domain and energy in high frequencies, where the strong continuous band appears in Ex, cannot reach the inner boundary at X = 0. The inaccessibility occurs because FWs propagating from Na+-rich to H+-rich plasma directly encounter the IIH resonance location where strong energy absorption occurs (up to 100% as predicted by Lee et al. 2008). For waves with ω/ΩH < 0.3, the FWs are partially absorbed at the IIH resonance location and the rest of the energy can reach the FW cutoff locations where and then encounter another IIH resonance location at X < 0.5. However, when waves propagate from H+-rich to Na+- rich plasma, wave absorption only occurs in the limited frequencies and the absorption coefficient is much lower than that of the opposite case, with no continuous band at the IIH resonance appearing.
In this paper, we show how mode-converted IIH waves can be localized in a heavy ion density well in slab coordinates. Because the Buchsbaum frequency increases as the heavy ion density concentration ratio increases, an irregular ion density structure along the field line can lead to an asymmetric structure of the Buchsbaum frequency. Our results, therefore, emphasize the importance of field-aligned heavy ion density structures for ULF wave propagation. It should be noted that equilibria in magnetospheres with rotational disks generally have density structures along the magnetic field lines due to centrifugal acceleration, which concentrates the heavy ions into the magnetodisk.
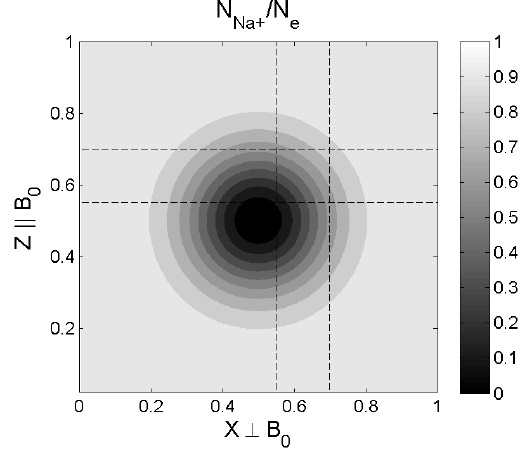
In Fig. 5, we demonstrate how asymmetry in the ion density ratio affects the field-aligned wave propagation. We assumed the field-aligned density structure of ηNa and ηH at Mercury, as shown in Fig. 5(a), and calculated the Buchsbaum frequency, as shown in Fig. 5(b). When plasma contains a constant sodium density of ηNa = 20% and the Buchsbaum frequency (ωbb0), wave frequencies that are higher than the highest Buchsbaum frequency do not encounter the cutoff condition, and thus can globally oscillate in a manner similar to the field-line resonance on Earth (Lee & Lysak 1989). However, for an asymmetric structure of the ion density, waves generated near the magnetic equator with 1 Hz can be localized between -21.7 < Λ < 15. In addition, if the waves can tunnel through the small bump of the Buchsbaum frequency, the waves can reach the secondary density well and are possibly localized between 20.5 < Λ < 27.9.
Interestingly, the Buchsbaum resonance is also a cutoff condition of the Left-Hand Polarization (LHP) EMIC waves (Johnson et al. 1995). In Earth’s magnetosphere, as these waves propagate along B0, the wave normal angle increases and becomes nearly 90° when waves reach the Buchsbaum resonance. The waves then reflect toward a higher L-shell and lower magnetic latitude (Kim & Johnson 2015) . Because both reflected IIH waves (Kim et al. 2015a) and LHP EMIC waves (Kim & Johnson 2015) at the Buchsbaum resonance propagate to the different L-shells in the dipole field configuration, how 2D/3D heavier ion density structures in the planetary magnetosphere relate to propagation characteristics of the IIH and LHP EMIC waves remains as future work.
In summary, we investigate how mode-conversion at the IIH resonance occurs when heavy ion density has transverse and longitudinal inhomogeneity in slab coordinates. The multi-ion simulation results show that the IIH waves have a continuous band across the field line, which is consistent with previous numerical studies. These waves also have harmonic structures in frequency domain and are also localized in the field-aligned heavy ion density well.