In order to convert wave energy into large quantities of high-efficiency power, it is necessary to study the optimal converter system appropriate for the environment of a specific open ocean area. A wave energy converter system with a counterweight converts the translation energy induced from the heave motion of a buoy into rotary energy. This experimental study evaluated the primary energy conversion efficiency of the system, which was installed on an ocean generating basin with a power take-off system. Moreover, this study analyzed the energy conversion performance according to the weight condition of the buoy, counter-weight, and flywheel by changing the load torque and wave period. Therefore, these results could be useful as basic data such as for the optimal design of a wave energy converter with a counterweight and improved energy conversion efficiency.
The wave energy resources distributed around the globe are estimated to be about 1–10 TW. The wave energy in Korea is estimated to be 6,500 MW; and if offshore zones are included, it is 50 GW, which represents an enormous amount of wave energy resources. In particular, the eastern and southern coasts of Korea have relatively high wave energy densities, and thus are regarded as suitable areas for wave energy conversion (WEC) (Cho et al., 2011; Korea Maritime Institute, 2010).
The United Kingdom is taking the lead in the field of WEC, followed by the United States, Canada, and Norway (Ocean Energy Systems, 2007). In the case of Korea, the technical skill levels are insufficient. However, the technical skills of other countries, excluding the United Kingdom and United States, are not significantly different, and it is expected that if Korea spurs technology development, it will be possible to join the countries with advanced WEC technology (Korea Maritime Institute, 2010).
The energy conversion efficiency of a WEC system is still lower than that of wind power generation. Thus, commercialization is difficult at this time. In particular, a movable body type WEC has many advantages compared to other power generation methods. However, its commercialization is still difficult because the economic efficiency is low as a result of the high power generation cost due to durability problems and high initial cost/maintenance cost (Korea Maritime Institute, 2010). Therefore, the technical ability to absorb energy even at wave heights with low economic efficiency needs to be developed, along with a high-efficiency energy conversion system.
An existing representative foreign system is “Wave Star” made by the Wave Star Energy Company of Denmark. This is a movable body type, and is at the verification stage in an actual sea area. Its actuator is an arm type and has a hydraulic cylinder (Wave Star Energy, 2004; Wave Star Energy, 2006). Most domestic studies on the counterweight type have used theoretical analyses and model tests to estimate the generation power and efficiency (Han et al, 2015; Lee et al, 2015; Sim et al, 2015; Jung, 2010).
This study attempts to evaluate the effect of the weight of the buoy, counterweight, and flywheel on the generation characteristics and conversion efficiency, and to determine the optimum WEC conditions according to the wave period. In particular, the optimal torque and RPM results could be used as basic information for controlling the appropriate generator condition. In addition, this study confirmed the suitability of using WEC in domestic seas by referring to the wave energy distribution at Jeju Island.
2. Configuration and Principle
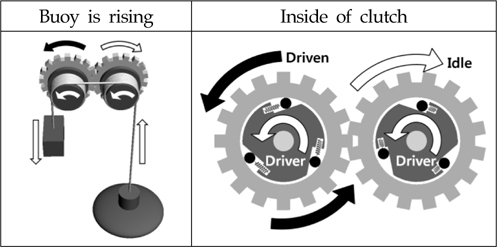
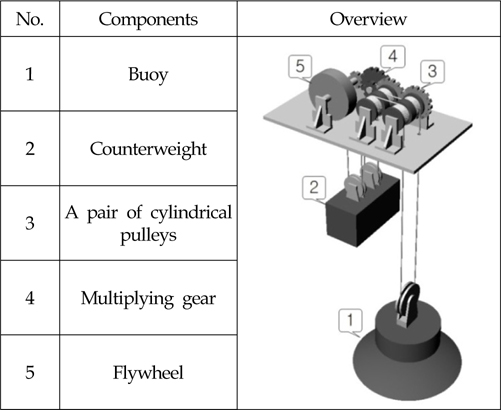
The WEC system with a counterweight proposed in this study consists of a buoy, counterweight, pair of cylindrical pulleys with a one-way clutch, multiplying gear, and flywheel, as shown in Fig. 1. The buoy has vertical translational motion on the wave surface, and especially plays a role in generating torque at the cylindrical pulley by its weight when the buoy descends along the wave. The counterweight, which is connected to the buoy by a wire, generates torque when the buoy rises along the wave. By increasing or decreasing the counterweight, the response rate of the buoy can be controlled in relation to the incident wave period. In other words, by controlling the optimal condition between the buoy and counterweight in relation to each wave period, its efficiency can be improved. The pair of cylindrical pulleys has built-in one-way clutches with opposite working directions. Thus, this system is designed to convert the vertical translational motion into rotational energy in a constant direction, as well as to convey the torque generated by the buoy and counterweight. The multiplying gears amplify the RPM of the axis connected to the flywheel. The flywheel has a function to temporarily save the rotational energy. Therefore, it can help to steady the fluctuating RPM and maintain a high RPM in the range of a low torque.
The system can increase the primary energy conversion efficiency by transmitting the torques generated in opposite directions by the buoy and counterweight in a constant direction. However, when it comes to maintenance, using the one-way clutch may increase the repair cost because a one-way clutch is considered to be a delicate piece of equipment.
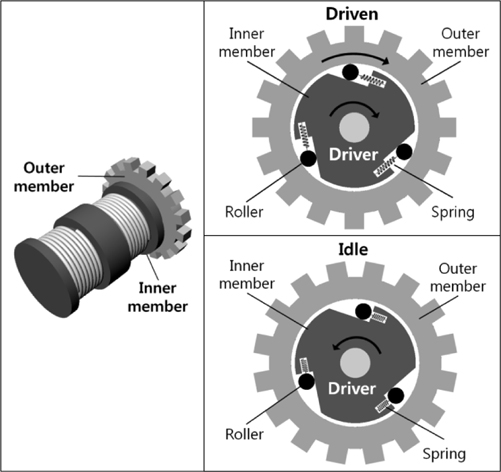
Figure 2 illustrates a simplified one-way clutch. As the inner member delivers torque to the outer member, the rollers are wedged into the tapered recesses. This is what provides a positive drive. If the outer member rotates in a positive direction or the inner member rotates in the opposite direction, the rollers become free and no torque is transmitted.
As shown in Fig. 3, when the buoy meets a wave crest and rises, the wire connected to the buoy cannot convey a compressive force to the pulleys because the wire is not a rigid body. At the same time, the wire connected to the counterweight generates a torque by the tensile force as a result of the counterweight. It is noteworthy that the torque is only transmitted to the driven outer member on which the rollers are wedged into the tapered recesses, and the outer member on which the rollers freely idle.
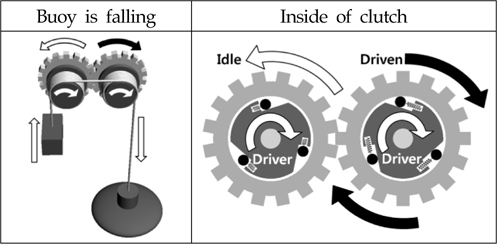
In contrast, when the buoy falls as shown in Fig. 4, the inner member rotates in the opposite direction to the case shown in Fig. 3, and the driven outer member is also the opposite gear. As the idling outer member meshes with the driven outer member to which the torque has been transmitted, it plays a role in transmitting the torque to the final rotation axis. The final driven direction is identical to that of the case when the buoy rises. Thus, a constant rotation direction is maintained for the final axis regardless of the direction of the input torque.
The biggest advantage of this system is that it can maintain a constant rotation direction for the final axis, while simultaneously absorbing the torque in the opposite direction.
3. Experimental Method and Model
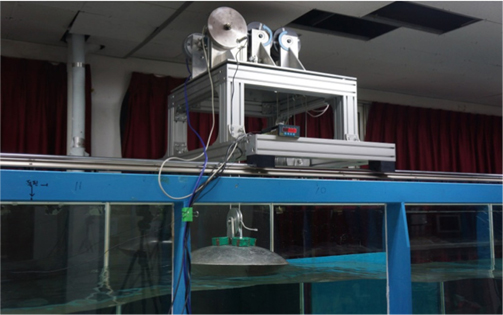
An experiment was performed at the two-dimensional ocean engineering basin (25 m (
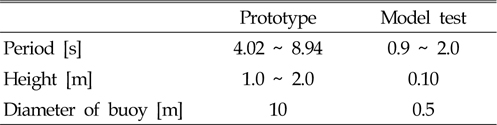
The conditions of the incident regular waves were selected as summarized in Table 1 considering the annual wave observation data for the Coast of Jeju Island (Korea Ocean Observing and Forecasting System, 2011; Hong et al, 2004) and the generally occurring wave height and period of the sea area.
[Table 1] Conditions for model test (λ=20)
Conditions for model test (λ=20)
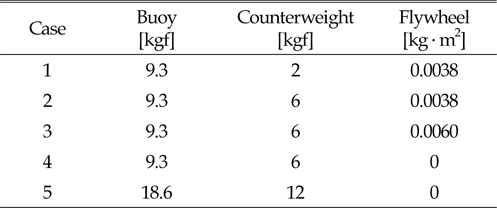
To examine the effects of the weights of the buoy, counterweight, and flywheel on the efficiency of the primary energy conversion, experimental conditions were established as summarized in Table 2. The diameter of the flywheels used in the experiment was 20 cm, and they had thicknesses of 3 cm and 5 cm. Their moment of inertia values were 0.0038 kg·m2 and 0.0060 kg·m2. The sizes and dimensionsof the buoy and counterweight were not changed, and the gear ratio was equal to 1:3.64 for all conditions.
[Table 2] Characteristics of WEC condition for model test
Characteristics of WEC condition for model test
For the converter system examined in this study, the buoy had a diameter of 0.5 m, and it was a geometrically similar model, with a scale ratio of 1:20. This was because “Wave Star” of the Wave Star Energy Company of Denmark is similar to the WEC system proposed in this study in that a buoy with a hemispherical shape was used. Therefore, considering that the diameter of the buoy of the prototype Wave Star is about 10 m, the scale ratio selected for the experimental model in this study was 1:20.
3.3 Experimental equipment and method
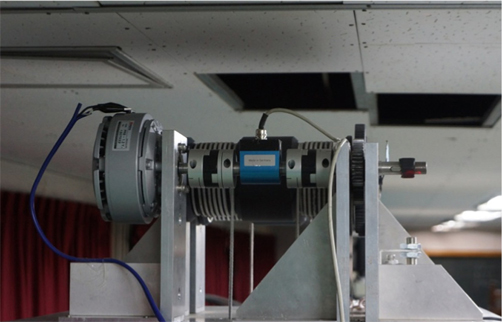
In the energy transmission processes of the WEC system with a counterweight, the incident wave energy is primarily converted into the torque of the cylindrical pulley by the buoy and counterweight, and the kinetic energy, which has been converted into the torque, is secondarily converted into electric energy through a power generation turbine.
In this study, among the energy conversion processes, only the efficiency of the primary energy conversion was evaluated. To accomplish this, a power take-off (PTO) system was installed as shown in Fig. 6. Because a secondary conversion process was excluded in this experiment, the PTO system was established so that resistance could be applied to the rotating axis instead of the real electrical load of a generator. This resistance was applied in the opposite direction of the rotating axis, which produced the torsion of the axis. A non-contact torque sensor, which could measure the torque generated by the deformation due to torsion, was installed on the axis.
3.4 Data measurement and processing methods
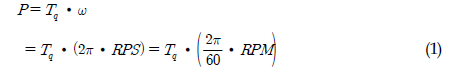
The following method was used for calculating the power with the torque and RPM:
where
With a certain amount of wave energy applied to the WEC system, the measured torque, RPM, and calculated power depended on the strength of the load torque. Thus, repeated experiments were performed by controlling the voltage of the PTO system, which could increase or decrease the load torque.
In this study, the efficiency of the primary energy conversion was evaluated based on the capture width ratio (CWR). The CWR can be expressed as the ratio of the incident wave energy absorbed by the buoy to the energy of the rotating axis. The equations for the CWR and incident wave energy are as follows:


where
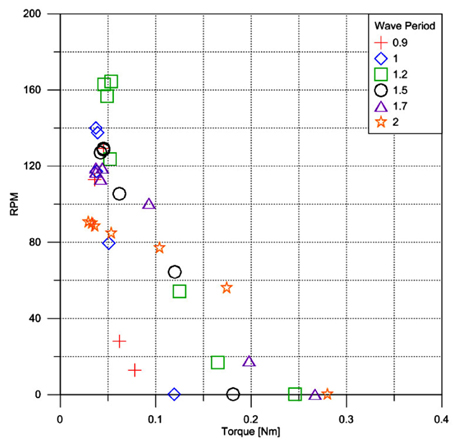
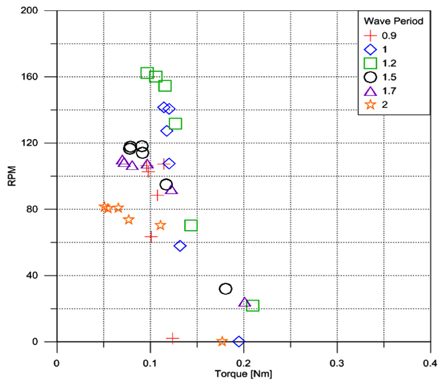
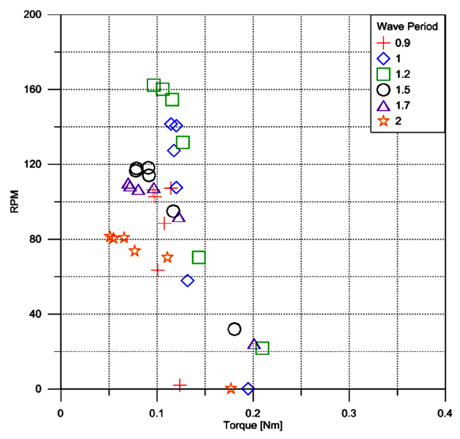
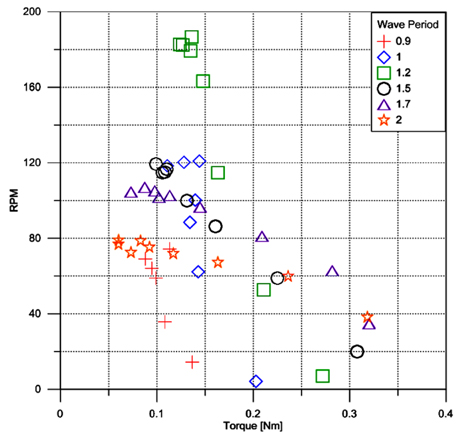
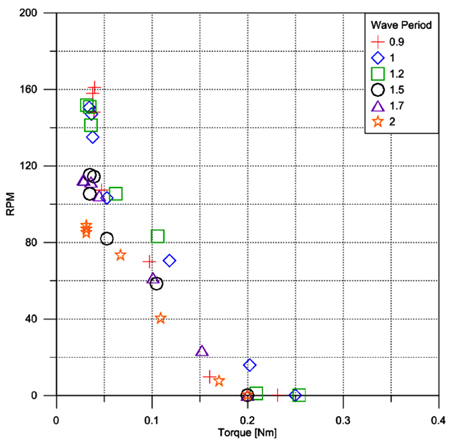
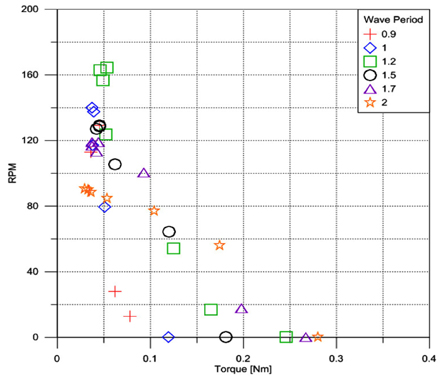
Figures 7 and 8 show the results of the RPM measured by changing the incident wave period and load torque acting on the rotating axis, in relation to the change in the weight of the counterweight. As the load torque increased, the RPM gradually decreased because the resistance of the rotating axis increased.
In the results shown in Fig. 8, the counterweight was 6 kgf, unlike that shown in Fig. 7. The maximum RPM and torque decreased under periods of 0.9 and 1.0 s, but increased under 1.7 and 2.0 s. This was because if the counterweight was relatively light, the buoy could promptly respond along the free surface of the waves, and thus a high RPM could be maintained even at a short period with a 2 kgf counterweight. In contrast, in the results shown in Fig. 8, when the wave period is greater than 1.5 s, the 6 kgf counterweight is advantageous compared to Fig. 7.
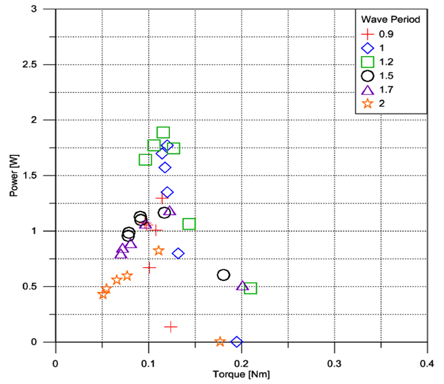
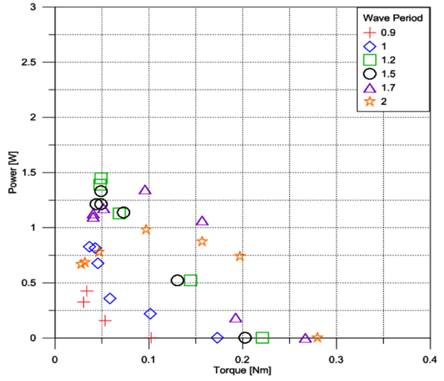
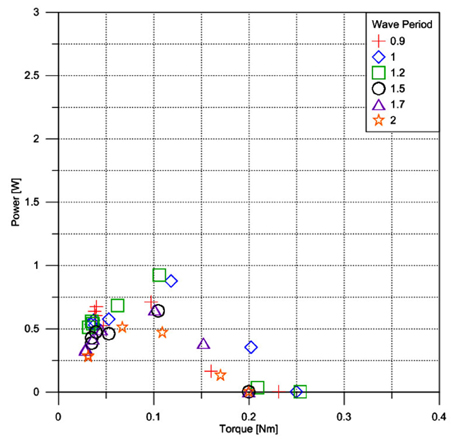
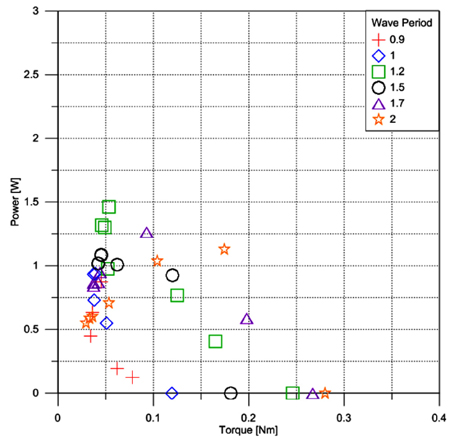
In terms of the torque, there existed an optimal torque for each wave period that output the maximum power. When the counterweight was 2 kgf in Fig. 9, the optimal torque points were not significantly different depending on the period; but when the counterweight was heavy as in Fig. 10, they significantly increased for long periods, and the maximum power was observed in a broad torque region.
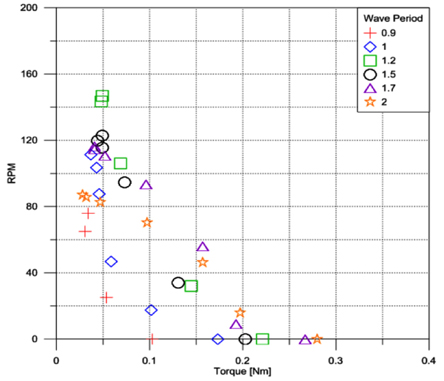
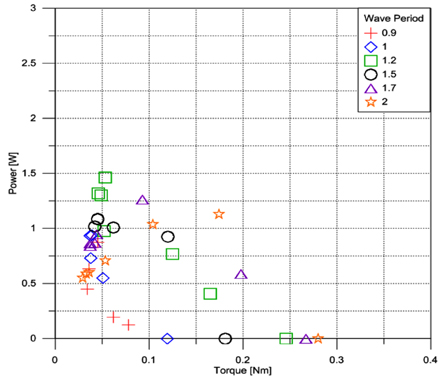
Figures 11, 12, and 13 show the trends of the RPM in relation to the wave period and torque, for each weight of the flywheel; and Figs. 14, 15, and 16 show the trends of the power.
The RPM values of Figs. 12 and 13 show similar patterns, and their peak points are approximately concentrated in a range of 0.05 Nm of torque. However, the peak points of Fig. 11 are distributed in a range of about 0.1 Nm of torque. It was thought that the flywheel could help to steady a fluctuating RPM and maintain a high RPM in the range of low torque because a flywheel has the function of temporarily saving rotational energy.
Without the flywheel, as shown in Fig. 14, each optimal torque in the overall wave period was about 0.1 Nm. In the case of the 0.0038 kg·m2 flywheel (Fig. 15), the maximum power and optimal torque at 0.9~1.2 s decreased, whereas at 2.0 s, in addition to the maximum power and optimal torque, the maximum torque also significantly increased.
However, when the flywheel was 0.0060 kg·m2 (Fig. 16), the power decreased in the overall period compared with the 0.0038 kg·m2 flywheel. Thus, it was thought that selecting the most appropriate weight for the flywheel according to the weights of the buoy and counterweight was advantageous in terms of the efficiency.
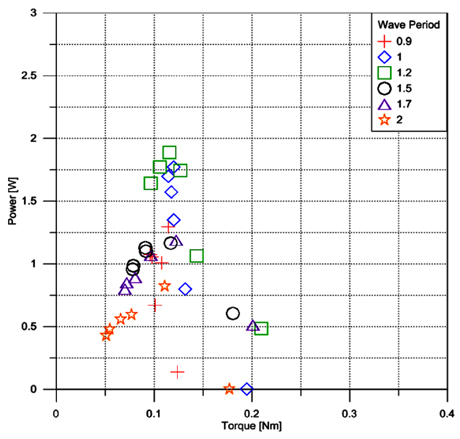
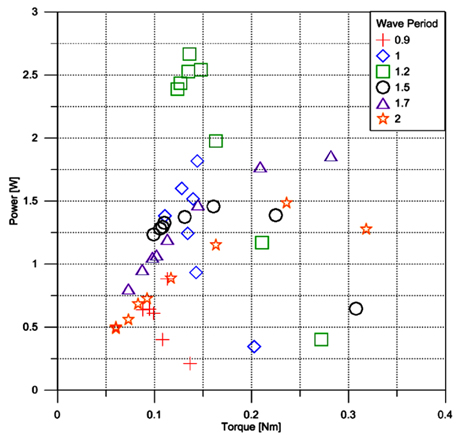
4.3 Effects of buoy weight and counterweight
Figures 17 and 18 show the trends of the RPM in relation to the wave period and torque, for each weight of the buoy and counterweight; Figs. 19 and 20 show the trends of the power.
In Fig. 18, by increasing the weight of the buoy and counterweight by a factor of two, the maximum torque increases under the overall conditions of the wave periods. The maximum RPM increases at 1.2 s, but decreases in the maximum RPM are observed at 0.9 and 1.0 s.
While increasing the weight of the buoy and counterweight leads to a decrease in the maximum power at 0.9 s, as shown in Fig. 19 and Fig. 20, it contributes to increases in the maximum power and optimal torque at 1.5~2.0 s, as well as the maximum power at 1.2 s. In other words, this indicates that optimal weights for the buoy and counterweight exist for each incident wave period.
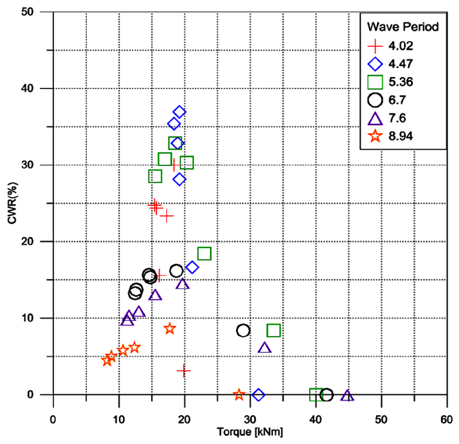
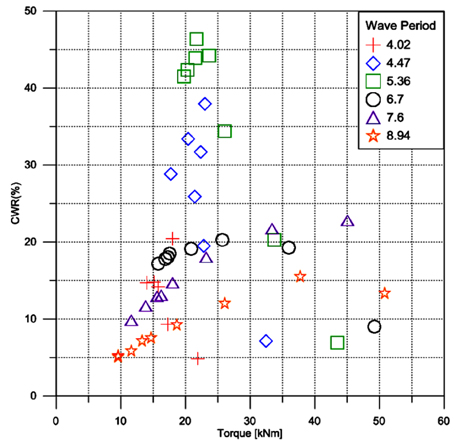
In this study, the performance of the primary energy conversion was evaluated based on the CWR, as shown in Eqs. (2) and (3). The trends for the power of the prototype in an actual sea area were inferred, as shown in Fig. 22, by applying the law of similarity to the results of the experiment. The CWR, which represents the ratio of the incident wave energy for the width of the buoy to the energy absorbed by the rotating axis, is presented as a percentage in Figs. 23 and 24.
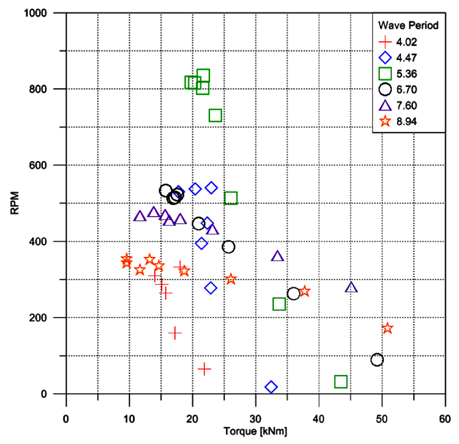
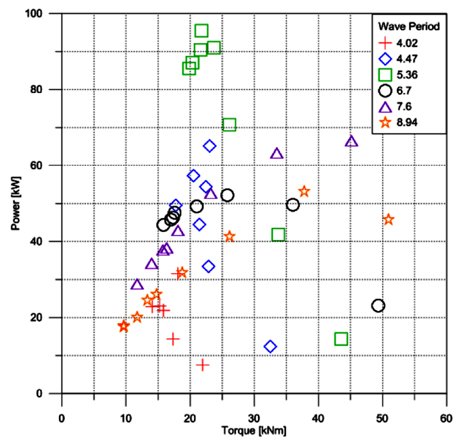
In Fig. 21, when the torque is about 21 kNm at the sectionwith a wave period of 5.36 s, the maximum power is about 95 kW, and the corresponding CWR is shown to be at a maximum when the torque is about 21 kNm in Fig. 24. This wave condition is consistent with the wave period region that mainly occurs in the sea area of Korea, which means that this WEC with the above condition would be useful for converting wave energy in Korea.
Figures 21 and 22 show the results for the optimal torque and RPM to obtain the maximum power, which could be basic information for controlling the appropriate generator condition.
Figures 23 and 24 show that heavier weights for the buoy and counterweight produce benefits for the CWR in the overall incident wave period, except in the case of 4.02 s. Thus, it is expected that if the buoy could be designed to have greater buoyancy and inertia force, the power and CWR performances would be significantly improved. Furthermore, if such converter systems were built in an array, like a farm-type facility along the coast, they could convert an enormous amount of wave energy.
In this study, to evaluate the energy conversion performance of a WEC system with a counterweight, an experiment was performed by establishing a PTO system. The torque and power were measured using the PTO system, and the primary energy conversion efficiency was calculated.
The performance and characteristics of the energy conversion efficiency were analyzed in relation to the weight of the buoy, counterweight, and flywheel by changing the incident wave period and the load torque.
In terms of the torque, for each period, there existed an optimal torque that output the maximum energy. Selecting an appropriate weight for the flywheel according to the weights of the buoy and counterweight was advantageous when it came to the efficiency.
The results of this study could be used as basic data for the optimal design and energy conversion efficiency improvement of a WEC system with a counterweight.