X-ray observations in space usually employ a Wolter- I configuration, with a paraboloid mirror and a hyperboloid mirror in the optical path [1, 2]. Manufacturing aspherical reflectors by the methods traditionally used for spherical lenses is time consuming and costly. Moreover, reflectors manufactured by polishing are too thick to achieve high throughput in the optical system. Different techniques for producing light mirrors at lower cost have been tested [3-5]. One is the epoxy replication process, which was used to develop the EXOSAT mirrors and x-ray mirrors for the Astro-E2 mission. Another is the Ni-electroforming technique that was adopted for XMM/Newton mirrors. These techniques are categorized as replication process, as they use the same process for replicating the figure of the mandrels.
The glass thermal slumping process has been developed to form x-ray segmented mirrors. Labov introduced this technique for forming a thin glass substrate with a concave stainless steel mold in 1988. Since then, with the development of manufacturing techniques, mirrors made by the thermal slumping process have played an important role in x-ray telescopes [6, 7]. Still, much work is needed to advance the glass thermal slumping process and improve the accuracy of a slumped reflector. The glass thermal slumping process is a high-volume method for manufacturing aspherical mirrors, in which a glass sheet is placed on a concave or convex mold. Both mold and glass are heated to the soaking temperature, at which the glass sheet deforms under its own weight and eventually conforms to and replicates the figure of the mold. After this process, the slumped glass is slowly cooled to set the shape of the reflector and minimize residual stress in the glass [8, 9]. Mirrors made by the thermal slumping process are thin and have a low manufacturing cost. They can be employed in many applications such as the Wolter-I telescope, segmented Kirkpatrick-Baez system, and large lobster-eye segmented modules.
Glass is a promising material to be slumped, as it is commercially available and has excellent surface micro-roughness and low density [10]. The volume density of glass is nearly one fourth that of electroformed nickel. During slumping the reflecting surface of the glass sheet touches a convex mold, so the final roughness of the reflecting surface will be affected by the mold. With a concave mold, however, there is no deterioration of the reflecting surface, since it does not make contact with the mold. Thus, we use a concave mold in our thermal slumping process.
In this research, the glass thermal slumping process to produce segmented parabolic reflectors was studied with numerical models and experiments. Simulations were performed using MSC Marc software, to predict the effects of heating rate and soaking temperature on the final surface figure of the slumped glass. Based on the simulation results, glass sheets were slumped on a concave parabolic mold in a furnace, and the upper surface of the formed glass was measured for comparison with the figure of mold.
II. MATERIAL PROPERTIES OF GLASS
Glass is a temperature-sensitive material. Its viscosity behavior affects the thermal slumping process and determines the various forming conditions, such as soaking temperature. Its viscosity changes nonlinearly with temperature. In the thermal slumping process, the mold and glass are heated to the soaking temperature, and then the temperature is held to allow the glass to fully deform.
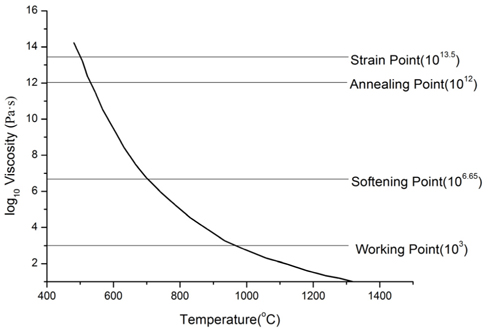
Figure 1 shows the viscosity curve for soda lime silica glass. As shown in the figure, there are four specific viscosity points, characterized as follows.
1. Working point: The viscosity is about 103 Pa·s. It is the typical temperature at which glass melt is to be compressed.
2. Softening point: The viscosity is about 106.65 Pa·s. It is the temperature at which deformation mainly occurs.
3. Annealing point: The viscosity is about 1012 Pa·s. It is the temperature where the internal stresses relax within a few minutes;
4. Strain point: The viscosity is about 1013.5 Pa·s. It is the temperature where the internal stresses relax in several hours.
The thermal slumping temperature, which is called soaking temperature, is always between the softening and working points.
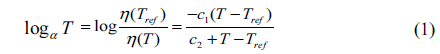
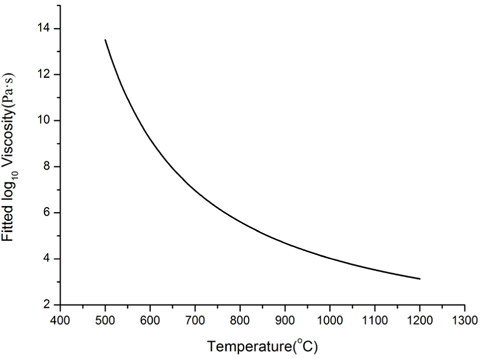
Several models have been presented to describe the temperature dependence of viscosity [11-13]. In this paper, the temperature dependence known as Thermal-Rheologically Simple behavior (TRS) was modeled by the Williams-Landel- Ferry (WLF) shift function in the MSC Marc software. The WLF model is presented as

where
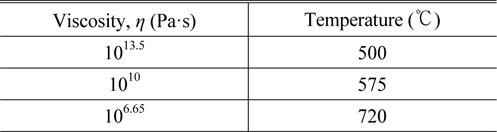
[TABLE 1.] Viscosity of soda lime silica glass at different temperatures

Viscosity of soda lime silica glass at different temperatures
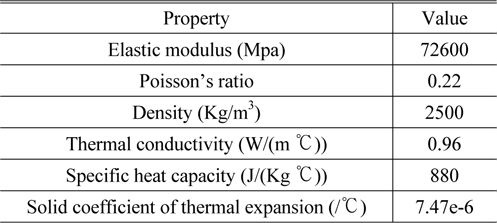
[TABLE 2.] Mechanical and thermal properties of soda lime silica glass

Mechanical and thermal properties of soda lime silica glass
III. NUMERICAL SIMULATION OF THE GLASS THERMAL SLUMPING PROCESS
Numerical simulation of the thermal slumping process was performed using the finite-element method (FEM). FEM is an effective tool for understanding and optimizing the nonlinear glass forming process. It is useful for evaluating parameters that affect the final contour profile of the slumped glass. In this paper, the MSC Marc software was employed to optimize the process. The effects of heating rate and soaking temperature were simulated.
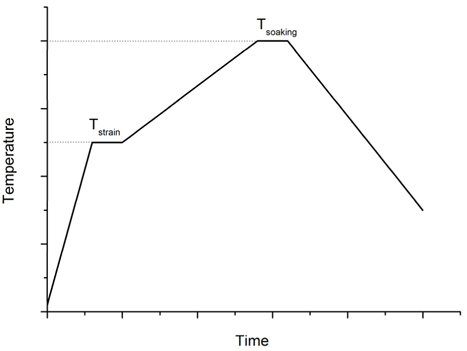
The thermal slumping process can be described as in Fig. 3, according to the following procedures:
1. The mold and glass sheet were heated to the Strain temperature and held for a moment, to allow the glass sheet and mold to reach thermal equilibrium.
2. The temperature was increased to the soaking temperature. The glass mainly deformed at this stage, and replicated the shape of the mold.
3. The mold and glass were slowly cooled down to room temperature.
In this research, the strain temperature was about 500℃.
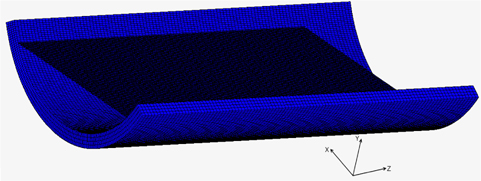
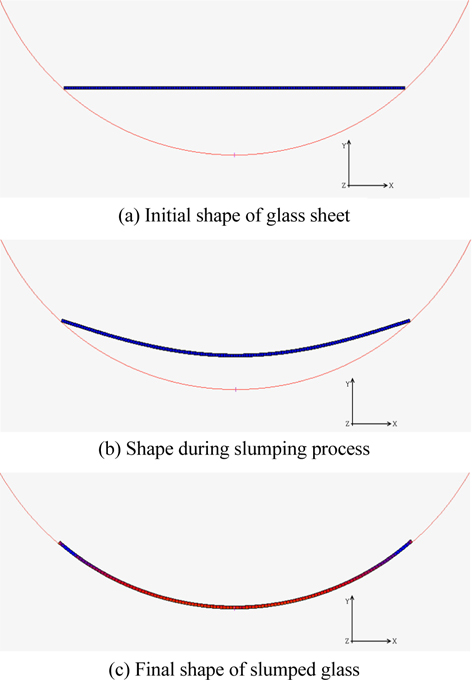
Finite-element method (FEM) simulation of the thermal slumping process was performed using MSC Marc to study the effects of heating rate and soaking temperature [14, 15]. A model of a thin glass sheet on a concave parabolic mold is shown in Fig. 4. To simplify the simulation, two-dimensional plain-strain analysis of the glass and rigid mold was employed to simulate the thermal slumping. A glass sheet 0.5 mm thick was placed on a concave mold about 88 mm in diameter. The mold was constructed as a rigid curve, and the glass sheet was meshed with eight-node isoparametric quadrilateral elements. The deformation process of a glass sheet during thermal slumping is shown in Fig. 5.
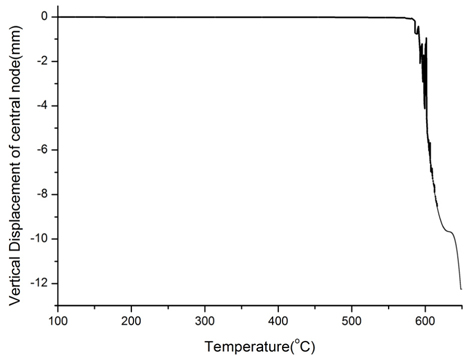
First, to study the temperature dependence of the glass slumping process, a uniform temperature change was applied to the mold and glass sheet. The vertical displacement of the central node of the glass sheet is shown in Fig. 6. Slumping of the glass sheet mainly occurred when the temperature rose above 560℃, which was approximately the transition temperature of the glass. Thus, to save time in the heating procedure, the temperature could be raised to 500℃ quickly.
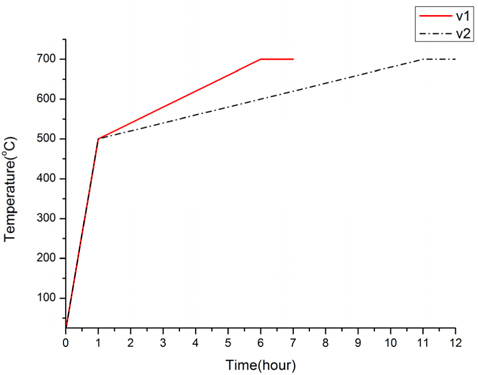
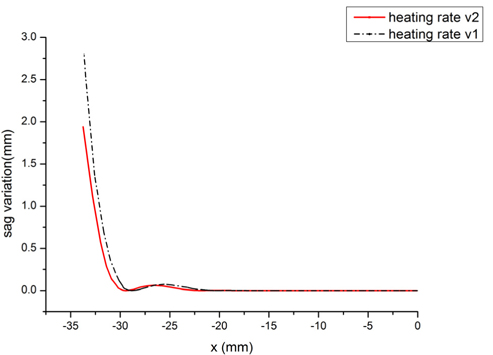
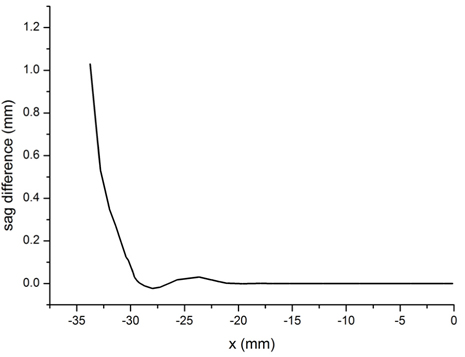
To study the effects of heating rate on the final shape of the slumped glass, two heating rates were assumed in the simulation, as shown in Fig. 7. For the two heating procedures, the temperature was raised to 500℃ quickly, and then raised to about 700℃ at different rates, and the slumping process was performed using the two heating rates. After the heating process, the glass sheet was not fully settled on the mold; there was a gap between the glass sheet and the mold. Thus the sag variation between points on the glass sheet and the mold was used to describe the slumped shape. The structure was axisymmetric, so results for only the left half are shown in Fig. 8. The sag variations for the two heating rates were compared. Obviously, the faster the heating rate, the larger was the sag variation. The variation was large at the edge of the glass sheet, indicating that the formed glass should be trimmed at the edges, to eliminate edge malformations. The differences in sag variation between the two heating rates are shown in Fig. 9.
3.3. Effects of Soaking Temperature
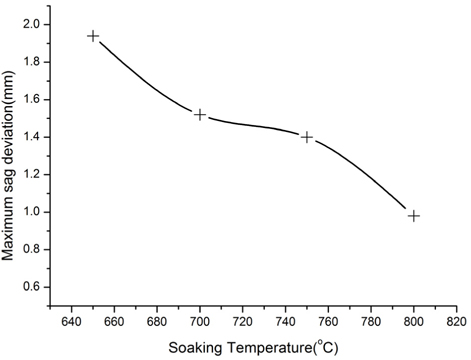
According to the simulation above, the heating rate can affect the final shape of the slumped glass. As the viscosity of glass depends strongly on temperature, it is necessary to simulate the effects of varying soaking temperature. Generally, the higher the soaking temperature is, the better the shape of the glass sheet conforms to the mold. Soaking temperatures 650℃, 700℃, 750℃, and 800℃ were applied in the simulations. The glass sheet and mold were heated to 500℃ quickly, then heated to the soaking temperature with the same heating rate. After the slumping process, the maximum sag variation was compared. As illustrated in Fig. 10, the maximum sag deviation decreased with increasing soaking temperature. According to the viscosity of glass versus temperature curve shown in Fig. 1, a glass sheet may deteriorate at a soaking temperature above 800℃, since the glass is more like a liquid at high temperatures.
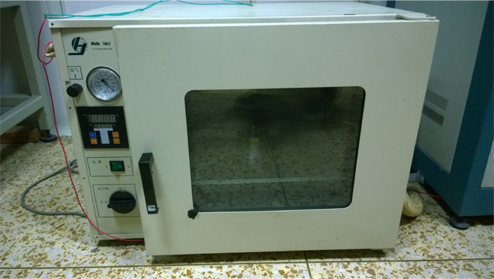
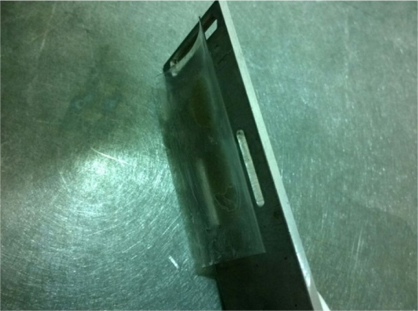
The numerical analysis above has optimized the heating process for glass thermal slumping. Based on the simulations, glass samples were formed in a concave parabolic mold in a furnace. The mold was made of steel, which has a low coefficient of thermal expansion, and was cut to the desired parabolic shape with commercial tools. The parabolic parameter
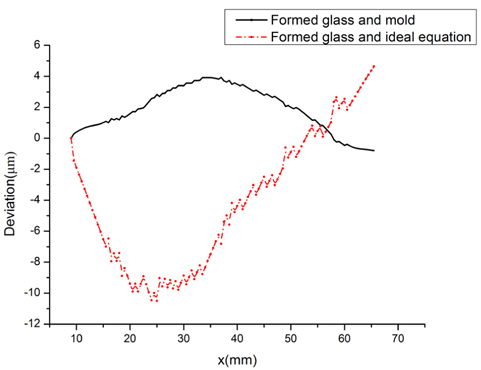
The surface profiles of the mold and formed glass were measured and compared, to evaluate whether the glass workpiece was fully slumped. Surface deviation of the central generatrix along the axial direction was calculated, including the deviation between the formed glass and the ideal equation, and the deviation between the formed glass and the mold. The results are presented in Fig. 13.
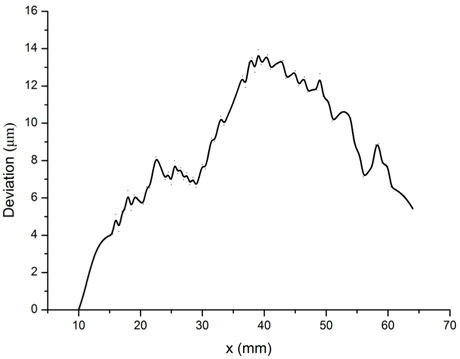
The root-mean-square (RMS) deviation and peak-valley (PV) deviation between formed glass and mold were 2.3 and 4.7 μm respectively, while the RMS and PV deviations between formed glass and the ideal equation were 6.1 and 15.15 μm respectively. As a contrast, the glass forming process was also carried out with a different heating rate: The furnace was heated up to 800℃ in 5 hours. The surface deviation between formed glass and mold for this case is shown in Fig. 14. The RMS and PV deviations were 9.1 and 13.9 μm, respectively. Apparently, deviation between the formed glass and mold was larger with faster heating rate, which agrees with the simulation results.
According to the comparison in Fig. 13, the simulation by MSC Marc provided good guidance for the thermal slumping process, and the mold shape was replicated by the formed glass quite well. The large deviation between formed glass and the ideal equation was mainly caused by the mold, which was not exactly the desired shape, due to inaccuracy in machining.
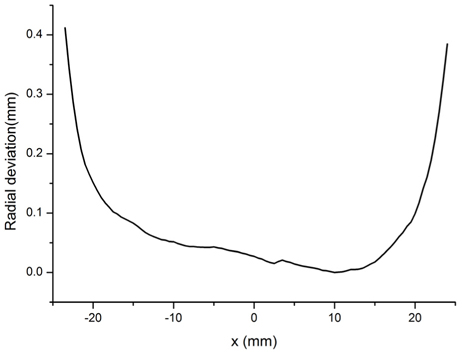
Beyond that, the radial deviation of the formed glass and mold at the entrance aperture was figured. Based on the radial deviation in Fig. 15, the formed glass matched the shape of the mold well in the central range, while it did not contact the mold at the edges, where the deviation was about ten times of that in the central range. The measured results matched the numerical predictions well. To achieve better radial variation and imaging quality, the formed glass should be trimmed at the edges.
In this paper, FEM simulations and experiments were performed to study and analyze the heating parameters for glass thermal slumping in a concave mold. The physical properties and mechanisms were applied to a model constructed in MSC Marc, and the WLF model was utilized to fit the glass viscosity. Simulations performed for different heating rates resulted in different sag variation between glass and mold; higher heating rate caused larger sag variation. Therefore, to save time in manufacturing, the furnace should be heated to about 500℃ quickly, but then to the soaking temperature slowly. According to the simulation, the maximum sag variation decreased with higher soaking temperature. Considering the temperature-dependent viscosity of glass, the optimal soaking temperature was about 800℃.
Based on the optimized experimental conditions, glass samples of thickness 0.5 mm were formed in a furnace with a concave parabolic mold made of steel. Slumped glass was produced and tested. Comparison between surface profiles of the formed glass, theoretical data, and mold suggested that the quality of the slumped glass can be significantly improved by optimizing the shape of the mold. The RMS and PV sag deviations between formed glass and mold were 2.3 and 4.7 μm respectively, along the axial direction.
On the other hand, with a soaking temperature of 800℃ the formed glass was still not fully slumped at the edges, according to the radial deviation seen in experimental results, which meant that the glass was not making full contact with the mold. The experimental results agreed with the numerical predictions. Therefore, trimming the edges is necessary to achieve a better surface profile. Based on the simulated and measured results, improvements can be made in future research, and new mold materials or manufacturing processes should be adopted to improve the shape accuracy of the mold.