As pH is a widely used index in chemical, medical, and environmental applications, research on pH sensors has been active in recent years. This study obtained RGB values by measuring the reflected light from a liquid sample to detect fine changes in pH, and performed mathematical modeling to investigate the relationship between the detected optical signal and pH value. Also, the trends in pH changes were easily identified by analyzing RGB values and displaying them in the color coordinate for easy visualization of data. This method implemented a user-friendly system that can measure and analyze in real time. This system can be used in many fields such as genetic engineering, environmental engineering, and clinical engineering, because it not only can measure pH but also replaces a colorimeter or turbidimeter.
As an important indicator of a material’s characteristics, pH is a measure widely used in various fields such as engineering, chemical industry, and medicine [1-4]. pH measures the acidity or basicity of a solution, defined as the decimal logarithm of the reciprocal of the hydrogen ion activity. In particular, the value of a neutral intermediate aqueous solution is pH 7 at the reference temperature of 25℃; solutions with a pH value below 7.0 are considered acidic, and those with a pH value above 7.0 are basic [5, 6]. An acid-base indicator, which shows the acid-base characteristics as a color, is a substance indicating the properties of a solution by changing its color depending on the acidity of the solution.
So far, several types of pH sensor have been developed, ranging from pH strips with low precision to precise pH meters using glass electrodes [7-12]. A pH meter is a device for measuring the hydrogen-ion concentration accurately, but the electrodes of a pH meter have the disadvantage of being broken easily by slight shock. Another testing method is pH test paper, made by impregnating filter paper with an indicator. If pH test paper is soaked in a solution, the solution reacts with the indicator on the paper and the color changes, depending on the hydrogen-ion concentration of the solution. The pH value of the solution can be found by observing the color change and comparing the resulting color with a standard discoloration table. This method has the advantages of being able to test pH simply and quickly, but the error range is about 0.2~0.5 pH, for poor accuracy. Also, it is more reliable to observe the color change of pH test paper immediately after soaking and then taking it out to be stored in a dark place [13]. Another measurement method using isosbestic points is good in terms of reduced error and measuring the same values as with a traditional pH meter, but there are many disadvantages: a constant path length through the liquid should be maintained at the absorption wavelength, ordinary persons have trouble calculating the absorbance, expensive equipment including spectrometer and quartz cuvettes should be used to measure the absorbance, and the pH of the solution should be maintained at constant ionic strength [14].
The disadvantages of these several methods are difficulty in storing and maintaining certain conditions, and inconvenience in usage. This study proposes pH measurement using an optical method to address these disadvantages, one that is easy and simple, not time-limited, and capable of a precision of 0.1 pH units. The experiment used a small color sensor to analyze color information of an indicator depending on pH, by measuring the output signal from the sample, analyzing the data, and comparing the result using the international standard method called CIE 1931 (Commission Internationale de I’Eclairage). A color-filter-based pH sensor has the advantages of small size and simple configuration. pH measurement using the optical method presented in this study is an effective method of digitizing pH accurately with color changes, by adding a specific indicator to a solution with an unknown sample. The pH value can be measured with an array-type color sensor and the detected RGB signals.
This is the study of a system that can measure information about pH in an objective and quantifiable way by using an optical method. Changes in pH depending on color changes can be detected by separating each RGB value with a color filter attached to the top of a photodiode.
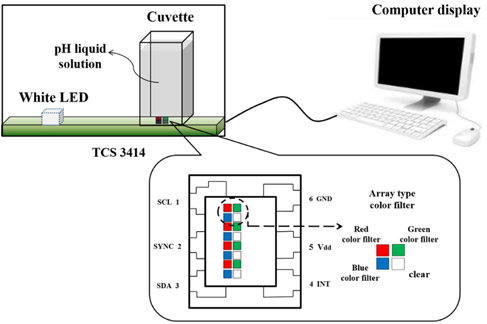
Figure 1 shows a schematic diagram of the experiment. The experiment used the method of presenting a reference beam by using a white LED and allowing the light source to irradiate the sample, then to be reflected on a color sensor composed of array-type photodiodes for detecting RGB values. The light emitted from the white LED passes through the sample and impinges on the color sensor by absorption and scattering phenomena, depending on the optical properties of the sample. Data are obtained by converting each color of light incident upon the array sensor from analog to digital signal, and displayed on a computer in real time. pH values depending on changes in color information are predicted by detecting information about the color change in the output signals.
The sensor used in the experiment is the TCS 3414 digital color light sensor (TAOS, USA), which was designed to provide color information. In this sensor the color filters for red, green, and blue are arranged in an array to collect signals from the sample.
Table 1 lists the indicators used in the experiment. Three representative indicators respectively having color-change range in acidity, neutrality, and basicity were used. Changes in color information were observed using the indicators methyl orange (having an acidic color-change interval), bromthymol blue (interval near neutrality), and phenolphthalein (basic interval). To measure changes in color information of a solution with a particular pH, this experiment is to propose a method that can measure pH by observing the light signals altered by the color change of the sample, using the property that light incident on the solution is absorbed and scattered differently, depending on its color and the concentration of the solution. This measurement system is non-contact and has the advantage of detecting pH information as well as coordinates in color space.
[TABLE 1.] Indicators used in the experiment
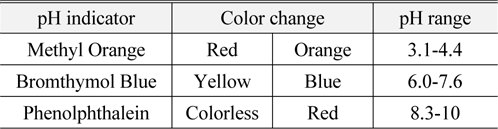
Indicators used in the experiment
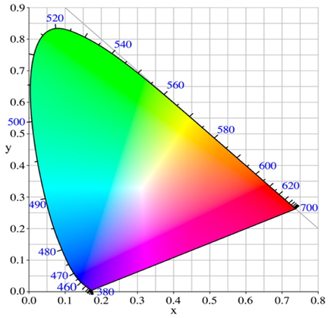
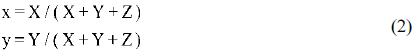
Figure 2 shows the CIE 1931 color space, the standard colorimetric system established by the Commission Internationale de l’Eclairage (CIE) in 1931, generally called the XYZ colorimetric system. The standard chromaticity diagram created by this scheme is called the CIE 1931 (x, y) chromaticity diagram. CIE 1931 is primarily used for the purposes of scientific technology and is useful for mixing dye, paint, and varnish colors. CIE 1931 transforms RGB data into a color space called XYZ, in which Y values express illuminance (brightness). Therefore, the chromaticity of any color can be expressed by two values,
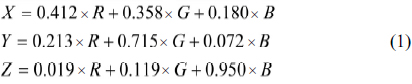

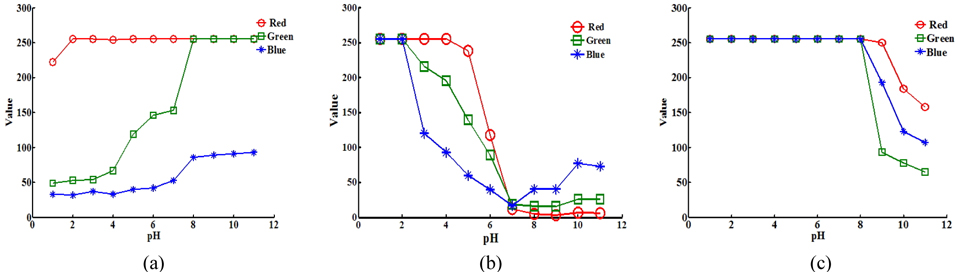
Figure 3 shows each R, G, and B signal measured by the sensor for different indicators. Changes in RGB values could be identified for the color-change range of each indicator, in the acidic, neutral, and basic regimes. Methyl orange has a color-change of pH 2-8, bromthymol blue has a range near neutrality of pH 3-7, and phenolphthalein has a range of pH 8-11. The values of G in particular tend to increase or decrease clearly over most of each range.
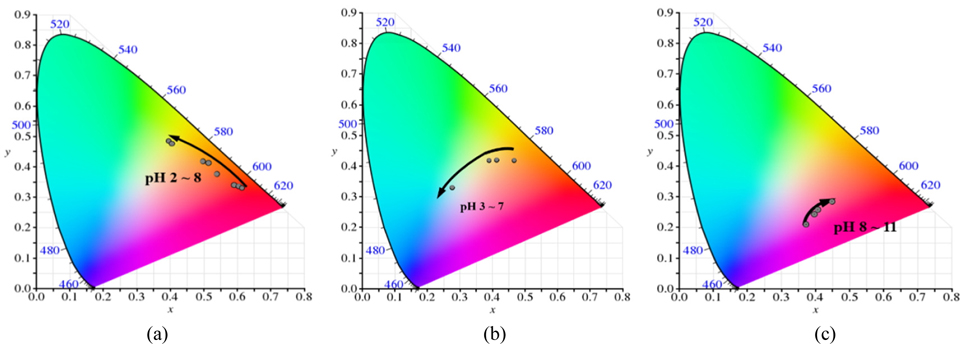
In Fig. 4 each R, G, and B measured by the sensor was substituted into Eqs. (1) and (2), and the coordinates were marked and schematized. Looking at the data, it can be observed that the color coordinates are shifting according to changes in each indicator. This figure is displayed for easy understanding through imaging by marking changes in the values of the color coordinates with pH, which is different from the traditional method of memorizing information of various colors depending on the color change for a specific indicator. The changes of pH can be displayed visually with a CIE diagram as well as the numerical pH values with RGB data. This has the advantages of being able to understand the information intuitively and to access to it in a user-friendly way. Therefore, data will be able to be easily understood, and trends to be identified easily. Using the actual color coordinates, it can be observed that the coordinate of methyl orange moves in the direction from red to orange, that of bromthymol blue moves from yellow to blue, and that of phenolphthalein moves to red gradually, as shown in Fig. 4.
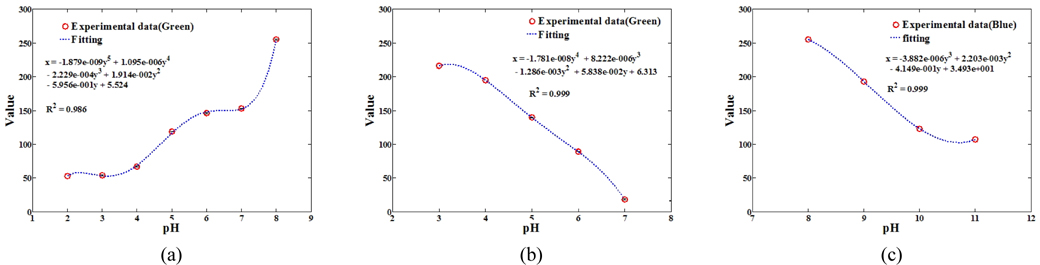
Figure 5 shows the results of inversely transforming the data obtained from the output signals. Inverse transformation was carried out using green data for the color changes of the three indicators. The green values tended to increase or decrease clearly over most of each pH range, compared to the changes in red or blue values. However, the resolution of the green data was not good enough at high pH, so blue data was used in the range of pH 8-11. Through this method, a regression equation with a similar tendency to the original data was obtained and the most appropriate formula was detected by comparing values of the coefficient of determination (R 2). It was appropriate to apply the inverse transformation method because each data set increases or decreases monotonically. The inverse transformation, a modeling technique used in this experiment, is the process of converting the relational equation
Based on color changes of pH indicators, this study proposes an optical pH-measuring technique that can detect color information with RGB data and CIE coordinates. In particular, it provided color information by discoloration according to an objective standard, to detect subtle changes in color and pH. In addition, changing values were obtained by using an optical-array sensor, and the coordinate movement in CIE space was identified. Also, the presented study has the advantage of being able to construct a much more affordable system than the currently used spectrometer, by using photodiode-based optical elements. This is different from the conventional methods based on determining colors with the naked eye, or expressing colors by colorimetry. If additional research based on the findings of this study were conducted, this system could be applied to various fields and could have the potential to replace even a colorimeter or turbidimeter, as well as providing a pH detection system. For example, it could be applied to genetic engineering in studying activity measurement and mechanisms of the enzyme of nucleic acid and protein, environmental engineering in quantitatively analyzing organic matter or heavy metals, and the pharmaceutical/clinical field in quantitative analysis of samples and the contents of drugs. This may be able to be developed as a system that can show the performance of a treatment in clinical medicine, and be used in experiments requiring an inexpensive method in laboratories and universities. In a future study, it will be possible to build a user-friendly system that can measure and analyze the color-based properties of material in real time.