The n -type Hf0.25Zr0.25Ti0.5NiSn0.998Sb0.002 Half-Heusler (HH) alloy composition was prepared by using the induction melting method in addition to the mechanical grinding, annealing, and spark plasma sintering processes. Analysis of X-ray diffraction (XRD) results indicated the formation of a pure phase HH structured compound. The electrical and thermal properties at temperatures ranging from room temperature to 718 K were investigated. The electrical conductivity increased with increasing temperatures and demonstrated nondegenerate semiconducting behavior, and a large reduction in the thermal conductivity to the value of 2.5 W/mK at room temperature was observed. With the power factor and thermal conductivity, the dimensionless figure of merit was increased with temperature and measured at 0.94 at 718 K for the compound synthesized by the induction melting process.
With their improved figure of merit and the recent developments in nanotechnology, thermoelectric materials have attracted more attention given their potential applications in electronic cooling, special power generation, waste heat recovery, etc. [1-3]. The conversion efficiency of a thermoelectric material is related to the dimensionless figure of merit, ZT= α2σT/κ, where α, σ, κ, and T are the Seebeck coefficient, electrical conductivity, total thermal conductivity and absolute temperature, respectively. Prior studies on thermoelectric materials have been published with ZT diversity values varying based on different operating temperatures, such as Bi2Te3 for low temperature [4-6], PbTe for mid-temperature [7-9], Skutterudites and HHs for mid-high temperature [10,11]. HH compounds are known to be relatively stable at high temperature despite their complex compositions. Based on the figure of merit for MNiSn (M = Hf, Zr, Ti) materials, Sakurada
A Half-Heusler composition of Hf0. 25Zr0.25Ti0.5NiSn0.998Sb0.002 was chosen for investigation. The raw materials used in this work include Hf powder (99.6%, Alfa Aesar), Zr foil (99.5%, Alfa Aesar), Ti powder (99.9%, Alfa Aesar), Ni powder (99.8%, Alfa Aesar) and Sn ingot (2mm dia. x 5mm long, 99.99%, RNP Korea), Sb (99.999%, High Purity Chemical) with shape of grains ca. 2 mm. All the elements were weighed in the correct proportion to synthesize a compound composed of Hf0. 25Zr0.25Ti0.5NiSn0.998Sb0.002. The raw materials were placed in a quartz tube, which was coated with a thin carbon layer to prevent reaction with the inner wall of the quartz tube at high temperatures and sealed under 2×10⁻² Torr. The mixture was melted using an RF induction furnace for 30 minutes to form the ingot. The ingots were then ground into powder by using a motorized mortar and pestle to ensure homogeneity before encapsulating the contents into a quartz tube once again with the vacuum inside. The encapsulated sample was annealed at 1173 K for 5 days to transform the materials into a pure phase. After annealing, the sample was ground again and sieved with a 35 μm-mesh sieve. The powder was then sintered by Spark Plasma Sintering (SPS) at 1,273 K for 1 hour under a pressure of 60 MPa using a graphite mold to form the cylinder shape ((
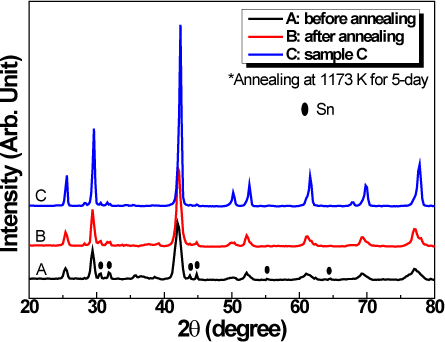
The x-ray diffraction patterns for the Hf0. 25Zr0.25Ti0.5NiSn0.998Sb0.002 powders before annealing, after annealing, and after SPS (sample C) are shown in Fig. 1. With powder sample before annealing formed the major phase with a Half-Heusler type structure, but a small amount of Sn was observed and disappeared after the annealing process, as shown in Fig. 1B. The HH single phase was observed more clearly with the sample following SPS, as shown in Fig. 1C. This validates the strong influence of annealing and the SPS processes on the forming of the single-phase structure of the Hf0. 25Zr0.25Ti0.5NiSn0.998Sb0.002 compound.
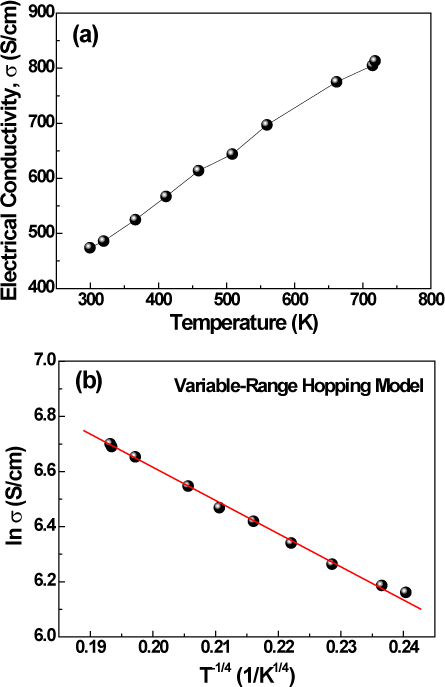
Figure 2 shows the variations in electrical conductivity as a function of temperature. As shown in Fig. 2(a), the electrical conductivity increases linearly when the temperature increases from room temperature (RT) to 718 K, indicating a nondegenerate semiconductor-like behavior with increase in carrier mobility with rising temperature. Considering the temperature dependence of the electrical conductivity within the variable-range hopping model [13], the electrical conductivity is given by σ=Aexp[−(T0/T)1/4], where A and T0 are constants. As shown in Fig. 2(b), the plot of ln σ vs. T−1/4 shows a clear linear behavior, indicating polaron hopping conduction. In addition, it is believed that Sb-doping into Sn sites in the Hf0. 25Zr0.25Ti0.5NiSn0.998Sb0.002 composition also increased the electrical conductivity due to introduction of a charge carrier [14].
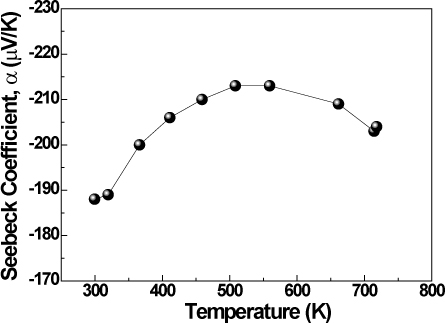
Figure 3 shows the temperature dependence of the Seebeck coefficent, α. The negative α value of the Hf0. 25Zr0.25Ti0.5NiSn0.998Sb0.002 compound indicates that it is an
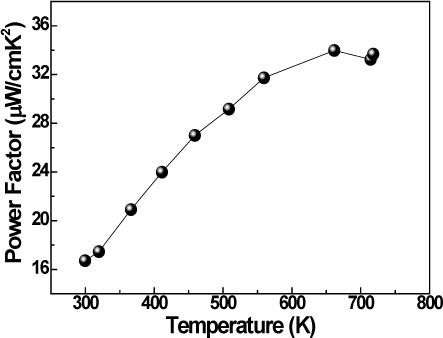
The power factor (PE), as calculated by the electrical conductivity and Seebeck coefficient under a given temperature range, PE = σα2 for the Hf0. 25Zr0.25Ti0.5NiSn0.998Sb0.002 compound, is shown in Fig. 4. The PE increased with increasing temperature, because both the electrical conductivity and Seebeck coefficient in creased by nondegenerate semiconducting behavior. As a result, we obtained the maximum PE value of 33.98 × 10⁻⁴ W/mK2 at about 700 K.
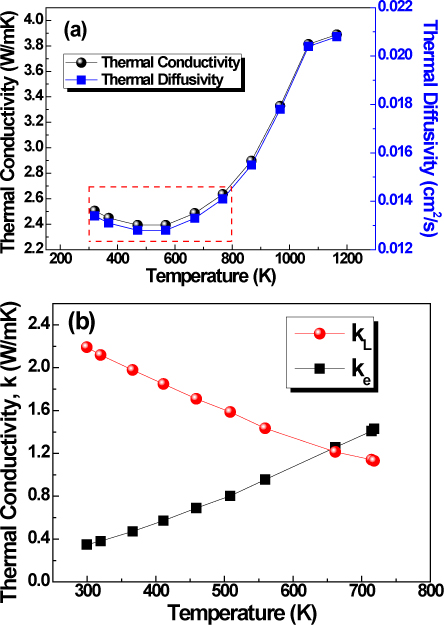
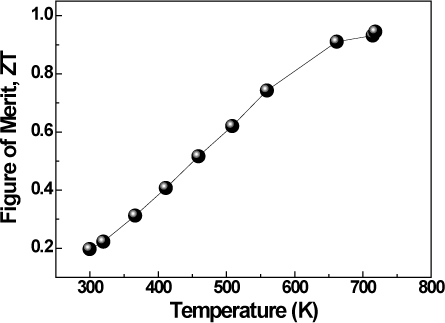
Thermal conductivity plays an important role that directly affects the figure of merit and, thereby, the energy conversion efficiency of thermoelectric materials. The thermal conductivity of a material is the sum of the two contributions: the electronic thermal conductivity (ke) and the lattice thermal conductivity (kL). Therefore, k=ke+kL. Both components can be separated by the Wiedermann-Franz law [15]: ke=(π2 /3)(kB/e)2 σT=LσT, where kB is Boltzmann’s constant, e is the quantity of electronic charge for one electron, and L is the Lorenz number (=2.45×10⁻⁸ WΩK−2). The thermal conductivity was calculated by multiplying the measured thermal diffusivity, density, and specific heat. Figure 5(a) shows the thermal conductivity depending on temperature in the range from RT to 1,118 K, which was calculated by using the thermal diffusivity data shown in Fig. 5(a). It can be seen that the thermal conductivity of the Hf0. 25Zr0.25Ti0.5NiSn0.998Sb0.002 compound was significantly reduced to a low value of 2.5 W/mK at RT. It is anticipated that the low thermal conductivity can be explained by mass fluctuation phonon scattering and/or strain field effects due to the substitution of (Hf,Zr) by Ti in crystal. The effect of the (Hf/Zr) substitution with Ti on thermal conductivity in the HH compounds has also been demonstrated in previous studies [12,14,16]. With increasing temperature, the total thermal conductivity increased above 500 K, as the electronic thermal conductivity increases dominantly (see Fig. 5(b)). The combination of low thermal conductivity and high power factor led to the maximum value of the dimensionless figure of merit, ZT = 0.94 at 718 K, as shown in Fig. 6. At high temperature, the downward Seebeck coefficient and the upward electronic thermal conductivity, which are related strongly to the majority carrier concentration, give rise to diminution of the uptrend in the figure of merit.
The