

I. Innovation in Indian Context: Conceptual Issues
Is there an Indian context of innovation? Or, in other words, is there country/economy/society specificity of innovation? The answer is affirmative within the concept of National Innovation System (NIS). But it is affirmative in a very restricted sense. The concept of NIS is based on arrangement of innovation, and the interactive role of various actors in the arrangements. It is to be noted that market does not have any overt role to play or very limited role to play in the conceptual framework of NIS. In a developed economy, where both product and factor markets are sufficiently developed, and financial market has a long history of spearheading economic development, market is ubiquitous in all economic activities and process of decision-making. A developing economy, on the contrary, would be understood in terms of weak market forces, and inadequate development of market. This has its implications also on dynamics of innovations. Market, being ubiquitous, is taken for granted in the developed economies, and therefore, does not show any overt presence in the discussion on innovation. It is market dynamics that make enterprises in the developed economies innovative; innovation as the survival guide for developing competitive advantage in a market economy environment. It is the demand aspect that leads to creation of NIS, and also makes it effective. The main issue, in the context of developed economies is, therefore, to build up an efficient innovation system that can fully utilise the demand side dynamics.
On the contrary, in developing economies role of market is conspicuous by its absence or inadequate presence. Innovations by enterprises in the developing economies are not responses to the market signals. Weak market forces also work as disincentive to innovation because realization of benefits to the enterprises remains uncertain. In such a condition if NIS is understood from the developed economy perspective, it is likely that we witness restricted effectiveness of NIS, which is again likely to become non-functional in the long run. The above understanding of innovation has far reaching implications on innovation studies. The basic difference is that the word ‘innovation’ would carry a meaning for the enterprises in the developed economies; but may not carry the same meaning for enterprises in the developing and less developed economies.
Developing economies or less developed economies characterized by little innovative activities have to be understood not in terms of percentage of innovative firms but by understanding the process of innovation and supports needed for activating the process. In the absence of innovation dynamics the question for developing economies is if innovation can be induced through any other arrangements or incentives. Experiences from Japan and Korea suggest a model where a determined state initiatives nurture selected sectors and associated science, technology and human resources for directed and targeted development through innovations. This was similar to wartime S&T and R&D policies of USA credited to Vannevar Bush, who, however, went on to propose altogether different and more liberal S&T policies for post-war peace period.
In cases of both Japan and Korea the onus of industrial innovations remained with the enterprises, which have been directed, facilitated and sometimes goaded by the state, essentially to complement the absence or inadequate presence of market forces.
In the context of developing economies understanding of innovations has to focus on the existing weak-links of networks between technology generation system (inside and outside the enterprise), technology user system, and the capacity of the economy to capitalize on the innovation. The government’s arms for promotion of innovation has to be extended far beyond the organized segment of the economy, and market forces have to be strengthened so that tiny and small enterprises in the remote and rural areas can capitalize new innovations from the market place.
As would be seen from the broad findings presented in the article, apart from standard issues like size, age etc.; innovations are mostly new to the firm. We interpret it as firms trying to survive by adopting market practices. Creating competitive advantage as the driving force of innovation is rare. We also see the disconnect between the production system and the innovation support system as that most of the firms depend on internal sources for whatever changes envisaged by the firm. We interpret it as the absence of demand side dynamics that makes the NIS non-functional.
The survey findings therefore indicate the need for context specific theory of NIS to complement the already well-founded general theory.
The article presents insights from the first ever National Innovation Survey in India. This was a firm level survey to identify the innovative firms, their nature, extent and types of innovation, innovation related activities and critical issues associated with innovations. The understanding, thus gained, has been positioned in terms of wider perspective of National Innovation System for examining its relative strength and weakness. The survey, therefore, laid focus on the firms as the centre of innovation as suggested in the literature on innovation (See Lundvall 1992, Nelson 1993, Malerba 2002 and 2004, Edquist 1997, OECD-Eurostat 1997 and 2005, Gault 2010). The survey has been conducted during 2011-12 for 26 States and 5 Union Territories (UT) as a part of the new initiative Science, Technology, Innovation and Creation of Knowledge (STICK) by the National Science and Technology Management Information System (NSTMIS), Department of Science and Technology (DST), Government of India. The results of the national innovation survey have provided quite a few indicative insights of the specific traits of innovation activities prevalent in the developing economies like India. In this article we present observations from the survey on certain simple questions (but complex in finding the answer) like identification of firms in terms of age and size of the innovative firms, types of innovation and the attributes, sectoral status of innovation, and also firms’ innovative behaviour and the sectoral characteristics of innovation and innovation strategies.
Most important methodological issue the survey had to deal with was regarding the ways of capturing innovations in the activities of a firm. Innovation by a firm is understood as planned changes in a firm’s activities with a view to improve the firm’s performance. To be considered as innovation, the minimum requirement is that it is new (or significantly improved) to the firm (OECD-Eurostat 2005). It is more than just R&D conducted by firms; it involves, among other things, minor improvements in existing technology, adaptations including adoption of technology, acquisition of external knowledge, non-technological change, such as new social and business models. Such changes in the production and associated activities of a firm are recorded only by the firms and mostly beyond the institutional arrangements for recording innovations through patents, copy rights etc. The first step to understand innovation was, therefore, to account for the changes introduced by a firm in its production activities and to examine the novelty of those changes in the next step.
The national innovation survey utilised this framework through a pre-designed questionnaire, pilot tested and developed by the NSTMIS, DST upon in-depth discussion with national and international experts and other stakeholders (see Arora 2011, DST 2011). The survey was conducted for a sample of 9,001 industrial units out of total population of 208,415 firms across 36 industrial sectors (35 remained in the sampling that excluded mining and quarrying sector, NIC 08) in the country through a stratified random sampling design. The Annual Survey of Industries (ASI) database has been used as the population base for the survey. Two-digit National Industrial Classification Code (NIC) has been used to represent the sectors for drawing the sample for the survey.
The survey focuses mainly on the small-scale industrial units in the manufacturing sector. Information was collected mainly through personal visits apart from websites, postal method and selected telephonic interviews. Firms in the sample were asked to provide information related to the period 2007-2008 to 2009-2010 related to types of innovations, about the innovators, and the sources of innovations. The industrial or production sectors represented by the two-digit codes are appended at the end. Any two-digit code not having or having negligible population (very small number of firms) was missed out in the sampling process. Total 35 sectors (out of 36, NIC 08 was left out) have returned innovative firms. Details of the methodology and sampling are available in the national report Annexure-II p.287-98 at the NSTMIS, DST website (http://nationalinnovationsurvey.nstmis-dst.org/).
III. Broad Findings from the Survey
We highlight some of the commonly discernible features of the innovation activities of the firm. Size and age of the firms are common attributes for characterising the innovative firms. These attributes are followed by types of innovations, innovation activities, sources of technology, and sources of fund for innovations, R&D and non-R&D firms for innovations along with technological and non-technological innovations undertaken by a firm. We also focus on innovative firms’ initiative for human resource development. We, however, begin with by defining innovation intensity and innovation potentiality to make the sectors and innovative firms comparable.
IV. Innovation Intensity and Innovation Potentiality
We have defined two indicators, namely, Innovation Intensity and Innovation Potentiality to make the innovation activities of the sectors comparable. Innovation Intensity is defined as a ratio between number of innovative firms in a sector and total number of firms in the respective sector.
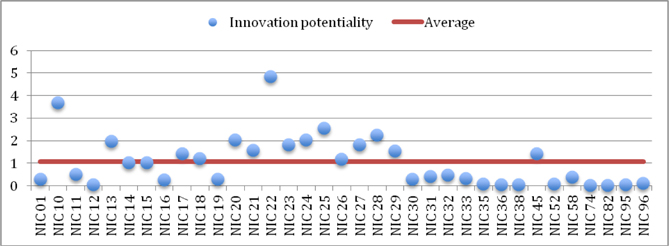
The survey has estimated overall innovation intensity for India as 35.37%. This is the ratio of number of innovative firms (3,184) to that total sample firms (9,001). However, to overcome bias due to disproportionate (skewed) representation of sectors, the innovation intensity measure has been normalised by deriving innovation potentiality as weighted innovation intensity, where weights are share of a sector in total innovative firms. Figure 1 shows comparative positions for sectors in terms of average innovation potentiality. It is to be noted that innovation potentiality is constructed independent of the ‘types of innovation’, which would have underlying assessment on quality of innovation.
V. Firms and Innovation: Sector Level Scenario
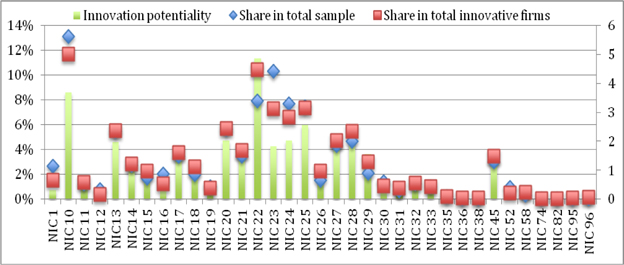
Figure 2 shows the share of different sectors in total innovative firms. Manufacturing of food products (NIC 10), which has the second highest innovation potentiality, has the highest share of sample as well as innovative firms. Rubber and plastic product sector (NIC 22) has the highest innovation potentiality. Tobacco (NIC 13), chemical and chemical products (NIC 20), non-metallic mineral products (NIC 23), basic metals (NIC 24), and fabricated metal products (NIC 25) have significant shares of total innovative firms.
VI. Size of the Innovative Firms
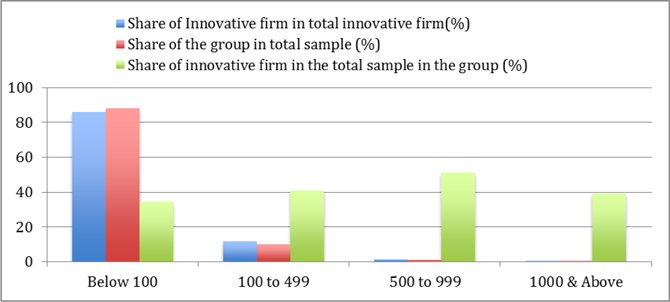
Firms with less than 100 workforces dominate the innovation scenario in most of the sectors. However, tobacco products (NIC12), wearing apparel (NIC 14), computer and electronics (NIC 26), transport equipment (NIC 30) and furniture (NIC 31) have significant presence of medium-size firms with 100 to 499 workforces.
Figure 3 gives a picture of the share of innovative firms of different size categories. It presents three ratios, namely, share of innovative firms in a size group in total innovative firms, share of a size group in total sample, and share of innovative firms in the total sample for the group. It is evident from the figure that the group with 500 to 999 workforces have higher share of innovative firms proportionate to the group’s share in the sample. Next to it is the group with 100 to 499 workforces closely followed by 1,000 and above workforce. Though the share of firms surveyed is more in below 100 category, their innovation activity appears to be lower than those with larger workforce base.
VII. Age of the Innovative Firms
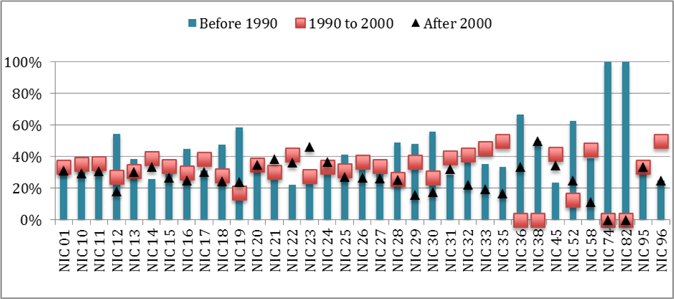
Figure 4 shows the age group composition of innovative firms in a sector. It may be seen that except a few, most of the sectors show more or less equal share of innovative firms of all the age groups. NIC 36 (Water treatment etc.) and NIC 38 (Waste treatment etc.) do not have any firms established during 1990 and 2000. Again NIC 74 (Scientific and design activities) and NIC 82 (Office administration equipment) have firms only from ‘before 1990’ group.
VIII.Types of Innovation in Sectors
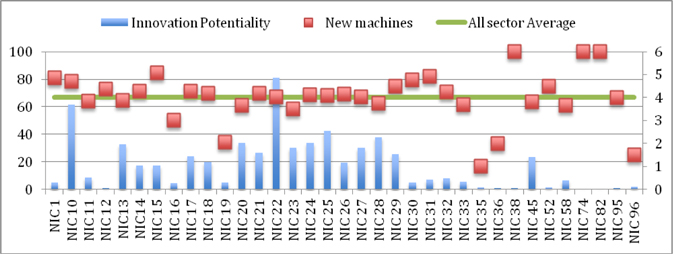
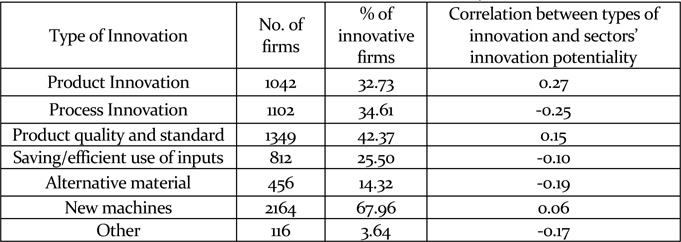
Innovation potentiality of firms has been captured by changes initiated by a firm in its production related activities. Broad groups of such activities are – product or/and process innovation, product quality and standard, saving/efficient use of inputs, use of alternative material, and introduction of new machines. A total of 3,184 firms have reported changes in the above-mentioned categories. Table 1 shows firms initiating changes in different activity groups. About 68% of firms inducted ‘new machines’ followed by 42% of firms focusing on ‘product quality and standard’. Product and process innovations are initiated by 33% and 35 % of firms, respectively. Do we expect that firms’ innovative activities (types of innovation) in a sector would be associated with the innovation potentiality of the sector? Table 1 also shows the correlation between innovation potentiality of the sectors and corresponding share of innovative firms in different types of innovations. The correlation does not show any relationship in this regard. It is to be noted that ‘innovation potentiality’ is constructed based only on the number of firms undertaking innovative activities (changes), and not the types of innovative activities. ‘No correlation’ suggests that there is no discernible pattern between higher number of innovative firms in a sector and the types of innovation related activities. For example ‘new machine’ is the most common innovation activity across the sector, and hence no correlation is expected with types of innovation (also see figure 5). The same is more or less true for other types of innovation activities. Not much significant sectoral variation of innovation activities also indicates weak sectoral system of innovation. Prevalence of ‘mew machine’ as most frequent mode of innovation indicates predominance of incremental innovation, as generally observed and expected in developing economies.
[Table 1] Types of innovation undertaken by firms
Types of innovation undertaken by firms
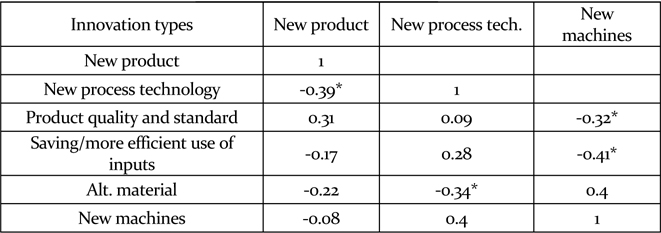
Another set of correlations has been calculated to check the complementarity if any among the types of innovations (Table 2). ‘New product’ innovations have comparatively higher negative coefficients with ‘process innovation’ but positive correlation with ‘product quality and standard’ (not significant, though). Does it suggest that ‘new product’ innovation has been largely independent of ‘new process’? Does it then imply that ‘New product’ in effect is the incremental changes (quality and standard) using the existing process technology? As expected ‘new process’ has high correlation with ‘new machine’ (though not significant). It also has significant and moderate negative correlation with ‘alternative material’. ‘New machines’ has strong positive correlation with ‘alternative material’ (not significant) but negative correlations with ‘product quality and standard’ and ‘saving/efficient use of inputs’.
[Table 2] Complementarities among types of innovations
Complementarities among types of innovations
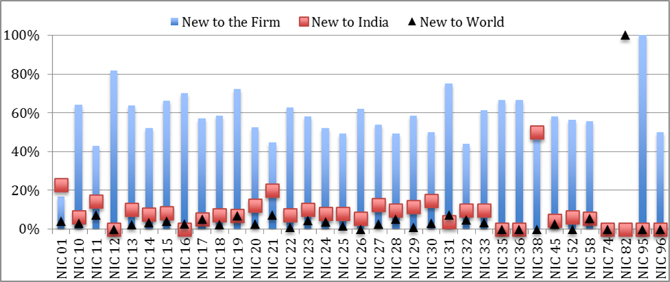
Across all the sectors general nature of innovation by firms is adoption of technology or ‘New to the firm’ category. NIC 38 shows innovation ‘New to India’ for 50% of firms. The sector however, has insignificant share in the total sample. Besides that agricultural product (NIC 01), pharmaceutical sectors (NIC 21), other transport equipment (NIC 30), and electrical equipment (NIC 27) show notable innovations that are ‘New to India’ (Figure 6).
X. Strategies for Innovation (Innovation Activities)
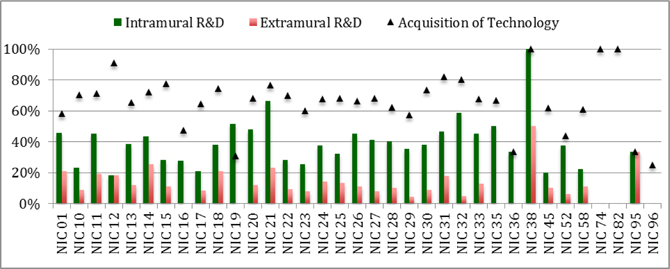
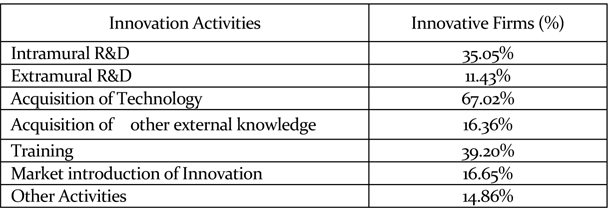
Innovation strategies of the innovative firms have been captured through the innovation related activities undertaken by these firms. Focus is drawn both on R&D and non-R&D activities. In R&D activities two broad distinctions are made between in-house and extramural R&D activities (figure 7). Rest of the activities are ‘acquiring technology, knowledge etc.’, ‘training of the personnel’, and ‘taking innovation to the market’. Table 3 shows percentage of innovative firms undertaking innovation related activities. It is clear from the table that acquisition of technology (machinery, equipment and software) is the commonly adopted practice of the innovative firms. Intramural R&D is a widely accepted norm than extramural R&D.
[Table 3] Innovation related activities of innovative firms
Innovation related activities of innovative firms
XI. Sources of Technology/Innovation
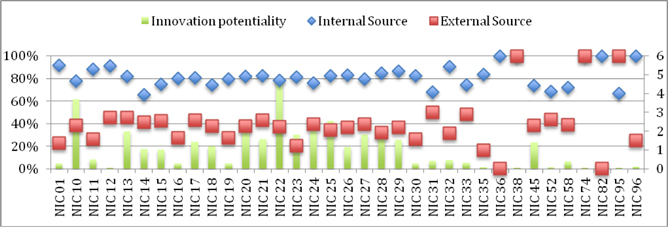
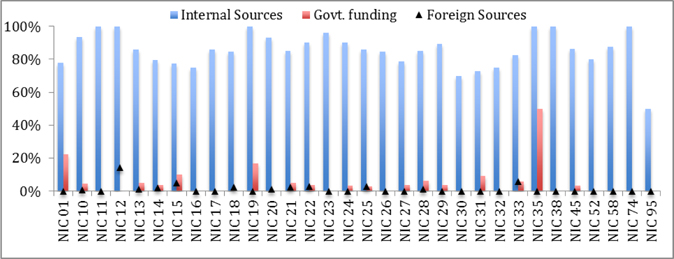
Across the sectors, firms are generally dependent on internal sources for innovation related activities irrespective of the innovation potentiality of the sectors. And sectors, where innovative firms show higher dependence on ‘external source’, have negligible shares in the sample. They are mostly from service industry, namely, computer repair (NIC 95), professional and scientific activities (NIC 74) and waste treatment (NIC 38) (See Figure 8). Table 4 shows correlation of source of technology use by the innovative firms with the innovation potentiality of the sectors. There is indication that higher the innovation potentiality lesser is the dependence on internal sources. The same is also true for sourcing of fund.
[Table 4] Source of innovation and innovative firms

Source of innovation and innovative firms
Except the farming sector internal source remain the most trusted source for innovative firms in all sectors. Accessing Government funding is rare (See Table 5).
[Table 5] Funds for innovation activities

Funds for innovation activities
XIII. R&D and Non-R&D Innovations
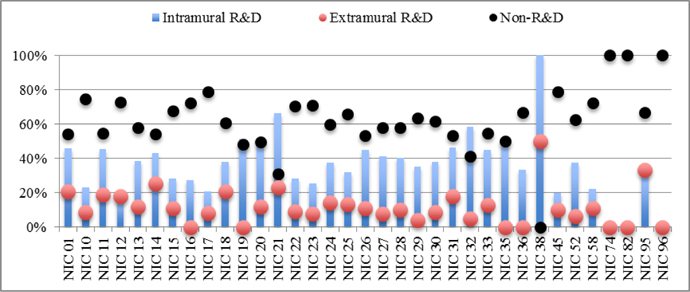
Out of the total innovative firms 37% have formal R&D setup. 35.05% of the total innovative firms have intramural R&D setup whereas 11.43% of them have opted for extramural R&D. Innovative firms in most of the sectors are not engaged in R&D activities (Non-R&D) (see Figure 9). NIC 21, which is the pharmaceutical sector, and generally considered as R&D intensive, is an exception from the general trend. However, there are sectors such as NIC 19, NIC 20 and NIC 31, having relatively higher number of firms engaged in either of the types of R&D activities (intramural or extramural, or both).
XIV. Non-technological Innovations
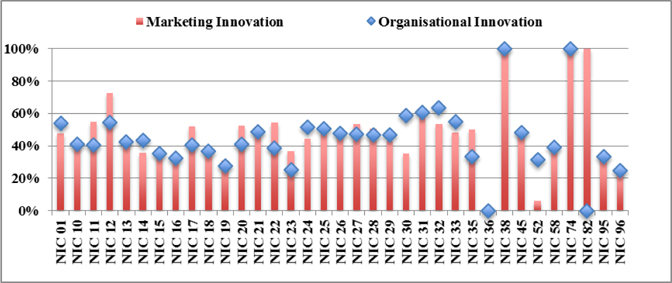
Non-technological innovations have been categorised as organisational innovations and marketing innovations and nearly 60% of innovative firms are involved with non-technological innovations, out of which 46% of the innovative firms are into marketing innovation and 43% in organizational innovation (refer figure 10). It is generally believed that non-technological innovations are closely complementary to technological innovations because new technology requires new organisational dynamics and hence new formations within the organisation of an enterprise. Also new innovations need new marketing initiatives for realisation of the investment on innovation in real time. Correlation coefficient between organisational and marketing innovation is as high as 0.56. So, both forms of non-technological innovations go hand in hand, except that marketing innovations have comparatively higher presence in NIC 12 (Tobacco product), NIC 38 (Waste treatment), NIC 74 (Professional and scientific activities) and NIC 82 (Office administration equipment).
XV. Composition and Training of HR for Innovation
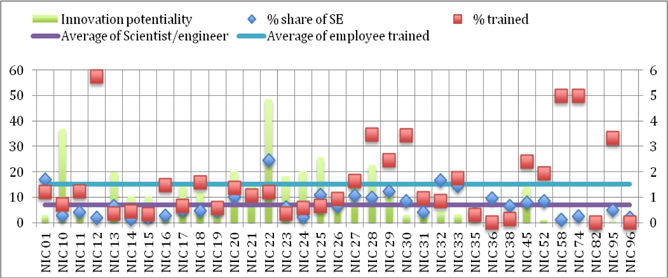
Figure 11 shows that average of percentage of workforce trained is about 15%. There are 9 sectors that are above average and most of them have very low innovation potentiality. Average share of scientist and engineer workforce is about 7%. NIC 22 - rubber and plastic sector, has as high as 24% scientist and engineer workforce. Employees are mostly trained in-house and this is the practice across the sectors. Training in institutions abroad or training with collaborators are rare initiatives. This is also true for accessing sources of funding for training. Innovative firms, across the sectors, have rarely accessed government, as is shown in Figure 12.
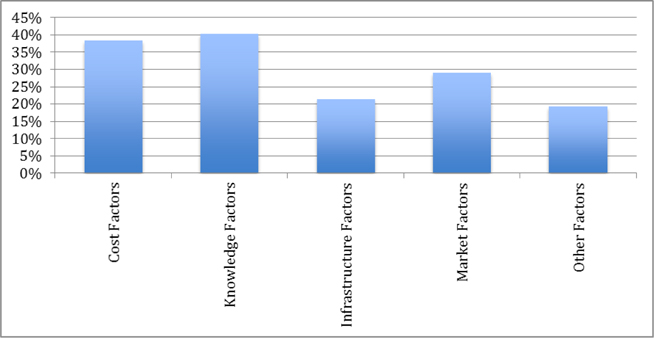
The firms studied by the survey were asked to identify the barriers to innovations in four major groups of barriers; namely, cost factors, knowledge factors, infrastructure factor and market factors (see Figure 13). Access to ‘knowledge/information’ has been found most important barrier by about 40% of the innovative firms followed by ‘cost factor’ associated with innovation.
Total 3,184 firms (35.37%) have been identified as innovative in 35 sectors. We have defined two indicators, namely, Innovation Intensity and Innovation Potentiality. Innovation Intensity is defined as a ratio between number of innovative firms in a sector and total number of firms in the respective sector. Innovation Potentiality is weighted Innovation Intensity, where share of a sector in total innovative firms has been used as weight. Rubber and Plastic product sector (NIC 22) has the highest innovation potentiality and second highest share in innovative firms. Manufacturing of food products (NIC 10), which has second highest innovation potentiality, has the highest share of sample as well as innovative firms. They are followed by tobacco (NIC 13), chemical and chemical products (NIC 20), non-metallic mineral products (NIC 23), basic metals (NIC 24), and fabricated metal products (NIC 25) and have significant shares of total innovative firms. Firms with less than 100 workforces dominate the innovation scenario in most of the sectors. Tobacco products (NIC12), wearing apparel (NIC 14), computer and electronics (NIC 26), transport equipment (NIC 30) and furniture (NIC 31) have significant presence of larger firms with 100 to 499 workforces. Sectors having more than average share of ‘product innovations’ are not those with highest innovation potentiality. In case of ‘process innovation’ the picture is opposite, showing negative relation of moderate magnitude with innovation potentiality. Innovations in ‘product quality and standard’ have been recorded in 42.37% of innovative firms. However, no clear pattern is evident when seen in terms of innovation potentiality of the sectors. Innovations in ‘more efficient input use’ show negative correlation with innovation potentiality of the sectors. On the other hand innovation in alternative material use in production system is not very popular. Most of the innovations are ‘new to the firm’ category. Innovative firms in agricultural product, electrical equipment and pharmaceutical sectors show innovations that are ‘new to India’. Sectors, which shows higher incidence of use of external technology, have negligible shares in the sample, and they are mainly from service industry groups, namely, computer repair (NIC 95), professional and scientific activities (NIC 74) and waste treatment (NIC 38). There is somewhat indication that higher the innovation potentiality lesser is the dependence on internal sources of technology. The sectoral scenario for arranging funds for sourcing technology is generally non-innovative. The sector-wise division of innovative firms do show inclination for using domestic financial sources as often as internal sources. Except the farming sector internal source remain the most trusted source for innovative firms in all sectors. Accessing government funding is rare. Innovative firms in most of the sectors are not engaged in R&D activities, intra or extra mural. NIC 21, which is the pharmaceutical sector, and generally considered as R&D intensive, is an exception from the general trend. Correlation coefficient between organisational and marketing innovation is as high as 0.56. So, both forms of non-technological innovations go hand in hand, except that marketing innovations have comparatively higher presence in NIC 12 (Tobacco product), NIC 38 (Waste treatment), NIC 74 (Professional and scientific activities) and NIC 82 (Office administration equipment). Average share of scientist and engineers is about 7%. NIC 22 - rubber and plastic sector has as high as 24% workforce as scientist and engineer. ‘Training of the employees’ is undertaken mostly in-house and this is the practice across the sectors. Training in institutions abroad or training with collaborators are rare initiatives. This is also true for accessing sources of funding for training. Rarely innovative firms in any sector have accessed government or foreign sources for training their employees. Access to ‘knowledge and information’ and ‘cost of innovation’ are perceived as the major barriers to innovations.
It is to be noted that the survey is the first of its kind and has several limitations in terms of coverage of the size, segments, issues and nature of business of the firms. Nevertheless the broad findings of the survey help developing hypotheses for further more focussed investigations. The survey was conducted through visiting the firms and discussion with the owner/proprietor wherever possible. Many issues, that were not very clearly reflected in the data/information collected, had come out of such discussions and provided valuable inputs for general understanding of the innovation dynamics.
The survey highlights that small firms acquiring new machines, striving for quality and standards, and cost reduction are the dominant aspects of innovations. Most of these changes are ‘new to firms’, or in other words efforts to match the industry peers. Again, most of the innovative firms do not have adequate strength of qualified scientific and technical manpower. They depend mostly on internal sources for fund, new knowledge, and training of manpower. R&D is quite insignificant among the innovative firms, whereas non-technological innovations have been observed as wider practice.
The textbook understanding of innovation does not have room for firms trying to match the market practice, their innovative capability being limited by their ability to realise the cost of innovation from the market (Schumpeter, 1939 and 1942; Carlsson, 2004). Innovative firms, as identified in the survey are not striving for monopoly position for themselves; instead changes initiated by them are for survival in a competitive environment. Even for adopted changes firms are inward looking. This resonates well with the finding of the recent innovation study in low income countries: a survey report of Ghana (Fu, X. et al., 2014), where innovation is a ‘means for development and not the outcome of development’. In Ghana, as reported, innovation activities are taking place both across sectors and industries, but they are mainly incremental in nature and mostly for the base of the development pyramid. In fact, in the context of developing countries technological innovations are defined as the process by which firms master and implement the design and production of goods and services that are new to them irrespective of whether they are new to their competitors, their customers or the world (Mytelka, 2000).
It is to be noted that already existing government initiated wide network of innovation support system are not much accessed by the firms (for the extent of support system available to MSME see www.dcmsme.gov.in/). The disconnect between the innovation support system and the production system is apparent from the survey (see, www.nationalinnovationsurvey.nstmisdst.org; specially chapter 11 on NIS, RIS and SIS for understanding extent and nature of disconnect).
The disconnect gets translated into barriers to innovations. As shown in the survey result, access to information and knowledge and cost of innovation has been the main barrier to innovation. This indicates the urgent need to strengthen the linkages between knowledge generating and disseminating system and the production system (including financial institutions, R&D and educational organisations, and also large number of other organisations providing support to innovation initiatives).
The samples in the survey are mainly constituted of small firms operating in a highly competitive market condition. Innovative behaviour of these firms, as described above, comes closer to Arrow’s (1971) view that competitive market condition can lead only to minor innovations. Arrow indicates that institutional factors become most important tools for inducing innovations in an economic system. The survey findings, therefore, draw attention to the need for review of the existing regulatory system for a more conducive innovation eco-system that can augment realisation of the cost of innovation. It indicates the need for an appropriate incentive structure to overcome the constraints of competition. It also indicates the urgent need for activating the support system for addressing the issue of disconnects between the production system and the innovation support system. (Strengthening while synergising NIS).
The survey highlights the interesting facets of innovation where the majority of the innovative firms are not engaged in R&D activities; a fact common across many of the BRICS and European countries (see EuroStat website). This calls for devising a separate policy with focus on promoting innovation for non-R&D firms, especially for MSME sector (see Gault, 2013).
