For a high precision DUV (Deep Ultraviolet, 193 nm) lithography device, the qualification of wavefront aberration is rigorous. To diminish or eliminate the influence of gravity, the lens elements are finely designed before fabrication to avoid surface deformation. Lenses are deliberately supported in kinematic ways to decrease the impact of mechanical stress [1-3]. To correct assembling errors like tilt and decentration, adjusting mechanisms are employed, which are also helpful for the compensation of low order rotational symmetrical aberrations, which indicate piston Z1, defocus Z4 and primary spherical Z9. The projection objective always performs well at the beginning, during the working hours, due to the fact that all materials have good absorption at such a short wavelength, the energy absorbed by the projection lens causes significant rise in temperature, which brings surface deformation and refractive index change, and this produces so called thermal aberration [4-6]. While as time goes on, the heat accumulates in the illuminated zone, thermal aberrations become dominant to make the optical performance bad. Active optics is introduced to compensate time-changing thermal aberrations, especially the non-rotationally symmetrical astigmatism which mainly appears in dipole illumination mode. In this type of illumination mode, the lens elements present nonuniform distributed temperature which causes non-rotationally symmetrical deformation and inhomogeneous refractive index, thus time-changing non-rotational symmetrical aberrations like astigmatism occur [7]. Active real-time dynamic compensation is the only means to compensate this type of aberration.
The prediction of thermal aberrations plays a significant role in the real-time compensation of thermal aberrations. Prediction of thermal aberrations based on plentiful experimental or realistic data is receivable [8], while for a newly investigated device, simulation results are indispensable to offer guides for fabricating and compensation design.
In Section 2, the analysis approach is introduced and simulations are carried out. In Section 3, thermal aberrations induced by refractive index change, surface deformation and stress are studied. Meanwhile, the influence of thermal effects on the imaging of dense lines is discussed.
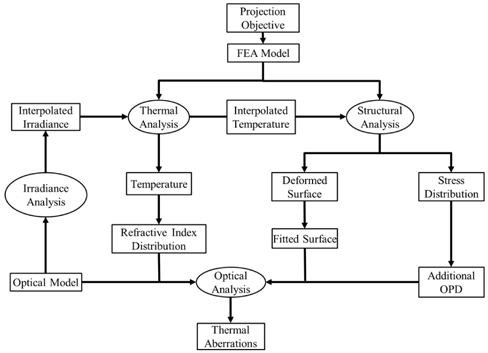
Thermal aberration in lithography projection objective is the synthesis of refractive index change, surface thermal deformation and thermal stress. We probe the thermal effect by integrated optomechanical analysis and the flow chart is depicted below in Fig. 1.
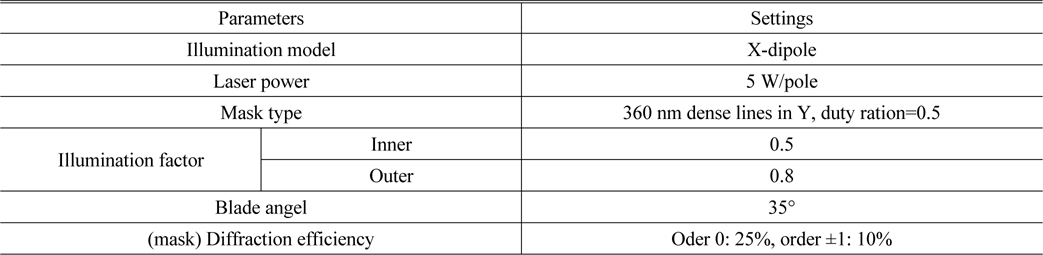
At the beginning, the irradiance analysis is carried out to get the irradiance distribution in the system by ray tracing, and then interpolation is made to get the nodal irradiance data in the FEA model. The projection lens we use for simulation is a dioptric system consisting of 27 lenses working at 193 nm with magnification of −0.25×. This process is handled in the software Lighttools and the corresponding parameters are listed in Table 1.
[TABLE 1.] Illumination parameters

Illumination parameters
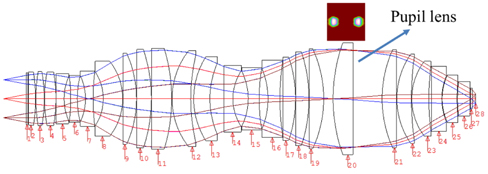
The overall optics layout is present in Fig. 2 and lens 20 is the pupil lens in the system. The diffraction efficiency is calculated based on the diffraction theory [9]. The irradiance distribution on the pupil plane by ray tracing is also pictured in Fig. 2.
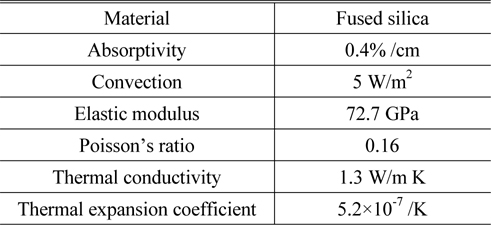
In the FEA thermal analysis, the heat source is the energy absorbed by the lens body illuminated by the laser, and the heat production can be calculated with nodal irradiance data and material absorptivity. In general, all of the three kinds of thermal boundary conditions: convection heat exchange, heat flow boundary and temperature boundary exist in the thermal analysis model. As the system is filled with N2, convection or heat exchange happens on the lens surfaces. Besides, the lenses are coated with anti-reflection films which absorb part of the laser power too. The heat accumulated in the films would transfer to the lens body and this kind of thermal interaction should be considered too. The circulating water cooling system is too complicated to model, while referring to the conclusion from reference [10], the contact zones or interfaces between lens and mechanical supporting devices almost keep steady temperature during the whole exposure or imaging process. Thus, in the simulation all the nodes located in these zones are set as a constant temperature boundary of 22℃. For convenience, the lens supporting method we chose is 6-point side supporting, from the results in the literature [11]. The supporting mechanisms are uniformly located surrounding the lens from the side, and each interface between the supporting structure and the lens has an angular dimension of 10°. The main parameters for thermal analysis are listed below in Table 2 [12].

Parameters for FEA
Three processes are involved in the exposure process: die loop, wafer loop and lot loop. For instance, the flow chart of the wafer loop is portrayed in Fig. 3. Considering the simulation time and computer physical memory, we take the wafer loop, and 250 wafers are exposed.
From the simulation results in Section 2, we have attained the nodal temperature. Thermal deformation and stress data are also obtained by structural analysis. The contribution of aberrations from all the three parts will be discussed.
3.1. Refractive Index Change Induced Aberrations
The refractive index changes with temperature as expressed

Where
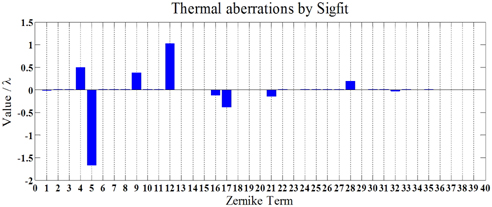
The simulation is meant to guide the researchers to make an assessment of the magnitude of thermal effects. The results in Fig. 5 show that in the situation of dipole illumination, thermal aberrations are tremendous. At the thermal equilibrium, the system suffers from significant non-rotationally symmetrical aberrations, which indicate astigmatisms (Z5, Z12, Z21) and 4-foil aberrations (Z17 and Z28). Besides, rotationally symmetrical aberrations defocus (Z4) and spherical aberrations (Z9 and Z16) are outstanding too.
Although the simulation by SigFit is reliable, problems are that due to the working principle of SigFit, it costs days of time to import the geometry model and nodal temperature into SigFit, which makes it inefficient to simulate the thermal aberrations of all the time points during the exposure process. Another approach studying the thermal aberrations takes the advantage of User Defined Gradient (UDG) Index module in CODE V. However, the existing several models of UDG in CODE V are all for rotationally symmetrical distributed index. For the situation of dipolar illuminated lithography, they are useless. We need to define the index distribution function, and debug it to a DLL file, thus it can be invoked by CODE V for ray tracing.
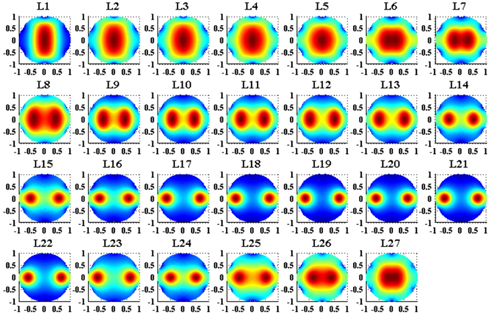
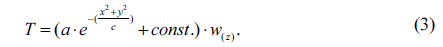
The heat transformation model is so complex that it has no analytical solution to accurately express the temperature distribution of the lithography system. A surface temperature map of all the 27 lens elements is exhibited in Fig. 6. Referring to the characteristic of the distribution, in our previous work on the research of temperature distribution in lithography projection objective (to be published), we came up with a spatial distribution function to approximately express the temperature in the lens body of dipolar illuminated condition.
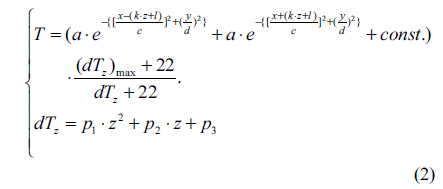
Where
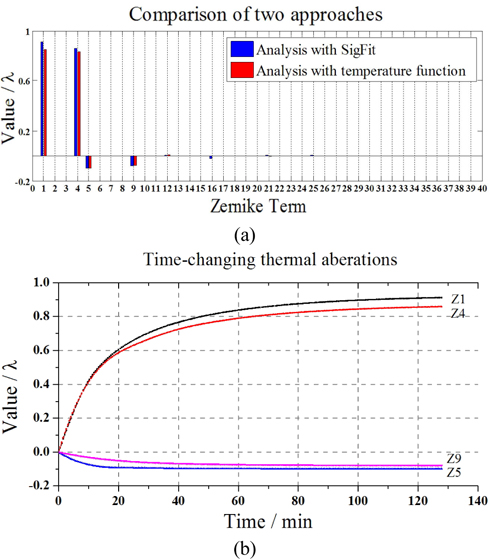
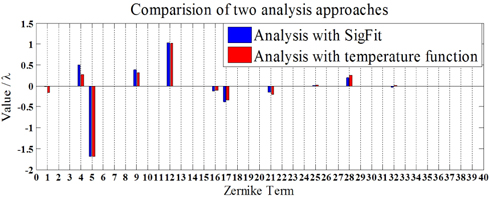
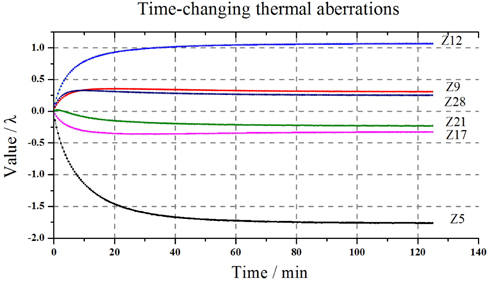
From Fig. 7, we find that the results with the temperature distribution function we put forward have an exciting accordance with the results based on SigFit. The temperature distribution function is proved to be reliable, and owing to it the simulation time is shortened from days (by SigFit) to minutes, the time cost is reduced up to 3 orders. The growth of thermal aberrations during the exposure process is obtained and depicted in Fig. 8.
The results in Fig. 8 reveal that thermal aberrations change with exposure time. At the beginning, the aberrations grow rapidly with high growth rate. As time goes on, the lens temperature rises, then the convection is strengthened which in turn suppresses the rise of temperature, thus the growth rate of thermal aberrations falls. At last the thermal equilibrium state is reached and thermal aberrations remain stable. 4-foil aberrations Z17 and Z28 take about half an hour to reach a stable value while astigmatisms Z5, Z12 and Z21 take about one hour.
In addition, to verify the validation of our method with temperature distribution function, we simulate the thermal aberrations in the exposure of the same pattern of mask with conventional or traditional illumination. The temperature function of this kind of illumination is also mentioned in our previous work as

Where
3.2. The Impact of Surface Deformation and Thermal Stress
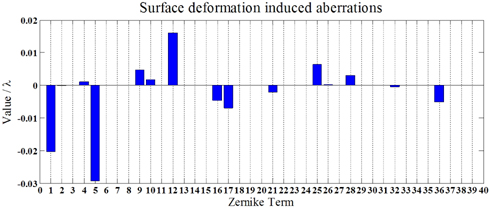
Surface deformation data caused by thermal expansion is fitted with Zernike polynomials which can be imported to CODE V to get the aberrations. The results are portrayed in Fig. 10. Results indicate that the deformation induced aberration terms are almost the same with the results of refractive index change. The difference is that 3-foil aberration Z10 appears due to the lens supporting method and it is about the magnitude of 0.001 λ. Primary astigmatism Z5 is about 0.03 λ, and primary 4-foil aberration Z17 is about 0.01 λ. Comparing with the results in Fig. 7, the impact of surface deformation is about 2% of refractive index change. Obviously, it is ignorable in the simulation aiming at evaluating the magnitude of thermal aberrations.
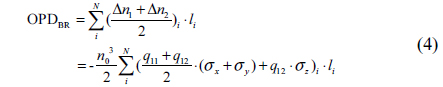
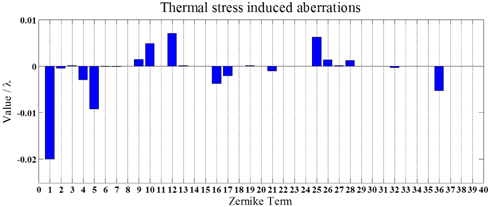
According to the theory of elasto-optical effect, the stress in the lens body would cause birefringence which produces an additional OPD to the wavefront [14]

Where
3.3. The Imaging of Dense Lines
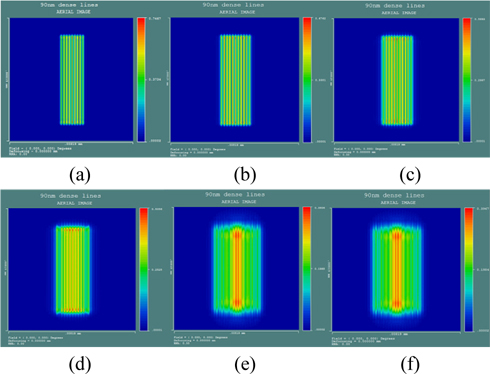
To determine the influence of thermal aberrations on the optical performance, dense lines with CD of 90 nm are simulated to be imaged under dipole illumination. Samples are taken at several time points during the exposure process. Figure 12 maps the images at different times.
It is easy to find that as time goes on, the image becomes fuzzy. At the beginning, the lines are clear with good contrast. After the first wafer is exposed, the edge of each line is a little fuzzy but still distinguishable. One minute later (in Fig. 12(c)), the contrast becomes worse, and each line overlaps a little with the neighbors. At the second minute (in Fig. 12(d)), the lines located in the center are still distinguishable although the contrast is disappointing. While the lines of the outside are indiscernible with terrible contrast. When the system reaches thermal equilibrium (in Fig. 12(e) and (f)), the image is misty, one can hardly distinguish the lines and the contrast is just a disaster. All the images share a common characteristic that the lines in the center are clearer than the lines located near the edge. This phenomenon mainly owes to the fact that astigmatisms dominate among the thermal aberrations. The results have revealed the significant impact of thermal aberrations by lens heating, meanwhile, the dynamic compensation of thermal aberration is essential and indispensable.
The prediction of thermal effects in lithography projection objective plays a significant role in the real-time dynamic compensation of thermal aberrations. In the situation of dipole illumination in DUV lithography, the temperature distribution is non-rotationally symmetrical, which would cause time-changing astigmatisms. With integrated optomechanical analysis by SigFit, the paper probes into the thermal aberrations induced by refractive index change, surface deformation and thermal stress. To improve the efficiency of thermal aberration simulation, we put forward a lens temperature distribution function. Owing to the function, we successfully shortened the time of thermal aberrations simulation from days (by SigFit) to minutes, and comparison shows that the thermal aberrations’ results from the two ways match well, which has certified the effectiveness of the temperature distribution. Comparing with the impact of refractive index change, the influences of surface deformation and thermal stress are about 3% and 1% respectively, which indicates that thermal aberrations are mainly caused by the change of refractive index. Among the thermal aberrations, nonrotational symmetrical components astigmatisms and 4-foil aberrations dominate in the dipolar illuminated lithography projection objective. The system takes about 1 hour to reach thermal equilibrium, and the primary astigmatism Z5 reaches about 1.7 λ. The results of the imaging of dense lines indicate that the contrast get worse as time goes on, which reveals the thermal effects on the performance of projection objective. Moreover, the paper has offered an approach for the fast simulation of thermal effects of lithography projection objective.