Performance of a battery is measured typically in terms of voltage, current, and state of charge. The measurement of battery voltages have relied upon the development of complex circuits [1-3]. These devices are unable to measure variations of voltages (thermal voltages) of single individual components such as the anode or cathode. Moreover, they are incapable of providing information on the energy distributions of charged carriers such as the electron or ions involved in the components. There have been other attempts to understand carrier behaviors using the electrochemical strain microscopy [4], X-ray diffraction [5], or synchrotron tomography [6]. However, they have the same limitations as the stated ones. Obtaining energy distributions of charged particles and assessment of their contributions to the voltage or current are highly in demand for the design and optimization of batteries at the material or particle level.
This work presents a new method for monitoring variations of thermal voltages. It is based on the imaging of speckle patterns of an exposed battery electrode and analysis of pixel sum distribution function (PSDF) extracted from the speckle pattern. Related processes are explained in detail. Also, underlying principles of the method are discussed.
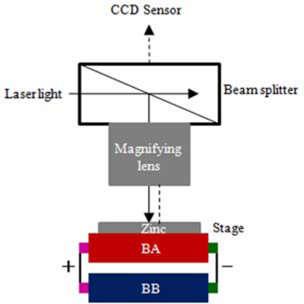
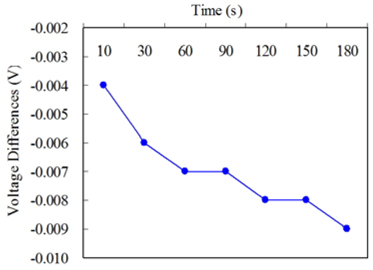
Figure 1 shows schematic of a testing facility equipped with a speckle imaging system designed to collect speckle patterns. As illustrated in Fig. 1, two zinc carbon batteries referred to as “BA” and BB” are connected in parallel. The BA represents the battery to discharge. The other BB with a lower initial voltage acts as a load. The metal capsule of the BA was peeled off to image speckle patterns of Zn metal exposed to the air, which acts as the cathode. The imaging system consisted of a 250 mW Nd:YAG laser operating at 532 nm, a charge coupled device (CCD) sensor, a beam splitter, and a microscope lens with 100 times magnification. The CCD sensor takes speckle patterns at an exposure time of 10 ㎲. The discharge process was monitored over a period of 3 minutes and a total of 8 speckle patterns were collected. The discharge voltages of the BA were measured with an oscilloscope (DS-5554, IWATSU) and the measurements with the time are shown in Fig. 2. The voltages shown in Fig. 2 are equivalent to those subtracted from the initial voltage of 1.514 V of the BA. It is evident that the discharge voltage keeps decreasing with the time. This indicates that the thermal voltage of the Zn metal induced by the decreasing discharge voltage also decreases with the time. In Fig. 2, small variations in the discharge voltage are observed between 60 and 90 s and 120 and 150s. This is likely to be attributed to the similar variations in the electron charges generated in the cathode.
3.1. PSDF Extracted from Speckle Patterns
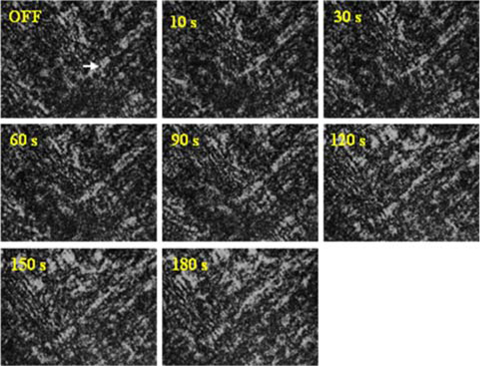
Figure 3 shows CCD images taken with the imaging system. Each CCD image has a dimension of 2080×1536, which was downsized by a factor of 7% to 146×108. The “OFF” image was taken with the laser light turned off. The next 7 images were taken at different discharge times. From the speckle patterns, PSDFs are calculated as a function of the grayscale and pixel sum as carried out for the speckle patterns of plasma [7, 8]. Here, the pixel sum of a grayscale was defined as the total number of pixels with the same grayscale. The grayscale and pixel sum were assumed to match an energy state and a particle density, respectively. The assumed charge and particle properties of the two image variables are supported by the correlations between them and ion density [7] or emitted light intensity [7, 8]. The confirmed correlations suggest that the PSDF contains information on the behavior of charged particles.
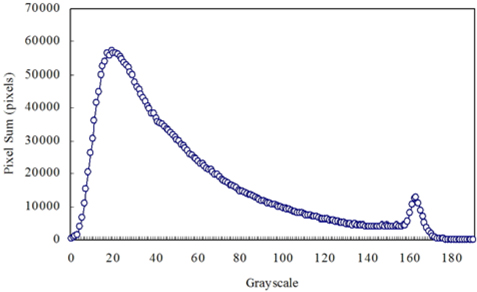
Figure 4 shows a PSDF extracted from the speckle pattern corresponding to the OFF image of Fig. 3. As illustrated in Fig. 4, the PSDF is composed of two sub-PSDFs. The left sub-PSDF distributing between 0 and about 142 represents the behavior of the dark and less dark pixels composing the speckle pattern. The right one shows the behavior of the bright pixels. In the same way, PSDFs of other speckle patterns could be derived.
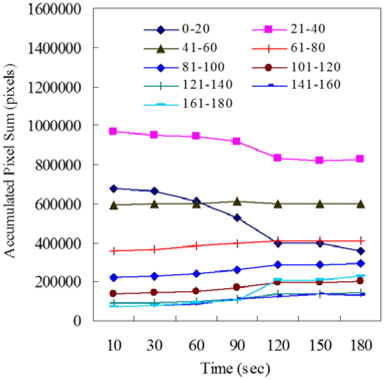
It is well expected that depending on the grayscale ranges pixel sum may vary differently. To investigate this aspect, the whole grayscale range is divided into 9 individual grayscale ranges. There are other possible grayscale ranges beyond the last 161-180. However, they are excluded because the pixel sums calculated at the grayscale values exceeding 180 were all zero. Figure 5 shows variations of accumulated pixel sums as a function of the grayscale ranges. The accumulated pixel sum (APS) in the “0-20” grayscale range is equivalent to the sum of the pixel sums computed at the individual grayscales belonging to it. This calculation is equally applied to the other grayscale ranges. As identified from Fig. 5, the APS is seen to decrease with the time only in the two ranges of 0-20 and 21-40. The other variations are either negligibly small or increasing as opposed to the first two. The identified APS variations strongly correlate to the one of the discharge voltage exhibited in Fig. 2.
3.2. Optimization of a Pixel Grayscale Range
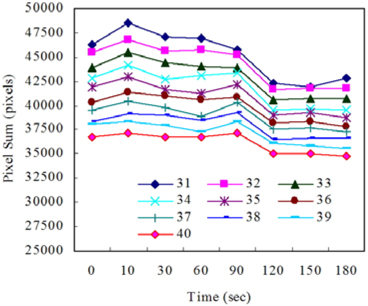
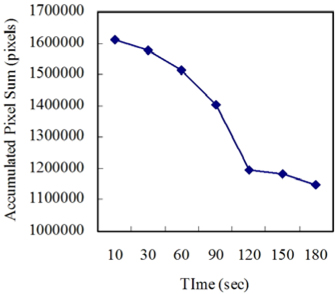
Some of the pixel sums pertaining to the second 21-40 grayscale range may not be suitable candidates for thermal voltage monitoring. To check this, variations of pixel sums at all the grayscale values belonging to the range were calculated and part of them are shown in Fig. 6. Variations of the pixel sums at the grayscale values smaller than 31 are excluded because they exhibited tendencies similar to that of the discharge voltage. From Fig. 6, it is known that the pixel sum variation at 40 deviates far from the voltage variation. Those at other grayscale values are all inclined to decrease. Therefore, the most appropriate grayscale range is determined to be 0-39. The variations of APS calculated in the optimized grayscale range are shown in Fig. 7. The APS continues to decrease with the time, which coincides with the tendency of the discharge voltage. The decrease in the discharge voltage signifies another decrease in the particles associated with it. Fig. 7 illustrates that the expected particle variation coincides with that of the APS. This signifies that the voltage variation can be accounted for by the particles involved in the APS calculation. In other words, the APS and grayscale values of the pixels belonging to the optimized grayscale range represent the number density and energy states of the particles (i.e., electrons) respectively responsible for the voltage variation.
3.3. Identification of Dark Matter
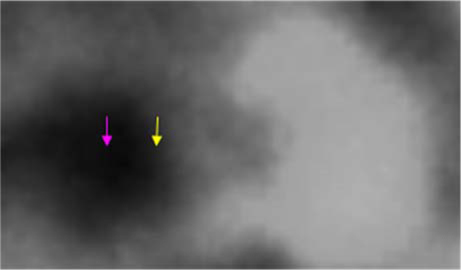
It is meaningful to locate particles subjected to the 0-39 grayscale range. For this, a tiny sub-image was separated from the OFF image of Fig. 3 in the region pointed by the arrow. The isolated image is shown in Fig. 8. The pink arrow indicates the minimum grayscale value (=11) of the dark particles. The other yellow arrow points a pixel with the “39” grayscale value placed between the dark and less dark particles. The identification of the two grayscale values indicates that the presence of the dark particles is able to be characterized by the grayscale values ranging between 11 and 30. Depending on the dark particles, the minimum grayscale value can have the smallest “0”. Therefore, it is known that the 0-39 grayscale range represents only dark particles. This signifies that the dark particles can represent variations of thermal energy of the Zn metal. This suggests that the dark matter has the capability of absorbing the thermal energy variations. Unlike the less dark particles, the dark particles appear to have a shape. From this perspective, they are termed “dark matter”.
As noted and stated earlier, either the discharge voltage of the BA or the expected thermal voltage in the Zn metal continues to decrease during the battery discharge. As the absorbed thermal energy by the dark matter is not lost, it becomes stored in itself and this inevitably results in an increase in the APS. The association of the APS with the thermal energy is to be discussed later. However, this was not observed as seen from Fig. 7. This indicates that the dark matter has another property emitting the absorbed thermal energy upon its absorption.
3.4. Dark Matter Versus Black Body
The suggested absorption and radiation properties of the dark matter are same as those of the black body. The black body refers to an object that absorbs all electromagnetic radiation subjected to it. As the black body is in a uniform temperature, it emits electromagnetic radiation called the black body radiation. The black body radiation has a characteristic frequency distribution with the spectral energy density dependent on the temperature of the black body [9]. The entire distribution peaked at a characteristic frequency shifts to the one at higher frequencies (or shorter wavelengths) with increasing the temperature. From this perspective, the black body radiation is the process of emitting black body’s thermal energy in terms of the electromagnetic radiation.
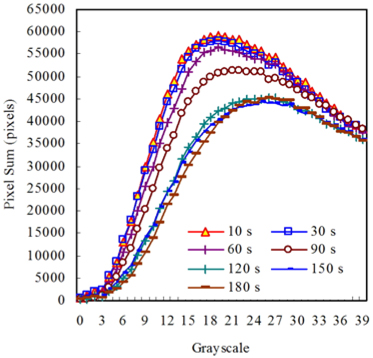
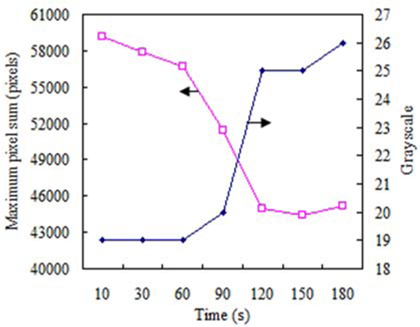
To exploit any correlations between the dark matter and black body, PSDFs in the 0-39 range are prepared in Fig. 9. Noticeably, the PSDF shapes are nearly identical to those of the typical spectrum of the black body radiation [9]. Figure 10 shows the variations of the maximum pixel sums and the corresponding grayscale values. The maximum pixel sum decreases with time, but the grayscale value increases. The opposite variations between them are consistent with those of the maximum radiation density and wavelengths as stated. In other words, the maximum pixel sum and respective grayscale value match the maximum radiation density and peak wavelength. Quantitative analysis of the noted relationship is under study.
Another feature extractable from the radiation spectrum of the black body is the similarity between the variations of the maximum radiation density and the temperature. For example, smaller maximum radiation density is obtained at lower temperature. As referred to the noted similarity between the maximum pixel density and maximum radiation density along with the decreasing maximum pixel sum with the time, it can be inferred that the temperature of the black body (or Zn metal) decreases with time. This can validate the earlier statement that the thermal voltage of the Zn decreases with the discharge voltage.
3.5. Surface Plasmon Carriers Versus Speckle Pattern
It is well recognized that there exist surface plasmon carriers (SPCs) at the interface between any two materials such as the zinc metal and dielectric air employed in this experiment. As the laser light is injected into the metal surface, the surface appears as an image with dark and bright spots mixed together. The image is typically termed “speckle pattern” and its formation has been attributed solely to the scatter of emitted light intensity. However, investigations into various speckle patterns formed as laser light was injected revealed that they were composed of two types of dark and bright matter particles [10]. The dark matter particles could be clearly separated from the bright ones in a visualized map of their energy orbits [10]. A related work [11] reported that a speckle pattern represents an electromagnetic field created by the positive light matter and negative SPCs. This new definition was based on the experimental observations that light is an easily collectable matter particles [12] positive in charge [13] as inferred from the measurements of chemical compositions [14]. The matter property of light was further supported by imaging matter particles of laser light [15].
In this study, speckle patterns were imaged at the interface between the air and metal. As stated earlier, the SPCs exist on the Zn surface. This indicates that they are included in the speckle pattern of Zn metal surface. It must be noted that they appear even in non-metallic plastic as illustrated [10]. This signifies that they exist on any matter surface. As seen from a variety of light matter reported [12, 13], matter particles of light appear as the hard mater embedded in the sticky transparent particles. This means that the dark and less dark particles composing the speckle pattern are not related to the light particles. Therefore, it is certain that they represent the SPCs, and that the SPCs are part of the speckle pattern.
It was demonstrated that speckle patterns could be used for monitoring variations of thermal voltage induced in the Zn cathode. This capability can be extended to assess voltage variations of any battery components or any materials in other applications. The dark matter of the SPCs was suggested to exhibit capabilities of absorption and radiation of thermal energy as the black body. These suggestions were validated by showing agreements with several distinct features of the black body radiation spectrum. The equivalence of the dark matter and black body is meaningful because it may open a number of applications. As the power spectral density is obtained under the same experimental ambient as that employed during the imaging, precise temperature values of the dark matter could be quantified. Related work is under way. It was also cleared how the SPCs are associated with the speckle pattern. Compared to the existing sensors, the proposed sensing system is advantageous because it is able to provide details regarding the number and energy states of the particles involved in the thermal or electrical variations as could be convinced from the reporting correlation as well as from the previous ones between the diagnostic variables of the SIS and charged particles such as the ions. The noted correlations serve as evidence of high sensitivity of particles composing the speckle pattern. Meanwhile, multiple speckle patterns taken at the same time instant during the plasma monitoring were found highly repeatable as once could be verified by the little varied diagnostic variables. The SIS with these distinct features are expected to contribute to real-time monitoring of charged particle behaviors.