Optical imaging is a burgeoning area whereby various non-invasive techniques are employed explicitly to retrieve quantitative morphological (volume, surface area and sphericity), biochemical (haemoglobin content and concentration), and mechanical properties (dynamic membrane fluctuations) of individual bio-specimens specially RBCs which are key to diagnose the pathophysiology of a number of diseases in hematology [1-4]. Automated blood cell counters based on the complete blood count have been most commonly used to analyze the primary and critical properties of RBCs in clinical hematology but limitations exist in accurate diagnosis [5]. Dynamism of RBCs and their related pathophysiology can be explored using detailed analysis at the single cell level. In this context, non-invasive and highly sensitive optical diagnostics modalities such as; optical tweezers (OTs) [6-8], flow-cytometry [9], atomic force microscopy and micro-Raman spectroscopy [10] have been employed. The intrinsic optical parameters of the human RBC, such as absorption coefficient, scattering coefficient, anisotropy factor and hence complex refractive index (RI) were determined both experimentally and theoretically by Friebel et al. [11]. The other optical techniques at the individual cell level are; interferometric quantitative phase-microscopy [12, 13], digital holographic phase-contrast and differential interference contrast microscopy [14-18], lateral shearing digital holographic imaging [19], Fourier-phase microscopy [20], Hilbert phase-microscopy (HPM) [21, 22], diffraction phase microscopy and tomographic phase-microscopy [3, 23-26]. All have enabled the extraction of sub-nanometer path-length changes, 3D RI map and millisecond scale fluctuation dynamics of RBC membrane to enhance the understanding of RBCs significantly [27]. Further Rappaz et al. [28, 29] and Kemper et al. [30-33] in combination with microfluidics have demonstrated digital holographic microscopy (DHM) for quantitative phase imaging (QPI) of live-cells from a single-shot hologram followed by decoupling procedure conceptualized by Evans and others [34, 35]. In the realm of technological improvements a simple, cost-effective and compact optical unit based on a common-path phase shifting interferometry for QPI has been reported [36, 37]. Recently, real-time imaging and topography of RBCs from an entire complex optical wavefront (amplitude and phase) has been reported both in reflection and transmission mode using digital holographic reflectometry (DHR) [38]. But in DHR, RBCs are made stationary by adhering them directly to a glass surface that can invoke perturbations from two facets - physical contact and their own weight which might alter their innate morphology. Digital holography in conjugation with OTs (HOT) has been reported for 3D shape evaluation of convex shape objects by observing cells along different directions [39-42]. Mohanty et al. [43] have combined HOTs with quantitative phase-microscopy for decoupling geometric thickness from RI. It was realized by re-orienting the trapped RBCs by altering the power of beam and then retrieving phase-imaging at various orientations in transmission mode. But no clue of the consequences of radiation stress on the shape memory of anisotropic RBC on account of altering beam power is found. Most recently, Park et al. have reported a system employing optical diffraction tomography in conjugation with HOTs capable of simultaneous 3D visualization of the shapes and tracking positions of trapped microscopic samples with high lateral and axial resolution [44, 45]. Other common-path setups: a Michelson interferometer and a compact, portable, and extremely stable τ-interferometer have been reported which have enabled the recording of amplitude and phase profiles of biological samples for quantitative phase microscopy [17, 36, 37, 46, 47]. But a reflective surface of cover glass above the sample was used to generate a separate reference wave to create interference [48] which was avoided in DHM using a Michelson interferometer [17]. Memmolo et al. [49] provided an outstanding modality for full 3D characterization of both concave and convex shape cells using OTs with fiber Y-coupler. Here, it is pertinent to caution that our phaseimaging outcomes should not be compared with those already reported by Memmolo et al. [49]. Because we want to investigate first the utility of ‘arbitrary intensity profile’ containing inhomogeneous transverse intensity distribution for photodamage-free trapping of RBC and then interferometric phase imaging of trapped RBC using probe interferograms generated by a lab-made miniaturized Michelson interferometer (MMI). Thus immobilized RBC was obviated from substrate adherence induced perturbations. The experiment could be carried out only in reflection configuration due to the availability of an upright microscope.
The aim of this paper is two-fold. First to establish the usability of a laser beam of ‘arbitrary intensity profile’ in photodamage-free trapping of delicate RBCs so that contact activated perturbations, as arising in DHR [38] during phase-microscopy, can be addressed. Secondly, phase imaging of thus trapped RBC by interferograms generated from a lab-made MMI. The novelty of this study is to prove firmly the re-use of defective lasers/low-cost laser sources emitting beam profiles other than Gaussian profile for making the specimen stationary whereby beam quality factor does not carry a significant role. In addition, developing an inexpensive OTs set-up for multi-particle trapping.
In general, the 2D intensity distribution of an interferogram can be expressed as [21]:
where a(x, y) is the background intensity, b(x, y) is the amplitude modulation of the fringe pattern, Δd(x, y) denotes the optical path-difference (OPD) between sample and reference arms, θ(x, y) is the tilt angle and k = 2π /λ is the wavenumber (λ being the wavelength of laser light). The last term in Eq. (1) is the interference sinusoidal function of (2kΔd(x, y)+θ(x, y)). To extract phase, the spectral interferogram is Fourier transformed then spatially high-pass filtered to isolate the sinusoidal term and eliminate the background components. The filtered sinusoidal term can be expressed as;
Complex analytic signal associated with the real function of S(x, y) can be obtained as;
In Eq. (3) the imaginary part of the right-hand side stands for a principal-value integral, easily identifiable as the Hilbert transform of c(x, y). HPM extends the concept of complex analytic signals to the spatial domain and measures quantitative phase images from single-shot spatial interferogram recording [22, 33]. With the help of the Hilbert transform we obtained the complex analytical signal. Using Eq. (3), the wrapped phase map ϕ(x, y) associated with complex analytic signal S(x, y) is calculated as:
However, the phase profile Δφ(x, y) can also be retrieved with the following equation
where Δφ(x, y) is the phase-difference between sample (φs(x, y)) and reference (φR(x, y)), ns(x, y) is the RI of sample (RBC), n0(x, y) is the RI of suspension medium which is taken constant at illumination wavelength and d is the thickness of discotic RBC (sample) at ith pixel that varies along the diameter. Henceforth a 3D topographic phase-map of the RBC can be computed from Eq. (5). From Eq. (4) both the real and imaginary parts of S(x, y) depend on c(x, y) which is related with ϕ(x, y) by Eq. (5) that is further entangled with optical thickness (Δd) of the RBC. Interdependency of phase-map extraction with optical thickness and hence computation of RI of the RBC is customarily done by using two suspension media of known RI. Procedures to decouple these entangled parameters is elucidated elsewhere [31, 34, 35, 39-41, 43].
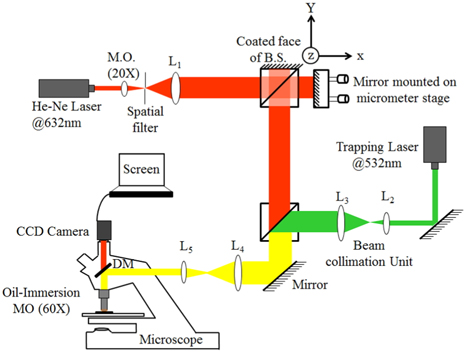
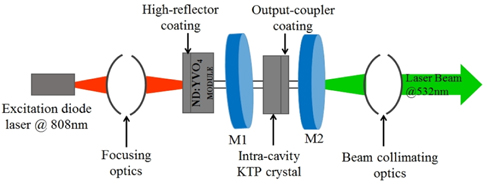
The schematic of simultaneous trapping of RBC using a laser beam of ‘arbitrary intensity profile’ and phase-microscopy using MMI is shown in Fig. 1. The single-beam optical trap used in this study is calibrated using a fan-cooled diode-pumped solid state (DPSS) Nd3+:YVO4 laser source (LASERGLOW from Richmond Hill, Canada) emitting an arbitrary beam profile of wavelength at 532 nm. It is imperative to mention here that cavity imperfections caused the generation of arbitrary beam per se. As far as the reproducibility of the arbitrary beam from the DPSS laser source is concerned, the spatial intensity distribution remains time-invariant. Various cavity-imperfections of this laser source such as; misalignment of cavity mirrors, age-related degradation of cavity material, non-homogeneity of active medium or lens aberrations could be inferred to be causing the generation of such beam of ‘arbitrary intensity profile’. To ensure technically the root cause of generation, the laser system was unbolted as shown in Fig. 2 and misalignment of mirrors was found clearly. In addition, age-related degradation of cavity material cannot be ruled out because measured power at the exit of the source was just 40 mW whereas company specifications pegged it to 1W. The role of the last two reasons mentioned above could not be ascertained but may also have participated. It is necessary to emphasize here that a broken laser was not chosen onpurposely nor motivated technical modifications were introduced within the cavity to generate such a beam profile of ‘arbitrary intensity profile’. But a careful monitoring of beam characteristics that was incidentally like this forced us to unbolt the laser for systematic investigation of its root cause whereby it was found that wavelength of the pumping-diode (@ 808 nm) was being converted into ideal narrow-band output via the host crystals Nd3+ : YVO4. Further, utilization of ‘arbitrary intensity profile’ for trapping assay should not be regarded, in general, as a trendsetter henceforth because properties of other arbitrary profile beams from lasers might vary from case to case.
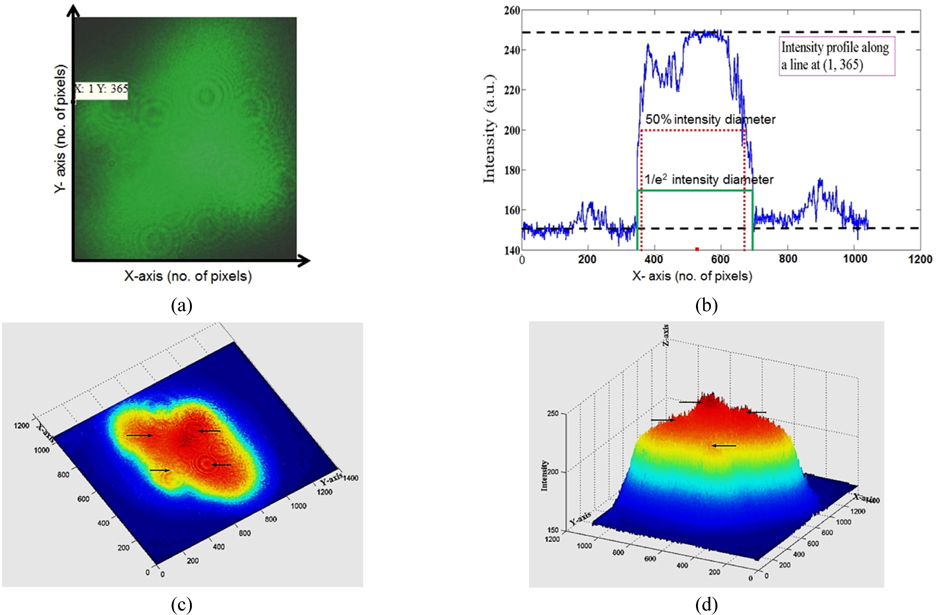
The emitted beam was captured by a CCD camera at the exit of the source as shown in Fig. 3(a). Then its intensity distribution along a line (with x, y co-ordinates inscribed in Fig. 3(a)) was computed as shown in Fig. 3(b). Top view and 3D side view are shown in Fig. 3(c, d), respectively. It is quite evident from the intensity distribution that there is another intensity peak besides the central and two additional peaks of lesser magnitude (see Fig. 3(b)). Such a non-basic Gaussian mode carries far-field divergence larger than the far-field divergence of a basic Gaussian mode provided beam waist radii are constant. Beam-divergence of the laser beam at far-field can be characterized quantitatively using the M2-parameter which has been computed for this case following the approach illustrated by Ruschin et al. [50]. The intensity profile of our beam (with blue colour) shown in Fig. 3(b) is partially similar to the rectangular and top-hat type of beam profiles as described in Ref. 50 (see Table 1 of ref. 50). M2-parameter for various beam profiles have been estimated numerically by Ruschin et al. [50]. Considering reference to these values, M2-parameter for this beam must lie between 1 and infinity (see Table 1 of Ref. 50) and is calculated to be 9.4. It is imperative to highlight that no curve fitting is implemented in intensity profile of beam shown in Fig. 3(b) during evaluation of 50% intensity drop and 1/e2 intensity drop from peak value so that actual value of M2-parameter could be retrieved.
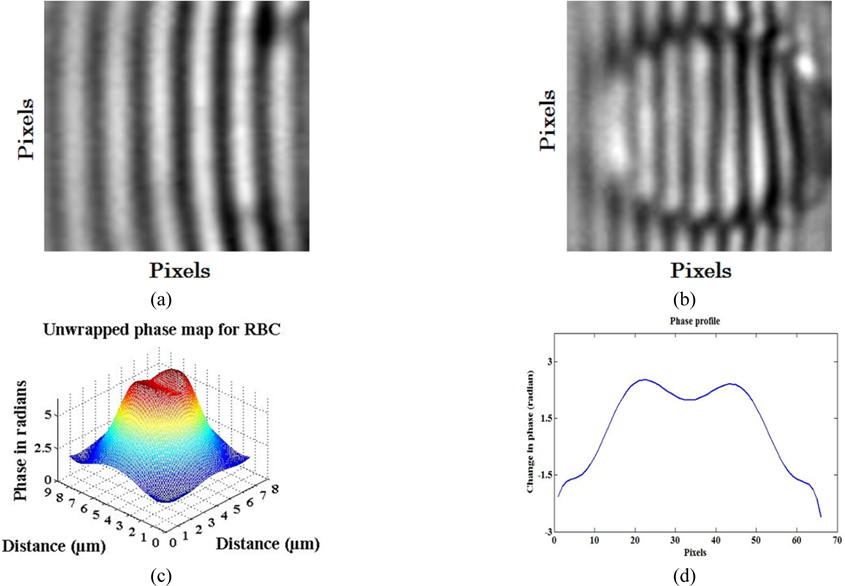
This beam was focused into a sample contained in a microfluidic channel by 60X oil-immersion MO (NA = 0.95) as shown in Fig. 4. Trapping of one RBC from a flowing sample was realized as shown in Fig. 5(d)~(g). Then an interferometric probe beam of sinusoidal intensity pattern was generated by a lab-made MMI unit as shown in Fig. 6(a) which was designed by coating one face (Y-Z plane) of a cubic beam splitter (CBS) with a thin layer (100 nm) of aluminium acting as a static mirror. The other adjacent face (X-Z plane) of the CBS was aligned against a fixed mirror mounted on an X-Y-Z micrometer stage acting as sample arm. Earlier, authors have reported patterned trapping of polystyrene spheres and linearization of floating tiny clusters of single walled carbon nanotubes using this compact and robust optical unit [51]. Probe interferograms were projected onto thus trapped RBC as shown in Fig. 6(b) and information carrying complex field reflected from RBC surface was captured at the CCD camera in a single-shot manner. The recorded interferogram is analysed by algorithms written in MATLAB and results are shown in Fig. 6(c)~(d). In this experiment, two different wavelengths; one for trapping (wavelength @ 532 nm) and other for generating probe interferograms (wavelength @ 632 nm) were focused simultaneously by the same MO (60X) which has generated automatically two focal planes longitudinally separated by ~0.34 μm by virtue of wavelength difference. Individual focal planes can be calculated by using the relation 2nλ /(NA)2 and are found to be 1.76 μm and 2.1 μm, respectively, where ‘n’ is the RI of the object space, ‘NA’ is the numerical aperture of MO. Because of two different focal depths, the trapping beam was defocused down the propagation axis for simultaneous calibration of the probe beam using two independent beam-steering optical units.
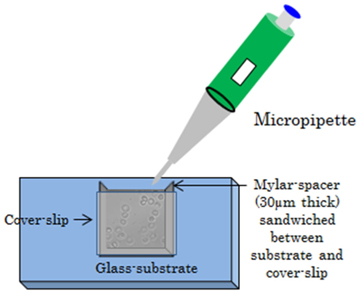
Sample channel was prepared by cleaning first the glass-substrate (Corning glass) and then coating it with 10% BSA (Bovine Serum Albumin) to make it biocompatible (shown in Fig. 4). Channel-depth of 30 μm was maintained by sandwiching the Mylar spacer (30 μm thick) on three sides of a glass-substrate and then a cover slip (Corning glass, No. 1.5) was affixed over it. Channel-depth of 30 μm is quite sufficient for tumbling of a RBC about a tangent at its circumference, i.e., maximum depth required is twice the diameter of a RBC (~8 μm). The fresh blood sample was procured from a hospital in a sterile tube containing a preservative solution of citrate, phosphate, dextrose, and adenosine (CPDA-1) which prevents blood coagulation by chelating calcium and supplies the nutrient glucose and adenosine triphosphate while maintaining a low pH. Buffer was maintained isotonic to preserve the shape memory of RBCs and was further diluted (200 times approximately) in saline water (RI=1.348) composed of NaCl (136 mM), KCI(2.68 mM) as per requirement [52]. The diluted test sample was injected into the channel by micropipette which was finally mounted on a translational stage for investigation. The trapping beam was collimated to ~6 mm width using an assembly of lenses so that it can exactly fill the back aperture of 60X oil-immersion MO (5.9 mm diameter) to retain the ‘arbitrariness’ of the trapping beam without truncation otherwise an overfilled back-aperture would truncate the geometry of the beam.
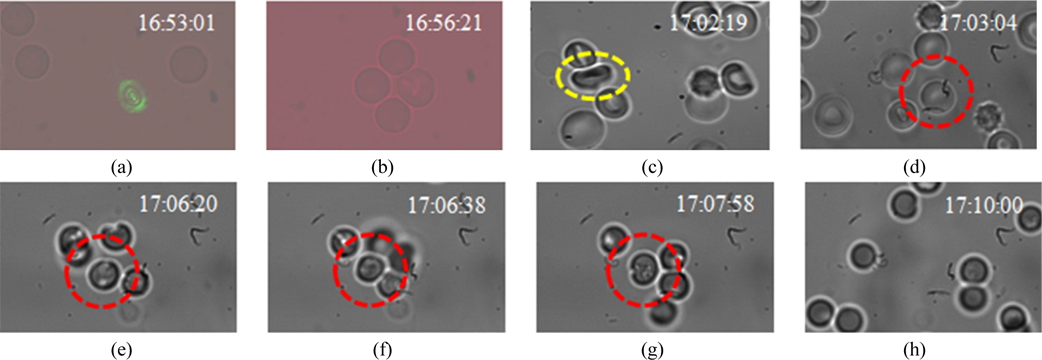
A test sample containing freely floating RBCs was imaged by 60X MO as shown in Fig. 5(d and h) and then the very same MO was used to focus the trapping beam of arbitrary intensity profile as well as probe interferograms. The exact focus spot was slightly adjusted along the propagation axis synchronising with the probe beam which was imaged by the same MO as shown in Fig. 5(a). In fact, this slightly defocused spot is the actual trapping plane which is adjusted within the channel-depth (30 μm). One of the floating RBCs (marked by the red circle in Fig. 5(d)) was targeted and trapped (Fig. 5(e~g)) when the laser beam was turned on. As the beam was turned off, trapped RBCs detached and floated away as evident from Fig. 5(h). Orientation of trapped RBCs shown in Fig. 5(b) is similar to Fig. 5(d~g) which is a snapshot extracted from multimedia S1 (1.21 GB movie) captured by a different recording camera Lumenera Infinity 2 (poor resolution) because the SANSOVATION-SamBa EZ-130 camera was capable to record only still-snapshots of good resolution (Fig. 5(c~h)). A quad of RBC in Fig. 5(b) remains trapped while other RBCs were observed moving within the sample (see multimedia S1). The behaviour of a RBC in optical trapping using Gaussian profile of laser beam has already been investigated extensively by several researchers [6-8, 53-57]. Mohanty et al. [6, 53] observed the reorientation and then rotation of RBC under optical trapping on account of shape change due to variation in the osmolality of the buffer. But Dharmadhikari et al. has observed the customary behaviour of folding (into rod shape) and unfolding of RBCs which was not observed by Mohanty et al. and concluded that it depends mainly on the power of trapping laser [7, 8, 57]. We have also observed the re-orientation behaviour of a RBC (see Fig. 5(c) marked by yellow dotted circle) which is consistent with the report by Mohanty et al. (see Fig. 2 of Ref. 6) when the very same trapping beam was tightly focused by 100X lens. No folding and unfolding was observed as invoked by Dharmadhikari et al. Similarly, we didn’t observe any photo-damage to an RBC trapped by the beam of ‘arbitrary intensity profile’ emitting at 532 nm that is further validated computationally using measured laser power at 2.25 mW on the exit of 60X objective (ED-300 OPHIR power-meter, Israel). This magnitude is very small in comparison to 60-85 mW (@ 1064 nm) recorded at the trapping plane using 100X lens by Mohanty et al. during viscous orientation torque calculation of RBC suspended in the isotonic buffer [6]. Real-time trapping mechanism of a RBC by 60X MO is depicted in Fig. (5). One of the remarkable features of the present trapping outcome is that the symmetry plane of trapped RBC is lying nearly perpendicular to beam propagation which is in sharp-contrast to all the previously available literature where RBC reshapes to bullet shape along the propagation axis to minimize its free energy [7, 8, 56, 57]. Factors affecting RBC under optical trapping at 532 nm wavelength have been addressed as below.
First, the RBC was optically trapped therefore, perturbations due to substrate-sample contact and its own weight [58-60] can be negated which is one of the advantages of this arbitrary beam in trapping.
Secondly, laser induced heating of RBCs under optical trapping depends primarily on the power density reaching to sample which is maximum if a Gaussian beam is steeply focused. But in this case, transversal distribution of beam intensity at the defocused focal plane is believed to create not a unique intensity gradient but enlarged according to the arbitrariness of beam-profile. In other words, total beam power is diffused spatially, thus creating multiple trap points in close proximity to each other that besides preventing RBC from radiation stress, maintained the radial plane of trapped RBC perpendicular to the laser direction in similar fashion as one-, two- and four-trap systems were used by G. Rusciano to trap, stretch and orient single RBCs [61]. To ascertain the magnitude of power reaching to the trapping plane, we computed it using numerical values of wavelength of trapping light (532 nm), magnification (60X), NA = 0.95 of focusing lens, spot-size of laser focus and bending elastic modulus (B = 2 × 10-19 Nm) of a normal RBC [7, 55, 62-64] and found it to be 3.65 mW. Further, laser power was experimentally measured to 2.25 mW (ED-300, OPHIR-Israel) at the exit of 60X objective. Thus both experimental and computed values of threshold power delivered to RBC under optical trapping are well within the reported value of 20 mW at 1064 nm wavelength using 100X lens by Dharmadhikari et al. [7 (p. 69)]. So the authors believe faithfully that such a low laser power reaching to RBC can hardly invoke any deleterious effects throughout a time-span (~2 min.) of the investigation following the aforementioned studies [6-8, 53-57].
Thirdly, laser induced heating of RBCs under optical trapping also depends on duration of exposure and wavelength. Approximately 2 minutes duration of laser exposure to RBC under trapping as evident from Fig. 5(e~g) can be believed to have negligible influence. Anatomically, RBCs are present in blood at a concentration of (4-6)×109 / mL with 33% of haemoglobin by volume which is the main component responsible for absorption at 532 nm. But water being the major component, laser induced heating is relatively mild for laser wavelength window 200-1100 nm where absorption by water is small as reported earlier by Tretheway et al. [65]. Further G. Rusciano performed Raman spectroscopy of trapped RBC from a physiological point of view at 532 nm wavelength yet no photo-damage was reported [61]. From the above two reports, we conclude firmly that trapping of RBC by 60X objective lens using a beam of ‘arbitrary intensity profile’ at 532 nm wavelength for a short-span of time could not generate any heating to induce photo-damage.
Finally, real-time rotation/buckling of a RBC under optical trapping is a direct signature of conversion of absorbed power. However, when the incident beam’s central axis is not aligned with the symmetry axis of RBC or RBC itself is asymmetric (crenate), free energy minimization constraint causes it to buckle/re-shape and rotates it about the axis. That is why malaria-infected/dead RBCs of asymmetric shape exhibit self-rotation under optical trapping as reported earlier [53]. It has already been proved in literature that the radiation force of the order of 1-50 piconewtons (pN) generated in Gaussian beam driven OTs is capable to deform an RBC physically without causing cell death [7 (p. 68), 55]. Scientifically, the electric field component () of the laser beam tries to induce a dipole moment into the RBC according to the relation P = α × E, where α is the polarizability tensor of the RBC. But owing to the intrinsic asymmetry of the RBC, polarizability components parallel and perpendicular to RBC axis (αII and α respectively) are significantly different from each other which causes light-induced torque generation τ = P × E. However, energy minimization constraint forces the RBC to reshape to a bullet and align along the direction of beam propagation [8, 56]. According to the above relation, generated torque is equal to the product of the polarizability tensor and square of the electric field which in turn translates to time-average beam intensity (trapping power). But the above torque relation is not applicable here for rotationally asymmetric beam of ‘arbitrary profile’ because now the E-field is a complex tensor quantity fully described by Maxwell’s Stress tensor which will provide radiation pressure force and torque [66-69]. More pedagogic theoretical description characterizing every electromagnetic field of arbitrary profile and arbitrary orientation, and hence the estimation of radiation pressure force and torque on spheroidal particles using a set of respective beam shape coefficients (BSCs) under generalized Lorentz-Mie theory (GLMT) can be found elsewhere [70-79]. Re-shaping of RBCs to bullet shape was not observed in this case as recorded power at the exit of 60X MO was moderate (2.25 mW). But as the magnification of MO is changed from 60X to 100X keeping beam power unchanged, the fluence reaching to the trapping plane increases causing re-shaping of RBC to bullet shape which is evident from Fig. 5(c). In short, the word ‘arbitrary profile’ and its electrodynamics in OTs is confined to the current laser beam only and can be generalized following aforementioned theoretical computation [66-79]. In-depth illustration characterising the arbitrary profile beam is itself a separate full-fledged research domain which is underway.
Now, to obtain the phase-map of each pixel, probe interferograms reflected from a trapped RBC were captured at a CCD camera and analysed by algorithms written in MATLAB. No reflection can occur from the intermediate cytoplasmic medium because it is transparent for visible wavelength of probe light (632 nm) thereby assuming no wavefront aberration from phase object (RBC) [80]. Total OPD between two co-propagating reflected interferograms: one from the top surface and other from the bottom surface of RBC (after transmission from the top surface) is twice the thickness of discotic RBC (0.9 μm - 2.5 μm) i.e., 1.8 μm - 5μm. Therefore, phase-change must appear significant beyond the 3rd position of the decimal following Eq. (5) because probe wavelength (632 nm) is three orders less than the physical thickness variation of the RBC (1.8 μm - 5 μm.). In this case, we are considering the reflection of probe interferogram from the bilayer surface of the RBC which remains invariant untill the pathophysiological state changes. However, such a large fluctuation in OPD between two reflected interferograms (1.8 μm - 5 μm.) is well within the coherence length of trapping laser (10 μm) therefore interference will essentially take place. At the same time weak reflection (~4%) of the probe interferogram from glass-substrate cannot be ruled out. But taking into account the location of a trapped RBC lying anywhere in the middle of 30 μm channel depth, the OPD between glass-substrate and bottom surface of a trapped RBC is far greater than the coherence length of source and therefore no interference can take place. Phase-map along the diameter of an RBC is computed by avoiding the linear phase by proper alignment of the set-up as shown in Fig. 6(c) which depicts the biconcave shape of the upper surface of RBC. One dimensional phase-profile of RBC along its diameter is computed and shown in Fig. 6(d) where a variation in phase-profile values can be seen which is due to different constituents present within RBC. To validate our phase-imaging study statistically, several experimental results of simultaneous trapping and projection of the probe interferogram must be recorded. However, in this case, it could be made feasible either by trapping various RBCs from a single beam optical trap at various time lengths and then recording the respective interferograms or multiple trap centers must be realized at a time to trap various RBCs by enlarging the area of the probe interferogram. In the former case, a somewhat longer period of experiment is needed to cover various RBCs one by one for statistical analysis. But in the latter case, a collimated trapping beam of homogeneous transversal intensity must be projected on a diffractive optical element to realize multiple trap centers with equal trap stiffness which is not possible in the present case as the trapping beam contains transversal inhomogeneity in intensity distribution. Following the first case, we had recorded a few experimental observations for different RBCs of the same sample and one of the best results is shown in Fig. 5 with its analysis in Fig. 6. We analysed these sets of observations and obtained maximum fluctuation in estimated phase of the order of ± 0.1 radian (in Fig. 6(c)) at the wall of the RBC.
The spatial nature of the laser beam of ‘arbitrary intensity profile’ generated by cavity itself due to cumulative effects of both the misalignment of optics and inhomogeneity of active material (KTP) has been utilized for photodamage-free trapping of RBCs. The advantage to utilize such beams in OTs is to investigate the role of low-cost laser sources (defective) whereby beam quality factor does not play a significant role. The implicit repercussion of receiving noninevitable alterations in innate morphology of RBCs due to their own weight when adhered to glass substrate in interferometric phase-microscopy schemes, has been obviated here. Thus trapped RBC was probed with sinusoidal interferograms generated by lab-made Michelson interferometer and the phase-map was evaluated using the Hilbert transform fringe analysis technique from recorded single-shot reflected interferograms. In conclusion, a cost-effective and label-free phase-imaging modality of trapped RBC has been reported. Efficient reflective coating on a cubic beam-splitter to generate probe interferograms of good quality and assimilation of technically updated diode lasers making the system inexpensive can be regarded as an improved version of phase-imaging platform in the future.