검색 전체 메뉴
PDF
맨 위로
OA 학술지
Coherence Studies of Photons Emitted from a Single Terrylene Molecule Using Michelson and Young’s Interferometers
  • 비영리 CC BY-NC
  • 비영리 CC BY-NC
ABSTRACT
Coherence Studies of Photons Emitted from a Single Terrylene Molecule Using Michelson and Young’s Interferometers
KEYWORD
Coherence length , Single photon source , Interferometry
  • I. INTRODUCTION

    An on-demand single photon source is an essential ingredient for the successful realization of many quantum optical applications likes quantum cryptography, computing, imaging, and metrology [1-3]. Photons from solid state single emitters, such as single molecules, quantum dots, and diamond color centers, are considered to be promising candidates as high-quality ‘on-demand’ single photon sources because of their good photo-stability and high controllability [1-4]. Different properties of single photons are required for different applications. For an example, quantum information processing requires photons to be indistinguishable with long quantum coherence times [5]. In contrast, optical coherence tomography (OCT) requires shorter coherence lengths in order to obtain better imaging depth resolution. OCT has been developed based on classical broad-band sources [6, 7], and quantum OCT has also been demonstrated [8]. The coherence of light sources plays a key role in many optical applications (e.g., the examples mentioned above); therefore, it is important to correctly characterize the coherence properties of a light source.

    Several different methodologies have been used in coherence studies that have investigated many different types of light sources (including single photon sources) [9-12]. To date, the Michelson interferometer (MI) has been most widely used in temporal coherence studies because the temporal coherence length can be obtained directly from the decay constant of its interference oscillation amplitude. We also use MI as a test bench of the temporal coherence length measurement of single photons and compare these results with those obtained from Young’s double interferometer (YDI). In our measurements, MI showed an inherent dispersion broadening, which caused a distortion in the interference pattern. Therefore, we applied a simple dispersion compensation in order to systematically remove this problem.

    Since the triumphant success of Thomas Young more than 200 years ago, YDI has been applied to the proof of principle demonstrations of interference [13, 14], and to spatial coherence studies [15]. However, researchers have been reluctant to use YDI in temporal coherence studies because the fast-decaying diffraction signal conceals the interference features at long delays. For a broad-band source, however, its coherence length can be short enough to be characterized by YDI. In addition, there is no distortion in the interference signal which might appear in MI as mentioned earlier. In this study, we show that the temporal coherence length of single photons from single molecules at room temperature can be measured with high accuracy using YDI. The measured coherence lengths in the two systems are consistent with one another under the self-interference interpretations. [13].

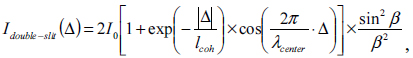
    II. DISPERSION CALIBRATION IN A MICHELSON INTERFEROMETER (MI)

    A basic diagram of MI is shown in Fig. 1(a). Here, the source beam is divided by a 50/50 beam splitter (BS) into two paths – the reference path and the signal path. The optical path length difference Δ between the two beam paths is controlled by a piezo-tube (PZT). If the reference and the signal beams travel the same length inside of the dispersive media, the interference pattern is given to be symmetric to the zero delay Δ = 0. However if the two beams travel different distances inside a cube-type BS (as happens in our case) and the material (BK7) of the BS is dispersive as shown in Fig. 1(b), the interference pattern appears to be asymmetric (Fig. 1(c)). To compensate for this dispersive broadening, two glass slides are inserted with different tilting angles, as depicted in Fig. 1(a). A broadband halogen lamp is used in this proof of principle demonstration. The refractive index of the glass slide (soda lime) is different from that of BS (BK7) but is shifted almost constantly within the considered wavelength range. At θ = 47 degrees, the symmetric shape can be recovered, and the original roundtrip travelling length difference between the two beams inside the BS is calculated to be 240 μm. Note that the reduced visibility at zero delay in (d) compared to (c) is due to the unbalanced field intensity caused by different reflection losses at the glass slide surface for the two paths.

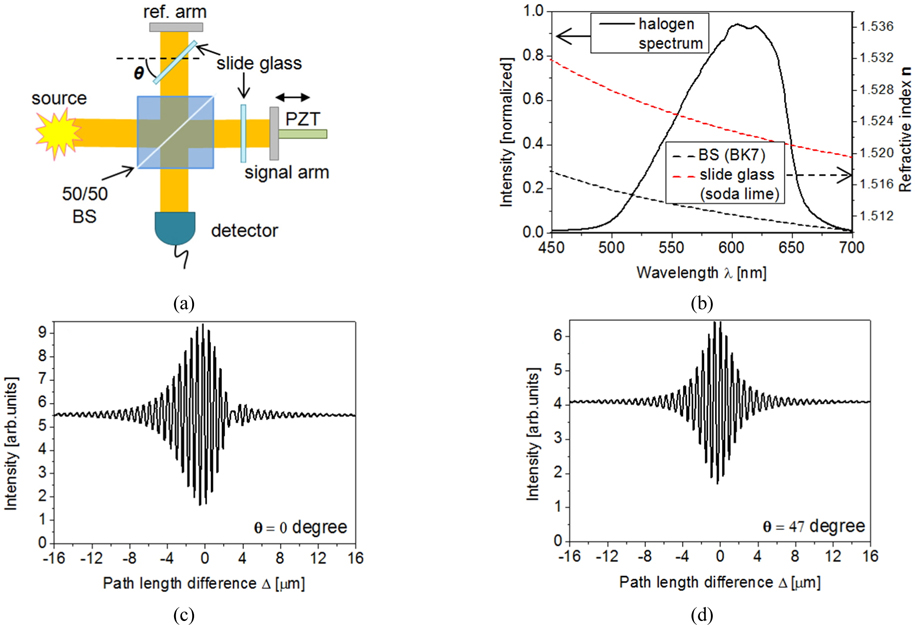
    III. COHERENCE OF A SINGLE PHOTON SOURCE MEASURED BY MI

    In the next step, we use this dispersion calibrated MI to investigate the coherence characteristics of photons from single terrylene molecules. Figure 2(a) shows the experimental schematics. A thin para-terphenyl crystal layer with embedded single terrylene molecules is generated on a cover glass via spin-coating. A p-polarized 532 nm cw-mode laser is coupled through a high numerical aperture oil-objective (NA = 1.4) in a total internal reflection geometry to efficiently excite molecules, which are aligned almost vertically to the sample surface [16]. Fluorescence from the molecules collected by the same objective is passed through a spatial mask to remove the background, and then sent to the spectrometer, the Hanbury-Brown & Twiss (HBT) interferometer (used to measure the second-order correlation function g(2)(τ)), and MI. The black line in Fig. 2(b) shows the emission spectrum of a terrylene molecule. All of the measurements are performed at room temperature; therefore, the spectrum is phonon-broadened, and two vibronic level peaks are clearly visible. To check that detected photons are emitted from a single molecule, the second-order correlation function g(2)(τ) is measured by the HBT interferometer. As shown in Fig. 2(c), the measured value of g(2)(τ=0)=0.14 clearly demonstrates the single photon nature of our source [1]. This non-zero dip is attributed to the small background level and its portion is about 7% in this case [17]. The contribution of the backgrounds can be systematically removed both in second-order correlation measurements [17] and in first-order correlation measurements. The black line in Fig. 2(d) is the interference pattern obtained by the dispersioncalibrated MI. The overall shape is almost symmetric, which is expected. Additionally, the beating shapes caused by the two vibronic spectral peaks are clearly seen.

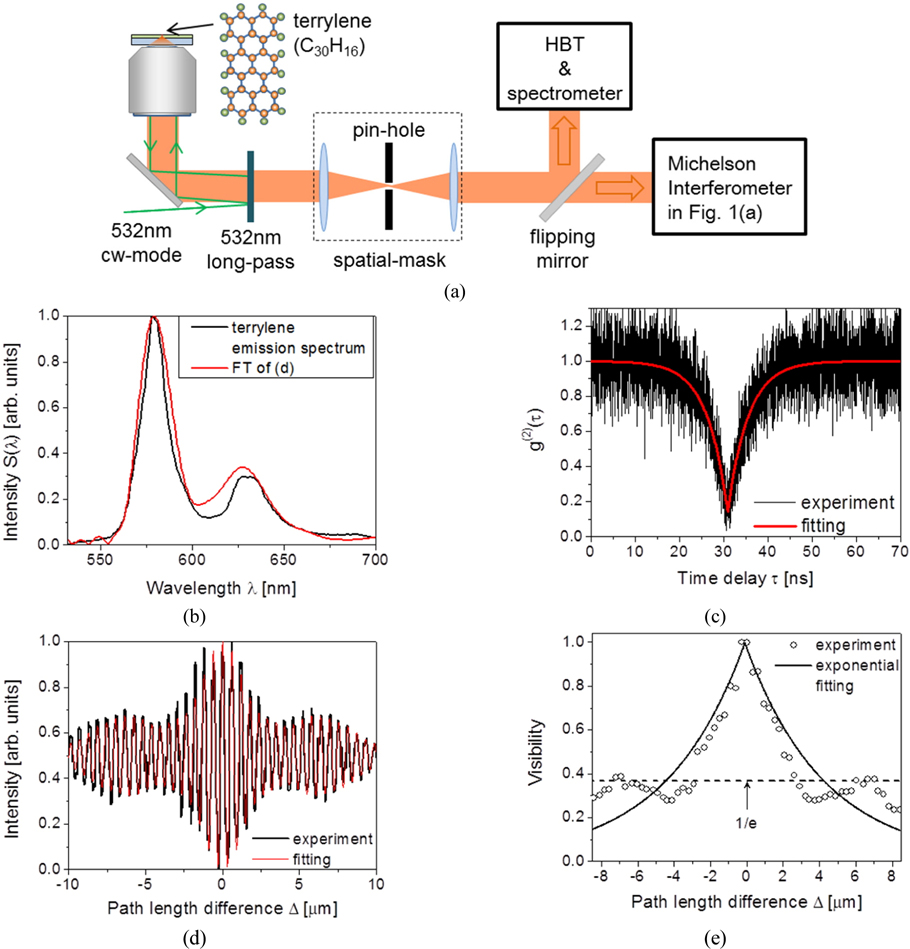
    The total interference pattern of single photons is given as the sum of the self-interference. Therefore, the fitting function can be written simply as follows
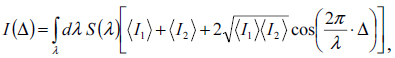
    image

    where 〈 I1 〉 and 〈 I2 〉 are the mean photon number averaged for a suitably long time in the reference and signal paths, respectively. In addition, S(λ) is the intensity spectrum shown in Fig. 2(b). The fitting curve (red in Fig. 2(d)) matches very well with the experiment. Because the total interference pattern is the sum of the self-interference at each wavelength, its Fourier transform (FT) gives the spectral shape of the light source. It is plausible that the FT of the measured interference pattern (black in (d)) recovers the original spectrum of the terrylene (red line in Fig. 2(b)). Finally, in Fig. 2(e), in order to estimate the coherence length of this single photon source, the visibility is derived from the interference pattern and fitted with a decaying single-exponential to give the coherence length (lcoh = 4.36 ± 0.20 μm). The error comes from the uncertainty in the fitting process.

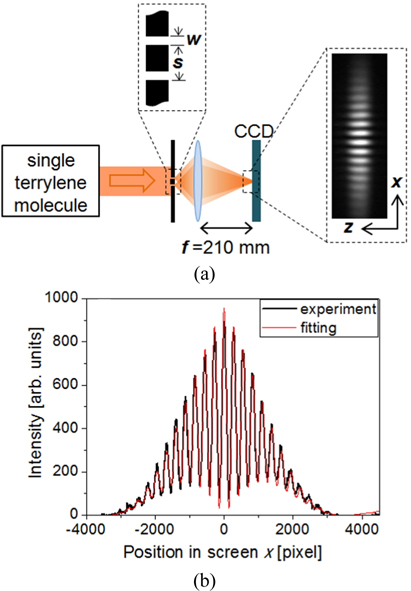
    IV. TEMPORAL COHERENCE ANALYSIS OF SINGLE PHOTONS BY YOUNG'S INTERFEROMETER

    The experimental setup used to generate a well-collimated single photon stream is the same as the one shown in Fig. 2(a). The double-slit interferometer is illustrated separately in Fig. 3(a). Two parallel slits with an opening width w and separation s are made in a thin (12.5 μm) metallic film. The interference pattern formed by the double-slit is imaged into a small area by a focusing lens in order to increase the signal quality. The image captured by a high sensitivity CCD camera (ORCA-R2, Hamamatsu) is shown in the inset of Fig. 3(a). To obtain the interference intensity as a function of the optical path length, the pixel counts are integrated along the z-axis for each x-position, as shown in Fig. 3(b). In the fitting function, we assume a single-exponential decay of the interference visibility combined with the single-slit diffraction:

    image

    where, , w=40 μm, s=500 μm and I0 and lcoh are the two free fitting parameters. The fitting curve (red in Fig. 3(b)) successfully reconstructs the experimental curve (black). Note that the position in screen x is determined by the relation of , where f (=210 mm) is the focal length of the lens. The fast decay of the interference visibility can be characterized by virtue of the short coherence length. We performed the same measurements for six different molecules and obtained a coherence length lcoh of 4.45 ± 0.23 μm. The discrepancy of the coherence length compared to MI is only ~2%. The total acquiring time for YDI is 10~30 min, depending on the brightness of the molecules, and the quantum efficiency of the CCD camera that we used is about 60%. The detector in MI has a quantum efficiency of ~65% and the total measurement time is about 10~20 min. Therefore, the two systems require similar acquisition times.

    V. CONCLUSION

    We studied the temporal coherence of photons emitted from single molecules by applying two different interferometers - MI and YDI. The coherence lengths can be determined with high accuracy by both systems, and the theory based on the self-interference matches very well with the experimental results. When comparing the two interferometers, MI gave more detailed features in the interference pattern (e.g., the beating shape) but a dispersion-related distortion in the interference pattern needs to be corrected. Alternatively, YDI has a rather simple configuration, which allows for an easy adjustment, and does not require dispersion correction. However, it was not possible to see the details in the interference pattern of YDI as compared to MI.

참고문헌
  • 1. Scheel S (2009) “Single-photon sources - an introduction,” [J. Mod. Opt.] Vol.56 P.141-160 google cross ref
  • 2. Lounis B, Orrit M (2005) “Single-photon sources,” [Rep. Prog.Phys.] Vol.68 P.1129-1179 google cross ref
  • 3. Aharonovich I, Castelletto S, Simpson D. A, Su C.-H, Greentree A. D, Prawer S (2011) “Diamond-based single-photon emitters,” [Rep. Prog. Phys.] Vol.74 P.076501 google cross ref
  • 4. Kurtsiefer C, Mayer S, Zarda P, Weinfurter H (2000) “Stable solid-state source of single photons,” [Phys. Rev. Lett.] Vol.85 P.290-293 google cross ref
  • 5. Gazzano O, de Vasconcellos S. M, Arnold C, Nowak A, Galopin E, Sagnes I, Lanco L, Lemaitre A, Senellart P (2013) “Bright solid-state sources of indistinguishable single photons,” [Nat. Commun.] Vol.4 P.1425-1425 google cross ref
  • 6. Huang D, Swanson E. A, Lin C. P, Schuman J. S, Stinson W. G, Chang W, Hee M. R, Flotte T, Gregory K, Puliafito C. A, Fujimoto J. G (1991) “Optical coherence tomography,” [Science] Vol.254 P.1178-1181 google cross ref
  • 7. Schmitt J. M (1999) “Optical coherence tomography (OCT): A review,” [IEEE J. Select. Topics Quantum Electron.] Vol.5 P.1205-1215 google cross ref
  • 8. Nasr M. B, Saleh B. E. A, Sergienko A. V, Teich M. C (2003) “Demonstration of dispersion-canceled quantum-optical coherence tomography,” [Phys. Rev. Lett.] Vol.91 P.083601 google cross ref
  • 9. Jelezko F, Volkmer A, Popa I, Rebane K. K, Wrachtrup J (2003) “Coherence length of photons from a single quantum system,” [Phys. Rev. A] Vol.67 P.041802 google cross ref
  • 10. Jacques V, Wu E, Toury T, Treussart F, Aspect A, Grangier P, Roch J.-F (2005) “Single-photon wavefront-splitting interference,” [Eur. Phys. J. D] Vol.35 P.561-565 google cross ref
  • 11. Marshall G. D, Gaebel T, Matthews J. C. F, Enderlein J, O'Brien J. L, Rabeau J. R (2011) “Coherence properties of a single dipole emitter in diamond,” [New J. Phys.] Vol.13 P.055016 google cross ref
  • 12. Korlacki R, Steiner M, Qian H, Hartschuh A, Meixner A. J (2007) “Optical fourier transform spectroscopy of single-walled carbon nanotubes and single molecules,” [Chem. Phys.Chem.] Vol.8 P.1049-1055 google
  • 13. Mandel L (1999) “Quantum effects in one-photon and two-photon interference,” [Rev. Mod. Phys] Vol.71 P.S274-S282 google cross ref
  • 14. Ph L, Schmidt H, Schossler S, Afaneh F, Schoffler M, Stiebing K. E, Schmidt-Bocking H, Dorner R (2008) “Young-type interference in collisions between hydrogen molecular ions and helium,” [Phys. Rev. Lett.] Vol.101 P.173202 google cross ref
  • 15. Santarsiero M, Borghi R (2006) “Measuring spatial coherence by using a reversed-wavefront Young interferometer,” [Opt. Lett.] Vol.31 P.861-863 google cross ref
  • 16. Pfab R. J, Zimmermann J, Hettich C, Gerhardt I, Renn A, Sandoghdar V (2004) “Aligned terrylene molecules in a spin-coated ultrathin crystalline film of p-terphenyl,” [Chem.Phys. Lett.] Vol.387 P.490-495 google cross ref
  • 17. Lee K. G (2014) “Statistical analysis of photons from a single terrylene molecule for the study of the energy level scheme,” [J. Korean Phys. Soc.] Vol.64 P.1792-1796 google cross ref
OAK XML 통계
이미지 / 테이블
  • [ FIG. 1. ]  (a) Dispersion compensation in MI. Two glass slides with different tilting angles are inserted to compensate for the dispersion broadening caused by the BS. (b) Spectrum of the source halogen lamp (black solid) and refractive indices of the BS (black dashed) and the glass slide (red dashed). (c) Measured interference pattern with a tilting angle θ=0 degrees. (d) Symmetric shape is recovered at θ=47 degrees.
    (a) Dispersion compensation in MI. Two glass slides with different tilting angles are inserted to compensate for the dispersion broadening caused by the BS. (b) Spectrum of the source halogen lamp (black solid) and refractive indices of the BS (black dashed) and the glass slide (red dashed). (c) Measured interference pattern with a tilting angle θ=0 degrees. (d) Symmetric shape is recovered at θ=47 degrees.
  • [ FIG. 2. ]  (a) Experimental schematics. Photons from a single terrylene molecule are sent to MI (shown in Fig. 1(a)), the Hanbury-Brown & Twiss (HBT) interferometer, and the spectrometer. A spatial mask is used to cut the backgrounds out of the signal. (b) The black line is the terrylene emission spectrum measured by the spectrometer, and the red line is the inverse Fourier transform of the interference pattern in (d). (c) Second-order correlation function g(2)(τ) measured by the HBT interferometer. An exponential fitting is shown in red. (d) Measured interference pattern (black), and the fitting based on the self-interference (red). (e) Visibility derived from the interference pattern (open circles), and an exponential fitting (black solid).
    (a) Experimental schematics. Photons from a single terrylene molecule are sent to MI (shown in Fig. 1(a)), the Hanbury-Brown & Twiss (HBT) interferometer, and the spectrometer. A spatial mask is used to cut the backgrounds out of the signal. (b) The black line is the terrylene emission spectrum measured by the spectrometer, and the red line is the inverse Fourier transform of the interference pattern in (d). (c) Second-order correlation function g(2)(τ) measured by the HBT interferometer. An exponential fitting is shown in red. (d) Measured interference pattern (black), and the fitting based on the self-interference (red). (e) Visibility derived from the interference pattern (open circles), and an exponential fitting (black solid).
  • [ ] 
  • [ FIG. 3. ]  A collimated beam of photons from a single terrylene molecule is sent to a double-slit with a slit-width of w = 40 μm and a slit-separation of s = 500 μm. The interference pattern in the CCD screen is shown in the inset. (b) Interference intensity integrated along the z-axis (black), and a fitting function that assumes single exponential decay (red).
    A collimated beam of photons from a single terrylene molecule is sent to a double-slit with a slit-width of w = 40 μm and a slit-separation of s = 500 μm. The interference pattern in the CCD screen is shown in the inset. (b) Interference intensity integrated along the z-axis (black), and a fitting function that assumes single exponential decay (red).
  • [ ] 
(우)06579 서울시 서초구 반포대로 201(반포동)
Tel. 02-537-6389 | Fax. 02-590-0571 | 문의 : oak2014@korea.kr
Copyright(c) National Library of Korea. All rights reserved.