TiO2 is one of the most widely used ceramic oxides in various applications, such as in pigments, cosmetics, fillers, photocatalysts, and dye sensitized solar-cells [1]. TiO2 has interesting properties such as brightness, high reflective index, and strong UV light absorbing capabilities. The particle size, particle size distribution, and particle morphology of TiO2is an important factor which affects properties of the materials in application and can be varied by different preparing methods [2]. Recently, TiO2 quantum dots have attracted much attention as TiO2 anode materials in lithium ion batteries due to high activity which stems from large surface area [3-5].
Various preparation methods, such as the sol-gel method [6], hydrothermal method [7], and solvothermal method [8], are known in synthesizing nano-sized TiO2. In this study, we synthesized TiO2 quantum dots by hydrothermal method after precipitating TiO2 by dropping Ti(SO4)2 solution into NaOH solution. Prepared TiO2 quantum dots were characterized using UV/Vis/NIR Spectrophotometer, X-ray diffractometer, and transmission electron microscopy (TEM).
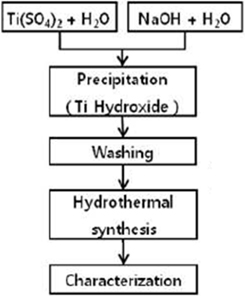
TiO2 quantum dots were prepared as shown in Fig. 1.
Briefly, Ti(SO4)2 solution was prepared by diluting Ti(SO4)2 solution (Kanto Chemical, reagent grade) with distilled water. NaOH solution with OH- concentration of 6 times of Ti4+ ion concentration of Ti(SO4)2 solution was prepared by dissolving NaOH (Sigma Aldrich, 98% purity) in distilled water. Ti(SO4)2 solution was dropped into NaOH solution while stirring the solution. Prepared pH of NaOH solution was 13.7. And with the assumption of precipitates were Ti(OH)4, final pH of the mixed precipitated solution was 12.8. After precipitation, the resulting slurry was stored undisturbed until precipitates separated from solution of remaining ions of Na+ and SO42-. Then, the supernatant above the precipitates was removed. This procedure was repeated several times to completely remove Na+ and SO42- ions. The resulting washed precipitated precursor slurry solution was transferred to the hydrothermal apparatus built in the laboratory. The solution was hydrothermalized at temperatures 100℃, 130℃, and 160℃ for 24 hours. Hydrothermally synthesized TiO2 quantum dots were characterized using UV/Vis/NIR Spectrophotometer (Hitachi, U-4100), X-ray diffractometer (Bruker, D8 Advance), and transmission electron microscopy (Jeol, JEM2010).
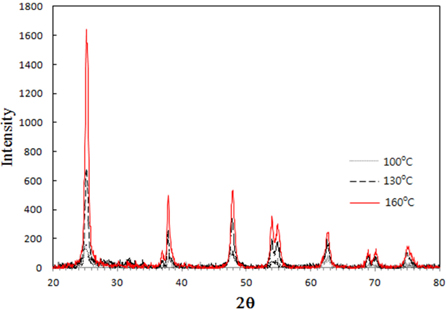
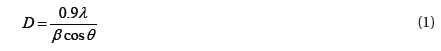
Figure 2 shows the XRD spectra of the TiO2 quantum dots prepared by hydrothermal method at temperatures 100℃, 130℃, and 160℃. The phase of the TiO2 quantum dots was shown to be anatase (JCPDS #89-4921). Crystalline TiO2 quantum dots can be synthesized even at temperatures as low as 100℃. As the hydrothermal temperature increases, crystallinity increases steadily. The average crystalline size of the TiO2 powder were obtained (Table 1) from the half-width of the full maximum (HWFM) of the most intense peak of (101) plane using the Scherrer equation given by Eq. (1):

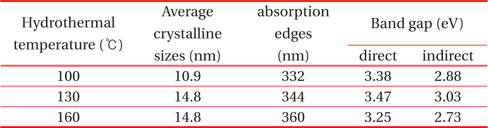
Calculated average crystalline sizes, absorption edge, and direct and indirect band gap of TiO2 quantum dots prepared at hydrothermal temperatures of 100℃, 130℃, and 160℃.
where
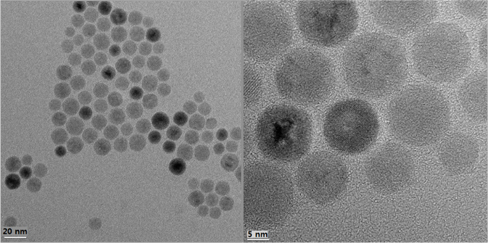
Figure 3 shows the TEM image of the TiO2 quantum dots prepared at hydrothermal temperature of 160℃ for 24 hours. The particles were observed to be very small size, around 15nm, which is fairly consistent with calculated average crystalline size from XRD data. Nearly identical crystalline size between TEM and XRD are considered due to the almost uniform size of the TiO2 quantum dots prepared by hydrothermal method. Notably, the hydrothermally prepared TiO2 quantum dots showed no agglomeration of the TiO2 powders. Due to the non-aggregated nature of the TiO2 powders, the TiO2 slurries of quantum dots did not fall out of suspension for extended periods of time (over one month of observation).
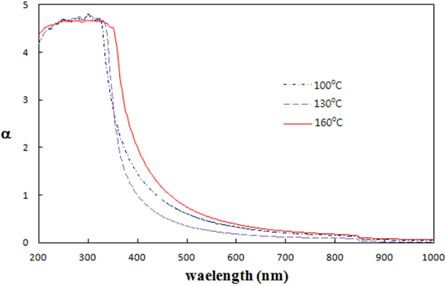
Figure 4 shows the absorption spectra of TiO2 quantum dots prepared at temperatures 100℃, 130℃, and 160℃.
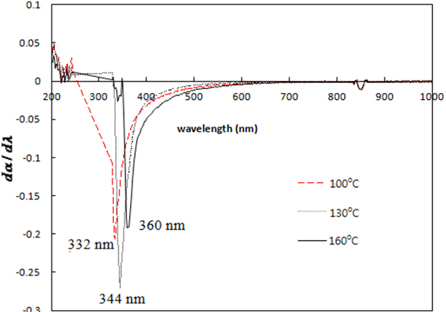
Inflection points of absorption spectra are strong absorption edges which can be obtained by differentiating the absorption spectra.
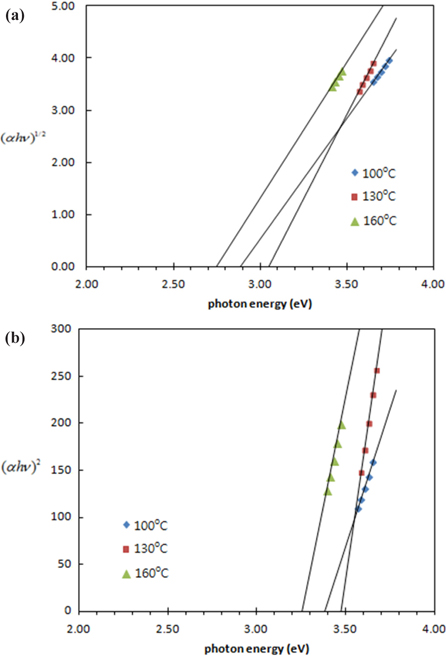
Strong absorption edges obtained from Fig. 5 are tabulated in Table 1. The band gaps of the TiO2 quantum dots were obtained using the Kebelka-Munk function. Figure 6 shows the plot of (
Although the crystal size and band gaps did not show any temperature dependence (Table 1), the crystallinity increases as the hydrothermal temperature increases. Heat treatment in the liquid state seems to be different with that of solid state heat treatment for particle size variation and needs to be studied further.
Anatase phase TiO2 quantum dots with nearly uniform size 15nm and complete crystallinity were prepared by a hydrothermal method. The TiO2 quantum dots had no agglomeration and completely spherical shapes. The TiO2 quantum dots can be synthesized at temperatures as low as 100℃.