The metal oxide varistor (MOV) is a major component of the surge protection devices (SPDs) currently in use. The device is judged to be faulty when fatigue caused by the continuous inflow of lightning accumulates and reaches the damage limit. In many cases, induced lightning resulting from lightning strikes flows in to the device several times per second in succession. Therefore, the frequency or the rate at which the SPD is actually exposed to stress, called a surge, is outside the range of human perception. For this reason, the protective device should be replaced if it actually approaches the end of its life even though it is not faulty at present, currently no basis exists for making the judgment of remaining lifetime. Up to now, the life of an MOV has been predicted solely based on the number of inflow surges, irrespective of the magnitude of the surge current or the amount of energy that has flowed through the device. In this study, nonlinear data that shows the damage to an MOV depending on the count of surge and the amount of input current were collected through a high-voltage test. Then, a failure prediction algorithm was proposed by preparing a look-up table using the results of the test. The proposed method was experimentally verified using an impulse surge generator
The metal oxide varistor (MOV) is a major component of the surge protective devices (SPDs), and becomes faulty when fatigue caused by the continuous inflow of lightning accumulates and reaches the damage limit. In general, inductive lightning resulting from lightning flows to the device several times per second consecutively. Therefore, the frequency at which an SPD is actually exposed to a surge is high, and the types of exposure are more diverse than previously thought. The protective device should be replaced if actually approaching the end of life, even though it is not faulty at present, there is currently no basis for making the judgment of the remaining lifetime. Although there are some methods that determine the failure rate using leakage current or the count of surge, leakage current is difficult to measure and count of surge is inaccurate because the amount of energy varies with each surge inflow. Accordingly, a system that can identify the cause of failure of an SPD is required. Once the cause is known, the failure rate can be predicted in real time by securing and analyzing the data of the MOV [1-3]. In addition, the regulation related to lightning protection of buildings has been revised to KS C IEC 62305, in accordance with WTO convention. Although installation of an SPD--an internal lightning protection device that was a mere option in the past--has become mandatory, at present there is no surge protector suitable for digital equipment [4].
Failures of a surge protector can be classified into failures of the MOV, the fuse, the semiconductor device, and the printed circuit board (PCB), as well as other faults, such as those in the outer case, short-circuited wires, or mechanical defects. However, the reliability of PCBs, fuses, and other devices in an SPD can be secured through sufficient quality control protocols before they are shipped by the manufacturer. Accordingly, the problems caused by changes in these devices during the use of the product can be identified visually or by instrumentation; however, it is impossible to identify the condition of an MOV visually or by measurement. Therefore, the failure of an SPD can be presumed to be a failure of the MOV, and damage to the MOV can be selected as the major cause for failure of the SPD [5-8].
A nonlinear look-up table was prepared by experimentally verifying the relationship between the amount of inflow energy and the damage limit of the surge. Based on this relationship, an algorithm to predict the failure rate of MOVs was established. A life test of an MOV, a major cause for the failure of a surge protector, was repeatedly carried out using an 8/20 [μs] surge wave. The nonlinear relationship between the size and the count of the surge was examined. The amount of energy that flows into the MOV is defined. The amount of energy that flows into the MOV was defined to determine the failure rate and verified.
2. FAILURE RATE PREDICTION ALGORITHM
2.1 Characteristics and failure types of MOVs
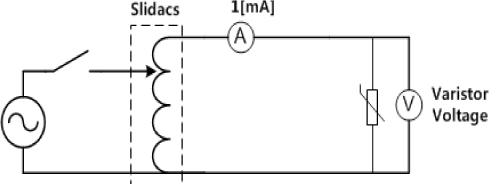
In an MOV, there is an electrode at each end and inside each end is ZnO particles, as shown in Fig. 1. The average number of ZnO particles between the two electrodes is an important factor that determines the voltage of the MOV. The MOV is connected in parallel to the equipment or circuit it is meant to protect, preventing the voltage from increasing further by forming a low-resistance circuit when excessive voltage occurs. If the thickness of the MOV is increased twofold, twice as many micro-MOVs are connected in series and increasing the protection level by two-fold. In addition, if the area of the product is increased twofold, the current path increases twofold and doubles the tolerated value of the surge current because they are connected in parallel.
In existing surge protectors, it is impossible to determine the damage and failure due to nonlinear characteristics. For example, the insulation property changes very slowly in the MOV, and degenerates rapidly at the moment the surge limit of the device is reached after exposure to a surge.
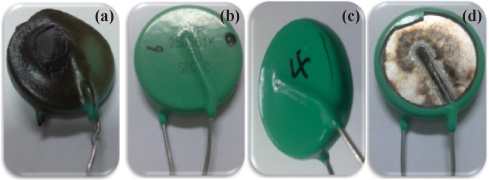
An MOV, made of a mixture of 90% zinc oxide and 10% additives, has excellent insulation performance and very high resistance below the critical voltage, and becomes conductive above the critical voltage as the resistance rapidly drops. MOV is the most stable device for suppressing surge because of its superior clamping property and is used in most surge protectors. Damage to an MOV can be classified as thermal runaway, puncture, crack, or epoxy breakaway, based on its appearance, as shown in Fig. 2.
2.2 Calculation of lightning stroke current and energy inflow
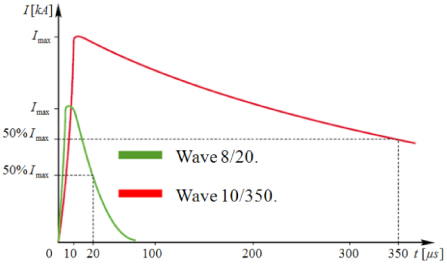
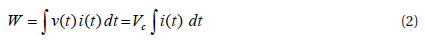
An experiment was repeated many times to measure the count of the surge before the damage limit was reached and depending on the amount of energy flowing into the MOV. A 100% failure rate was set by measuring the energy and the count immediately before the MOV was damaged. In addition, from the results of the experiments, the failure rate was defined for each count, depending on the amount of energy at which time the nonlinear look-up table obtained through the experiment was used. If the proposed method is applied to a product, the failure rate and the remaining life can be predicted even when a random-size surge flows into the surge protector a random number of times. This can reduce the number of malfunctions and increase the reliability of the surge protector by allowing the user know the replacement time. In the future, studies need to be performed to define the failure rate, even during a continuous surge flows and for random surge waveforms by reflecting the temperature of the device and the leakage current. In KS C IEC 61643, the lightning stroke current appears as the standard waveform shown in Fig. 3, and is defined as shown in (1). Moreover, if this current flows into the MOV, the energy inflow is as shown in (2). An 8/20 waveform is a current waveform in which it takes 8 μs for the current to rise from 10% on the impulse rising curve to 90% of the maximum current value, and 20 μs for it to reach 50% of the maximum value on the falling curve, and a 10/350 waveform has the same meaning.
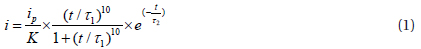
Here,
ip : Peak current of the waveforms K : Peak current calibration factor (ip ≥100:0.93, ip ≤100:0.993) t : Time τ1 : Wave front time τ2 : Wave tail time
Here
2.3 Implementation of algorithm through limit test
Since the performance of a surge protector in relation to damage and failure is dependent on the MOV, the time-to-failure caused by a surge current was determined by a limit test. The remaining life, or the failure rate, can be diagnosed by setting the energy flowing into the MOV immediately before the damage or failure during the maximum current, to 100%. Based on the maximum energy among the performance indicators of an MOV and measuring the point in time at which the device is damaged, indicated by when current is lower than that what is flowing in, the rate of which the energy inflow can be calculated.
To examine the point in time at which the MOV is damaged, an 8/20 μs surge current is generated and the condition of the MOV is analyzed using an impulse current generator and an impulse current test device.
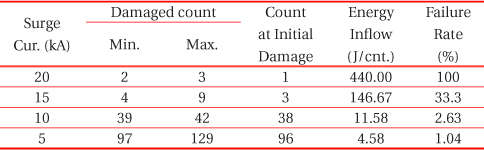
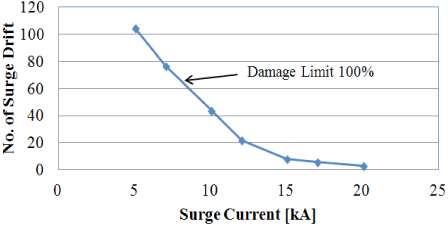
For example, a tested device’s maximum energy is 440 [J], according to the performance indicator obtained from the limit test of the MOV (specification = 25D561K), and the MOV is damaged when 20 [kA] is applied twice. The point in time at which the current is applied once is defined as the state where the energy inflow is 440 [J] and the failure rate is 100%. Furthermore, since the point in time at which the surge current is applied 3 times can be defined as the state in which the energy inflow is 440 [J] and the failure rate is 100%, because the MOV is damaged when the current is 15 [kA] (which is 75% of the maximum current, is applied 4 times), the energy inflow is defined to be 146.67 [J]. In addition, the failure rate is defined to be 33.33% when 15 [kA] is applied once based on its ratio to the count at the point in time of damage. A non-linear look-up table of the magnitude and the count of the applied surge obtained from a limit test of the MOV is shown in Table 1 and Fig. 4.
[Table 1.] Failure rate during MOV limit test.

Failure rate during MOV limit test.
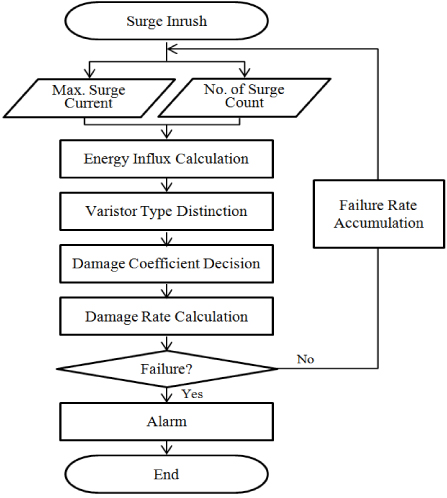
In Fig. 5, an algorithm that can inform the user in advance of the possibility of a failure occurring at the maximum is established by applying the maximum values obtained using the two factors, and then informing the user of those maximum values.
3. FAILURE RATE PREDICTION AND VERIFICATION
The specimens used in the work are chosen by test method to get uniform property of varistor. To verify the proposed algorithm, the test was performed in severe conditions.
3.1 Test method for setting the varistor reference specimen
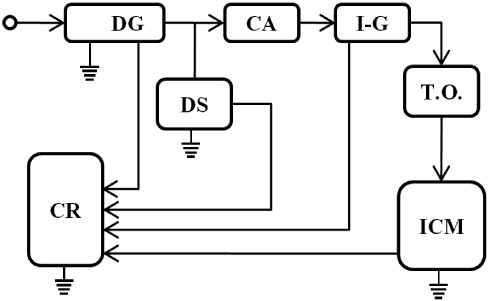
Since differences in the point in time of the damage caused by the same surge current occur because the properties of individual MOVs are not constant, a reference specimen was established to ensure uniform properties through a performance test of a specific standard. The experiment was carried out by selecting only the specimens having the same varistor voltage when the circuit shown in Fig. 6 was used to measure the voltage at the moment 1 [mA] flowed.
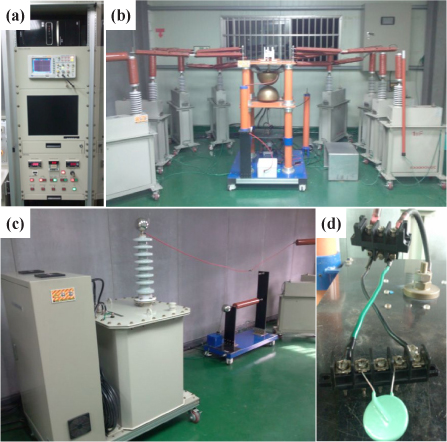
An impulse generator, impulse current device, capacitor, and monitoring system were used as the experimental setup for both the limit test and the verification experiment on the MOV. The voltage generated by the impulse generator was accumulated by the capacitor, which was instantaneously discharged through the test object. The size of the impulse from this experimental setup was adjusted by changing the distance between the discharge holes. Fig. 7 and 8 show the device design for the experiment and the equipment used.
3.3 Leakage current measurement test
For evaluation of the failure of an MOV, damage was determined by a visual inspection and measurement of the direct current resistance and the leakage current. To protect proprietary information regarding the relevant technology, we intentionally do not describe detailed data, formulas, and correlations here, but instead explain the principle using experimental data.
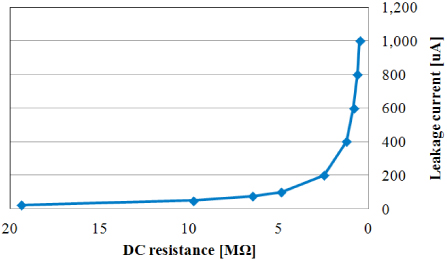
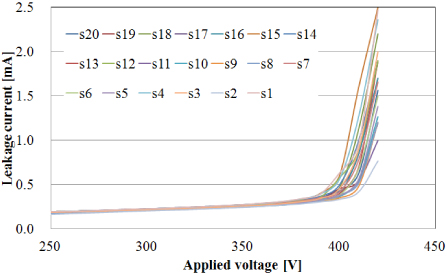
Figure 9 shows the result of measuring the leakage current of the specimen while increasing the applied voltage, such that the leakage current rapidly increased at a certain voltage. To enhance the reliability of the data using the verified specimens, a constant voltage was applied to 97 MOVs, and the leakage current Il was measured; the results are shown in Table 2. The direct current resistance was also measured, and its correlation to the leakage current is shown in Fig. 10.
[Table 2.] Leakage current for 97 MOVs (Voltage : 380 V ).
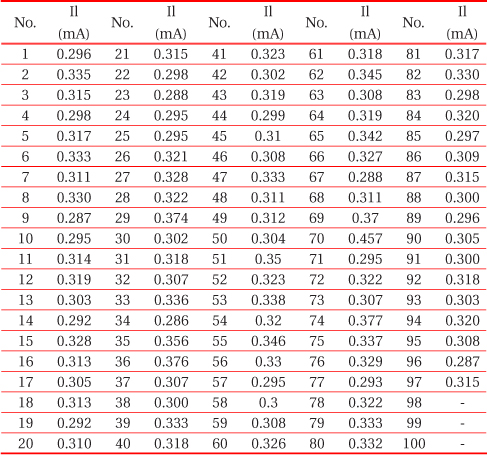
Leakage current for 97 MOVs (Voltage : 380 V ).
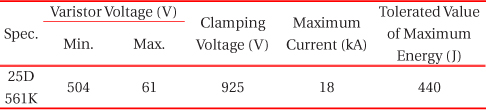
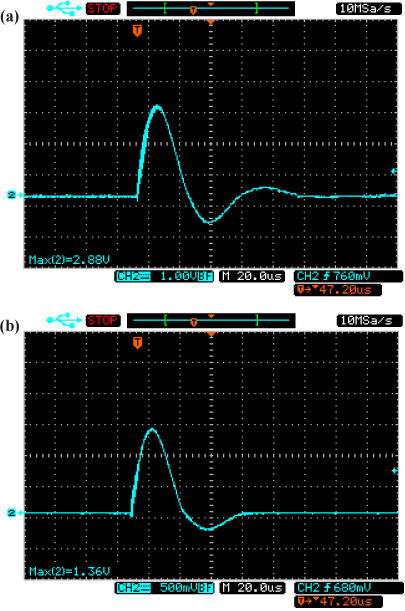
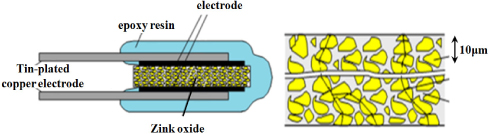
To verify the failure rate prediction algorithm, different sizes and instances of surge current to the MOV were applied. For verification, the real number of surge applications before the final point during the time at which damage occurred were compared with the results of the prediction. The specifications and performance of the MOV used for the experiment are shown in Table 3, and the waveform of the applied surges generated by the impulse current generator is shown in Fig. 11.
[Table 3.] Specification of MOV used in limit test.

Specification of MOV used in limit test.
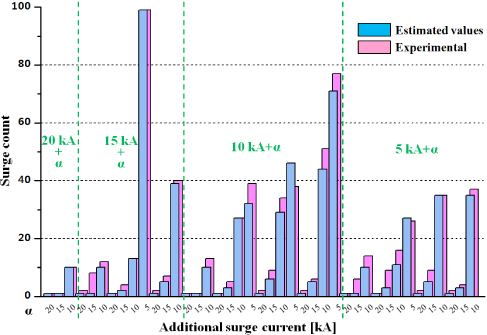
The point in time of damage was predicted in accordance with the failure rate calculated after applying surges between 5 [kA] and 20 [kA] until the MOV was damaged. The majority of the verification experiment results corresponded to or exceeded the expected point in time; these results are shown in Table 4. In addition, the relationship between the damage and the actual number of additional surges is shown in Fig. 12. Because MOVs are not produced to have constant performance, there are cases in which the expected point is exceeded, but no problem occurs in the system safety because the failure rate is indicated at the minimum point in time before a failure occurs.
[Table 4.] Verification experiment results for various previously applied surges.
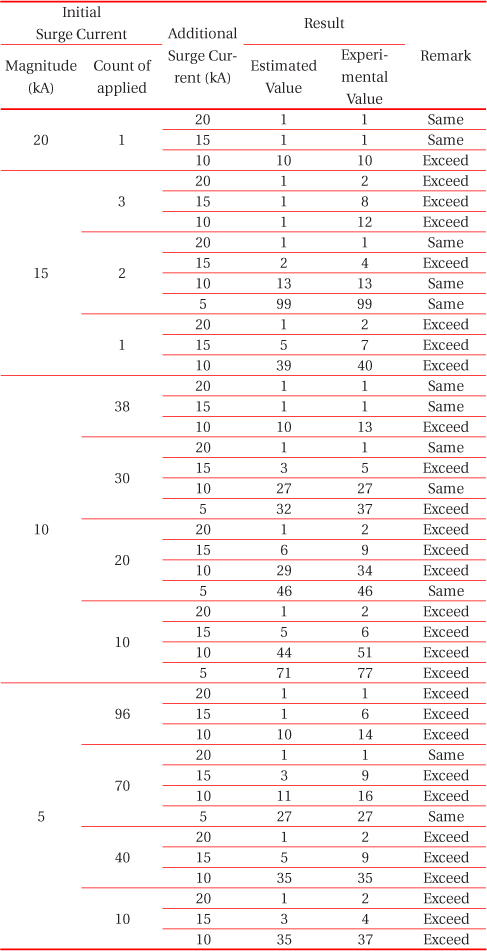
Verification experiment results for various previously applied surges.
The remaining life of an MOV, or the failure rate of the device, was predicted by setting the energy flowing into the MOV immediately before failure of the MOV device at the maximum current based on the maximum energy of the performance indicators. The energy inflow is calculated by measuring the point in time at which the device is damaged, that is, when current is lower than the energy flowing in. Through such results, this function can be used as a method of finding the necessary time to replace a surge protector, or the MOV within. However, as MOVs are not produced to have constant performance, and only the minimum tolerated value is guaranteed from manufacturers, the expected failure point in time may be exceeded in some cases. Accordingly, when predicting the failure rate of a surge protector and indicating the replacement time (although this method can be a little time-consuming at present), Proposed method is believed to be the simplest and easiest method of prediction.