검색 전체 메뉴
PDF
맨 위로
OA 학술지
Effects of olfactory self- and cross-adaptation on perceiving odor in a moth
  • 비영리 CC BY-NC
  • 비영리 CC BY-NC
ABSTRACT

Pheromone orientation in moths is an exemplar of olfactory sensitivity. To avoid cross mating, the responses of males to pheromone blends must be high specificity and temporal resolution. We tested the effects of olfactory self- and cross-adaptation of pheromone compounds and mixtures in Spodoptera litura moths by electroantennogram (EAG) recordings. The challenge of S. litura antennae to a pulse train of its own pheromone blends of Z9,E11-14:OAc and Z9,E12-14:OAc with 200 ms on/off and 1 s on/off indicated that the repetitive stimulation by 200 ms on/off with high dosages resulted in greater adaptation than that by 1 s on/off with low dosages and the adaptation index of Z9,E11-14:OAc in all treatments is significantly larger than that of Z9,E12-14:OAc, suggesting that high dosages with more frequent stimulation prefer to induce sensory adaptations and a different odor coding exist between the two components in the antennal periphery in this moth. The cross-adaptation EAG test among the two pheromone compounds and Z7-12:OAc and Z9-14:OH from congeneric species of S. litura showed that each of these compounds adapted the antenna more to that specific compound. The significantly higher adaptation to Z7-12:OAc and Z9-14:OH than to the pheromone components of S. litura induced by themselves suggested that both of them are coded by specific odor receptor neurons which are different from those tuned to the pheromone components of S. litura . Thus, we proposed that Z7-12:OAc and Z9-14:OH may play an important role in avoidance of heterospecific mating between S. litura and its sympatric moth species.


KEYWORD
self-adaptation , cross adaptation , pheromone compounds , EAG , Spodoptera litura
  • Introduction

    To detect pheromones and plant volatiles in the natural environment, insects have highly developed sensory organs and change their response on the basis of prior experience to eventually increase the chance of survival as far as possible. These odor cues play important roles in forging, habitation, mating, and ovipisition. In this regard, the olfactory system of insect need constantly adapt to environments due to the continuously changing environment. Thus, plasticity of sensory responses is required. The olfactory plasticity is a general phenomena induced by experienced odors (Claudianos et al., 2014). One of the evolutionarily ancient types of plasticity of sensory responses is olfactory adaptation, in which the sensitivity of animals to volatile chemicals is decreased after prolonged exposure to the compound. Adaptation in the sensory organ is an early step in the processing of sensory information, which together with central nervous integration enables the organism to accommodate high sensitivity and respond to a broad range of stimulus concentrations. Typically, an increase in odor stimulus intensity is followed by an initial burst of nerve impulses lasting 50-100 milliseconds producing peak with frequency up to 200 impulses per second (Kaissling et al., 1987).

    The effects of odor experiences on sensory systems demonstrate in a large variable time scale ranging from milliseconds to weeks, suggesting different temporal mechanisms of adaptation. It is known that odor response of animals declines with odor stimulation prolonged (Getchell and Shepherd, 1978; Firestein et al., 1993). For example, the perceived sensitivity of humans to an odorant continuously decreased after odorant exposure (Ekman et al., 1967). In invertebrates such as Caenorhabditis elegans, long-term and continuous exposure to an odorant weakened response to the odorant for several hours (Colbert and Bargmann, 1995). In the crambid moth Ostrinia nubilalis, stimulation of a train of 10 pulses with sex pheromone compounds at a rate of either 1 s on/1 s off, or 200 ms on/200 ms off significantly decreased sex pheromone responses (Karpati et al., 2013). Such self-adaptation process could be caused by either response desensitization, habituation of the central pathways, or conditioned preference (Glendinning et al., 2001). Nevertheless, in mice, exposure to an odorant over a period of weeks increased odorant sensitivity (Wang et al., 1993). Thus, the changes in adaptation depend on the stimulus context, as well as its duration and frequency of repetition.

    Another exposure-induced adaptation is cross adaptation, which may extend to the other compounds. The widely accepted explanation of cross-adaptation is that animals have multiple pathways for passing stimulus information to the central neuronal system (CNS), and each pathway has a different molecular receptive range. The cross adaptation was widely found in insects and other animals. For instance, exposing the antenna of European corn borer moth, Ostrinia nubilalis to a continuous flow of a pheromone compound resulted in a significant lower response to this compound than to most of the other components (Gemeno et al., 2006). The investigation of responses first instar Drosophila melanogaster larvae to a homologous series of acetic esters after exposure to these chemicals showed different responses according to different chemicals (Boyle, 2005).

    Here, to further understand the self- and cross adaptation in insects, we for the first investigated the EAG responses of Spodoptera litura moths to different odorant chemicals after different pulse train conducted with different chemicals including the main pheromone components from S. litura and its congeneric species. Further, we demonstrate that the degree of adaptation depends on the dose and frequency of repetition of the adapting stimulus.

    Materials and Methods

      >  Insects

    Male S. litura pupae were purchased from Keyun Biological Co. Ltd. in Henan Province, China, and maintained in an artificial intelligent climate chamber at 28℃, 65% humidity and 14:10 light:dark period. After emergence, the adults were fed 10% sucrose.

      >  Odor sources

    The stimulus chemicals, (9Z, 11E) - tetradecadienyl acetate (Z9,E11-14:OAc), (9Z, 12E) - tetradecadienyl acetate (Z9,E12-14:OAc), 9Z-tetradecen-1-ol (Z9-14:OH) and (Z)-7-dodecenyl acetate (Z7-12:OAc) were synthesized by NewCon Inc., Ningbo, Zhejiang province, China. All compounds were confirmed to be 92 - 96% chemically pure by GC analysis. Two different binary blends of Z9,E11-14:OAc and Z9,E12-14:OAc, which are main components in S. litura sex pheromones were also used in stimulation: A blend, 1:1 Z9E11-14:OAc : Z9,E12-14:OAc; B blend, 9:1 Z9,E11-14:OAc : Z9,E12-14:OAc. Each chemical was dissolved in paraffin oil with serials of concentrations.

      >  Electroantennogram (EAG) recordings

    Recordings of electrical activity of whole-antennae in response to volatile stimuli were made according to standard techniques. A male moth was stabilized in a 1-mL plastic pipette with a cut tip to allow only the antennae to protrude through the opening. The tip of one of the antenna was cut, and a recording electrode filled with Beadle-Ephrussi Ringer was placed in contact with the cut surface of the antenna and another at the base of the antenna. An Ag/AgCl wire serving as a ground electrode was inserted into the insect’s abdomen. The antenna was continuously flushed with moistened air stream, which was purified by a charcoal filter in a glass tube (8 mm i.d.). The outlet of the tube was about 20 mm from the antenna. The stimulus was injected into the air stream through a Pasteur glass tube 15 cm upstream from the antenna. The stimulation was delivered at a flow rate of 5 mL/s in 0.5-s puffs using a stimulation device (Syntech, The Netherlands). The signal was amplified using a high impedance amplifier, as well as stored and analyzed with the EAG2000 software.

      >  EAG calibration curve

    The EAG calibration curve started with the blank (paraffin oil), followed by 0.02 ng, 0.2 ng, 2 ng, 20 ng, and 200 ng A-blend and B-blend as a positive control. Then two stimulationtrain protocols were used with 0.02 ng, 0.2 ng, 2 ng, 20 ng, and 200 ng Z9,E11-14:OAc or Z9,E12-14:OAc, respectively: either 10 cycles of 200 ms on/off, or 10 cycles of 1 s on/off. Each treatment replicates six times. The comparison among treatments was performed on transformed data , where x is the average value of ratios of first and last EAG amplitude of Z9,E11-14:OAc or Z9,E12-14:OAc; y is the average value of EAG amplitude of paraffin oil.

      >  Self-adaptation and cross adaptation

    A charcoal-filtered, humidified air stream (1 L·min−1) was directed continuously over the antenna via a glass tube (20 cm length × 6 mm i.d.), positioned ~2 cm from the antenna. The selfadaptation EAG consisted two parts. The first one started with a either a 1-s or a 200-ms (depending on the protocol) puff of 20 ng, 200 ng, 2000 ng of Z9E11-14:OAc, followed 1 min later by a puff of Z9E12-14:OAc with the same dosage. Then one min later, two stimulation-train protocols as described above were used with A-blend and B-blend with the same dosages, finally followed by a single stimulation with Z9E11-14:OAc or Z9E12-14:OAc. The second self-adaptation EAG started 2000 ng either Z9E11-14:OAc, Z9E12-14:OAc, Z9-14:OH or Z7-12:OAc, and after one min, the stimulation-train of the same chemical with 10 cycles of 200 ms on/off was conducted. Finally, a single stimulation with the same chemical followed immediately.

    The cross adaptation EAG started with 2000 ng either Z9E11-14:OAc, Z9E12-14:OAc, Z9-14:OH or Z7-12:OAc. After one minute, the stimulation-train of one of the other three chemicals with 10 cycles of 200 ms on, 200 ms off was conducted. Finally, a single stimulation with the same chemical to the first one followed immediately. Each antenna was considered a replicate of an adaptation treatment. The order of the puff treatments for each replicate was randomized among antennae. Each treatment replicates six times. To estimate the amount of adaptation the mean of the three puffs of a given treatment was divided by the mean of the three puffs of paraffin oil. This normalized EAG response after adaptation was divided by the equivalent response before adaptation (= adaptation index). The data were transformed [log(x + 1)] and analyzed with ANOVA followed by a least square analysis (significance level: p < 0.05) using the SPSS10.0.1 software (SPSS Inc.).

    Results and Discussion

      >  EAG Calibration Curve

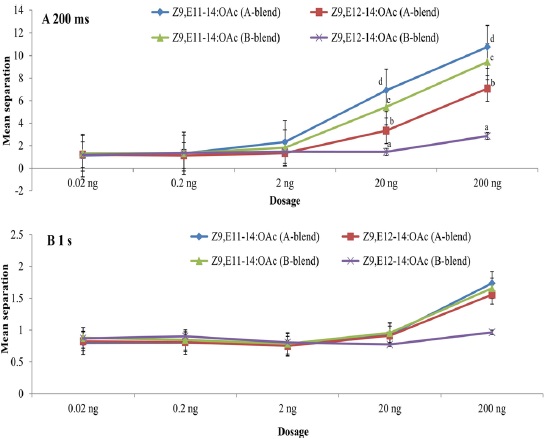
    Using the pulse train with 200 ms, both Z9,E11-14:OAc and Z9,E12-14:OAc had significant effects on EAG peak amplitude at dosages of 20 ng and 200 ng whatever A- or B-blend was used as the positive control (Fig. 1A). Nevertheless, no significant effect was found when using the pulse train with 1 s even at the highest dosage, though there are somewhat differences among the compounds with positive controls (Fig. 1B). The highest mean separations of all treatments were consistently found at the highest dosage 200 ng, followed by 20 ng. The interaction of all treatments was not significant at the low dosages of 0.02 ng, 0.2 ng, and 2 ng because of their much lower responses (Fig. 1). The highest EAG responses at dosages of 20 ng and 200 ng were to Z9,E11-14:OAc with A-blend, followed by Z9,E11-14:OAc with B-blend, Z9,E12-14:OAc with A-blend, and Z9,E12-14:OAc with B-blend as positive control (Fig. 1).

      >  The EAG adaptation of S. litura main pheromone compound to A- and B-blend

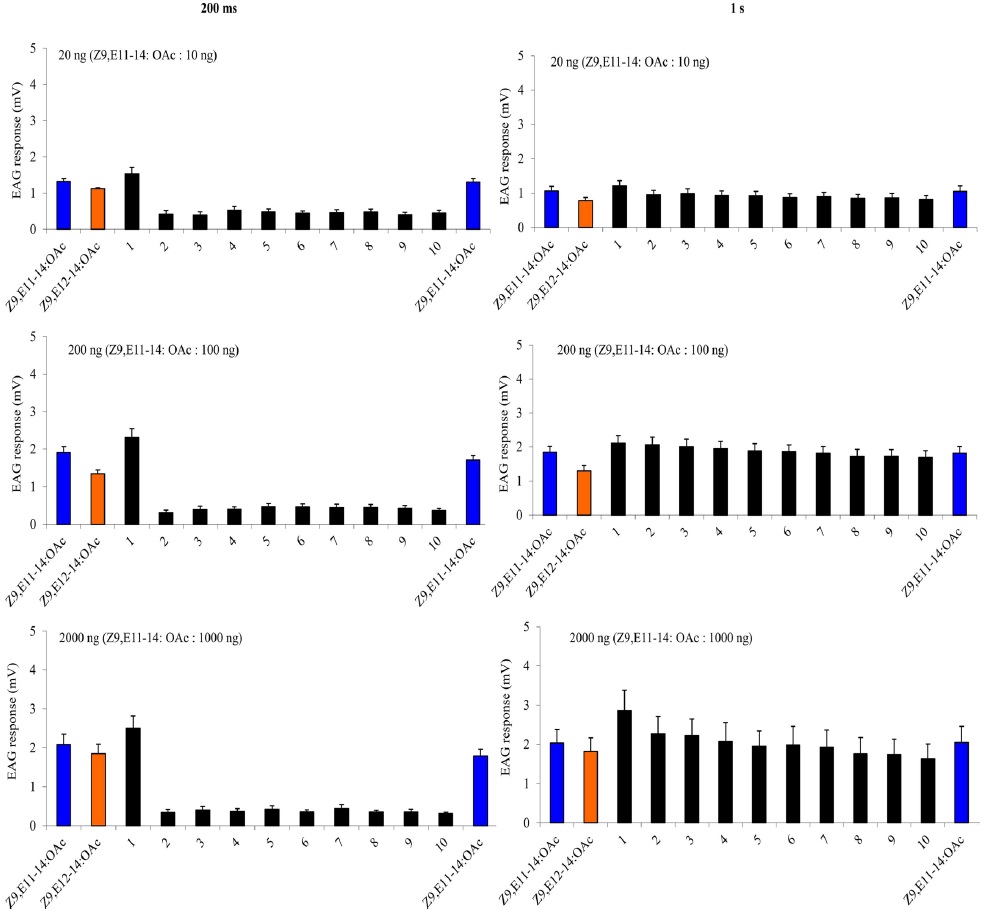
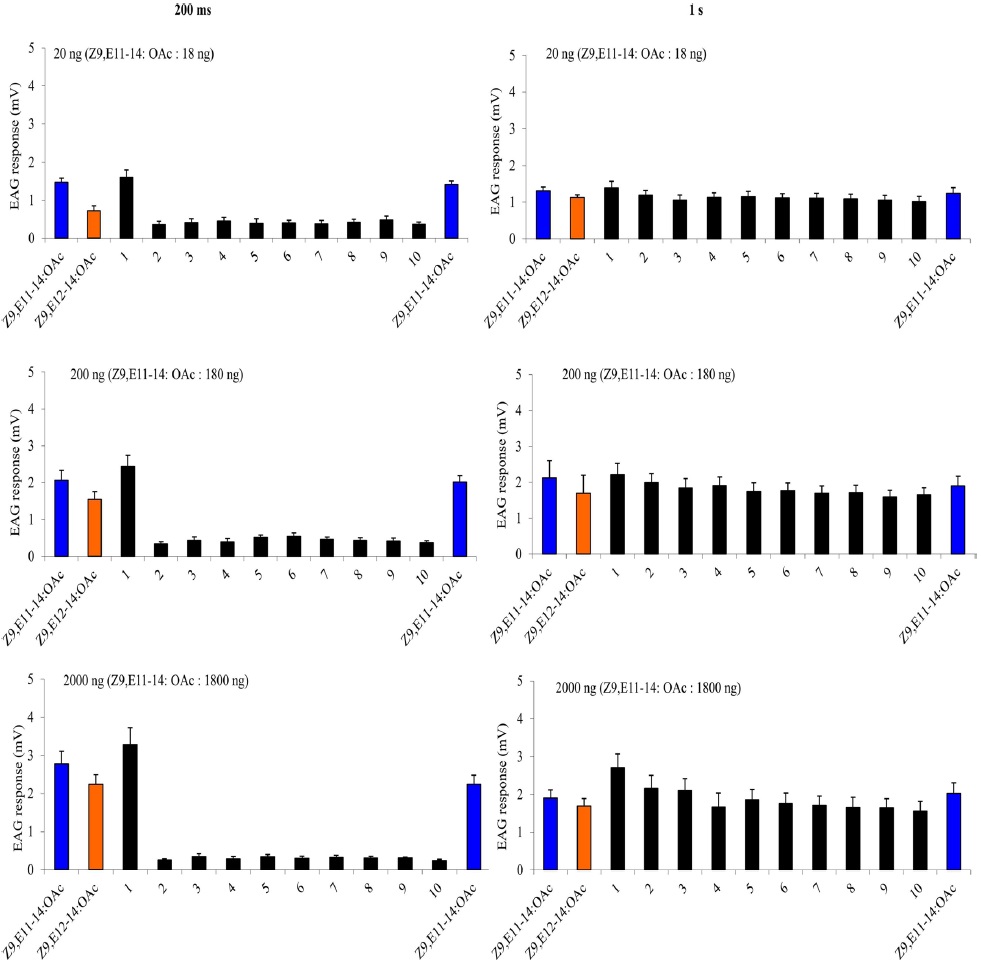
    The challenge of S. litura antennae to a train of both A- and B-blend with two protocols indicated that the repetitive stimulation by 200 ms resulted in greater adaptation than that by 1 s (Figs 2 and 3). The EAG response of A- and B-blend by 200 ms decreased with reiterative stimulations at all dosages, and at the highest stimulus load antennae almost stopped responding within 10 stimulations. Particularly, the first spike is extremely significantly higher than the tenth one in the pulse train with 200 ms. In contrast, the antennae did not adapt to any stimulus loads in the pulse train by 1 s, and there is no significant difference between the first and tenth spike frequency. The EAG responses of antennae to Z9,E11-14:OAc have not significant difference between before and after the pulse train by both 200 ms on/off and 1 s on/off (Figs. 2 and 3).

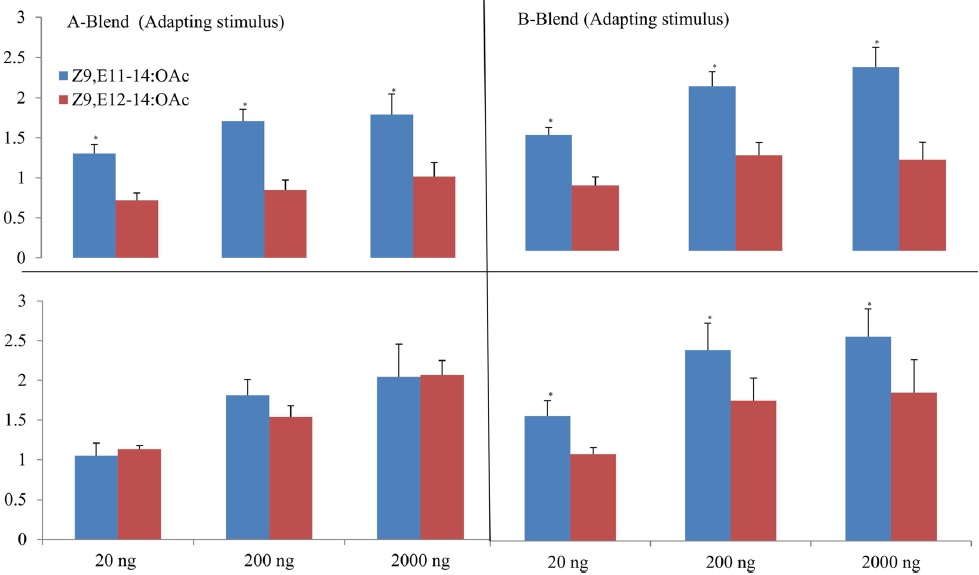
    The effects of adaptation of S. litura antennae on its responses to Z9,E11-14:OAc and Z9,E12-14:OAc after continuously stimulated by A- and B-blend were different depending on the pulse train protocols and dosages (Fig. 4). For example, the adaptation index (1.05 – 2.24) of Z9,E11-14:OAc in all treatments is greater than 1, and significantly larger than that of Z9,E12-14:OAc, except for the treatment of A-blend with pulse train of 1 s conducted, suggesting no adaptation of Z9,E11-14:OAc to both A- and B-blend at any dosages. However, Z9,E12-14:OAc showed adaptation to A- or B-blend in several treatments. For example, the adaptation index (0.72 – 0.86) of Z9,E12-14:OAc in A-blend at all dosages and B-blend at 20 ng with pulse train of 200 ms is less than 1 (Fig. 4).

    Adaptation in the sensory organ is an early step in the processing of sensory information, which together with central nervous integration enables the organism to cope with complex natural stimuli. A continuous stimulation may cause desensitization in odor responses, termed as sensory adaptation. The sensory adaptation has been widely reported in insects, exhibiting a reduction of responses in antennal sensory neuron to pheromone and central nervous system (Gemeno et al., 2006; Miller et al., 2006a; 2006b; D'Errico et al., 2013; Karpati et al., 2013; Wada-Katsumata et al., 2013). Physiological test indicated that mutants of the transient receptor potential (Trp) Ca2+ channel were normal in olfactory response, but defective in olfactory adaptation, suggesting that olfactory adaptation is probably regulated by Trp Ca2+ channel (Stortkuh et al., 1999). In this study, we described the effects of a continuous stimulation of S. litura (Z9,E11-14:OAc, Z9,E112-14:OAc, and two blends of them) and congeneric (Z7-12:OAc and Z9-14:OH) pheromones with different stimulus frequency (5 times/s and once/s) on sensory adaptation of S. litura by EAG method. The results indicated that the adaptation varied with the different chemicals, dosages, and stimulus protocols.

    Pheromone orientation in moths is an excellent example for studying adaptation. We stated the question how blend quality processing in dynamic plumes affects the antennal responses. Z9,E11-14:OAc and Z9,E112-14:OAc are main components in S. litura pheromone (Tamaki et al., 1973). It had been evidenced that the single chemical Z9,E11-14:OAc was more attractive than the ratio 1:1 of Z9,E11-14:OAc and Z9,E112-14:OAc, but less attractive than the ratio 9:1 to S. litura moths in field (Sun et al., 2003). In first, we challenged pheromone-sensitive antennae to a train of A- and B-blend puffs over a 3 stimulus loads over time. We stimulated with pulse trains of 1 s on/off and 200 ms on/off. S. litura antenna is sensitive to Z9,E11-14:OAc and Z9,E112-14:OAc (Feng et al., 2015). Each train was preceded by a single Z9,E11-14:OAc and Z9,E112-14:OAc puff to establish baseline sensitivity. After the pulse train, a single Z9,E11-14:OAc stimulation was given. The repetitive stimulation of the antenna with the A- and B-blend by higher dosages and 200 ms on/off pulse train resulted in greater adaptation that by lower dosages and 1 s on/off (Figs. 2 and 3), suggesting that high dosages with more frequent stimulation prefer to induce sensory adaptations in S. litura moths. The study in the moth Agrotis segetum showed that high concentrations resulted in greater sensory adaptation of the pheromone-sensitive neurons (Baker et al., 1988). In study with moth O. nubilalis, the highest stimulus loads (1 μg) also induced greatest adaptation of sensory neurons (Karpati et al., 2013).

    The cross-adaptation of Z9,E11-14:OAc and Z9,E112-14:OAc to A- and B-blends with different dosages showed that Z9,E11-14:OAc did not adapted to any a blend whereas Z9,E112-14:OAc exhibited adaptations to A- or B-blend in some cases, probably suggesting a different odor coding between the two components in the antennal periphery of S. litura (Fig. 4).

      >  Cross adaptation EAG

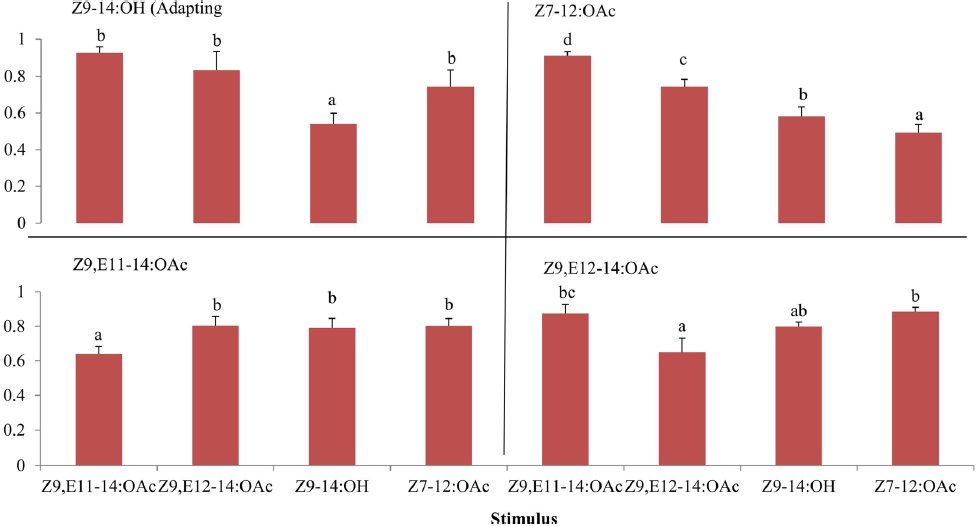
    The results of cross adaptation EAG showed that a continuous stimulation of Z9,E11-14:OAc (df = 3, F = 6.81, p < 0.05) and Z9-14:OH (df = 3, F = 7.69, p < 0.05) to the antenna resulted in a significant lower response to a puff of themselves than to a puff of any other components, whereas Z9,E12-14:OAc (df = 3, F = 5.43, p < 0.05) and Z7-12:OAc (df = 3, F = 6.87, p < 0.05) resulted in significantly greater adaptation to themselves than to some of other pheromone components (Fig. 5). The lowest adaptation index (0.49) was found in Z7-12:OAc adapting the antenna to itself. The highest adaptation index (0.93) was found in Z9,E11-14OAc adapting the antenna to Z9-14:OH (Fig. 5). Our results were consistent with previous insect pheromone studies (Gemeno et al., 2006). The significantly higher adaptation to Z7-12:OAc and Z9-14:OH than to the pheromone components of S. litura induced by themselves suggested that both of them are coded by specific odor receptor neurons. These neurons are different from those coding the pheromone components of S. litura. Further, the cross-adaptation between them is significantly different, suggesting they also might be detected by the different olfactory receptor neurons in antenna. The pheromone adaptation among species is crucial to avoid cross-attraction and mating between different species. In our study, Z9-14:OH produced by S. exigua is significantly adaptive to components of pheromones from S. litura. It has been known that Z9,E112-14:OAc is one of the major pheromone components in both species. Thus, Z9-14:OH probably plays an important role in avoidance of cross-mating between the two species. Likewise, Z7-12:OAc has probably worked between S. litura and S. frugiperda. Previous studies have reported many examples of pheromone adaptation among species, but the adaptive significance was rarely demonstrated. For example, Z9-14:Ald produced by Helicoverpa virescens acts as an antagonist to H. zea, benefiting both species to avoid cross-mating, because both species share a major pheromone compound, Z11-16:Ald (Mustaparta, 1997). Z11-16:Ald produced by Sesamia nonagrioides (Noctuidae) is also antagonized to O. nubilalis so that no cross-attraction exist between species, even though they are sympatric moth species in Mediterranean region and both feed on corn stalks (Albajesa et al., 2002; Gemeno et al., 2006). Similar studies of sensory adaptation have also been described in other insects (Leal, 1996; Kelling et al., 2002; Boyle, 2005; Murmu et al., 2011; D'Errico et al., 2013).

    In current study, S. litura male antennae were positioned 20 mm downwind from a pheromone compound in a rhythmic air stream. In field, however, males are much far from females, and a discontinuous plume with much lower concentration of pheromone would be possible. Thus, to reveal effects on the ability of males to locate females under other pheromone compounds, a further study on the sensory adaptation in field might be necessary.

참고문헌
  • 1. Albajesa R, Konstantopouloub M, Etcheparec O, Eizaguirrea M, Frerotd B, Sansa A, Krokosb F, Amelined A, Mazomenosb B (2002) Mating disruption of the corn borer Sesamia nonagrioides (Lepidoptera: Noctuidae) using sprayable formulations of pheromone. [Crop Prot] Vol.21 P.217-225 google cross ref
  • 2. Baker TC, Hansson BS, Lofstedt C, Lofqvist J (1988) Adaptation of antennal neurons in moths is associated with cessation of pheromone-mediated upwind flight. [Proc Nat Acad Sci USA] Vol.85 P.9826-9830 google cross ref
  • 3. Boyle J (2005) Olfactory coding in Drosophila larvae investigated by cross-adaptation. [J Exp Biol] Vol.208 P.3483-3491 google cross ref
  • 4. Claudianos C, Lim J, Young M, Yan S, Cristino AS, Newcomb RD, Gunasekaran N, Reinhard J (2014) Odor memories regulate olfactory receptor expression in the sensory periphery. [Eur J Neurosci] Vol.39 P.1642-1654 google cross ref
  • 5. Colbert HA, Bargmann CI (1995) Odorant-specific adaptation pathways generate olfactory plasticity in C. elegans. [Neuron] Vol.14 P.803-812 google cross ref
  • 6. D’Errico G, Faraone N, Rotundo G, De Cristofaro A, Trimble RM (2013) Sensory adaptation of antennae and sex pheromone-mediated flight behavior in male oriental fruit moths (Leptidoptera: Tortricidae) after prolonged exposure to single and tertiary blends of synthetic sex pheromone. [Environ Entomol] Vol.42 P.548-557 google cross ref
  • 7. Ekman G, Berglund B, Berglund U, Lindvall T (1967) Perceived intensity of odor as a function of time of adaptation. [Scandinavian J Psychol] Vol.8 google cross ref
  • 8. Feng B, Lin X, Zheng K, Qian K, Chang Y, Du Y (2015) Transcriptome and expression profiling analysis link patterns of gene expression to antennal responses in Spodoptera litura. [BMC Genomics] Vol.16 P.269 google cross ref
  • 9. Firestein S, Picco C, Menini A (1993) The relation between stimulus and response in olfactory receptor cells of the tiger salamander. [J Physiol] Vol.468 P.1-10 google cross ref
  • 10. Gemeno C, Sans A, Lopez C, Albajes R, Eizaguirre M (2006) Pheromone antagonism in the European corn borer moth Ostrinia nubilalis. [J Chem Ecol] Vol.32 P.1071-1084 google cross ref
  • 11. Getchell TV, Shepherd GM (1978) Adaptive properties of olfactory receptors analysed with odour pulses of varying durations. [J Physiol] Vol.282 P.541-560 google cross ref
  • 12. Glendinning JI, Brown H, Capoor M, Davis A, Gbedemah A, Long E (2001) A peripheral mechanism for behavioral adaptation to specific “Bitter” taste stimuli in an insect. [J Neurosci] Vol.21 P.3688-3696 google
  • 13. Kaissling KE, Strausfeld CZ, Rumbo ER (1987) Adaptation processes in Insect olfactory receptors, mechanisms and behavioral significance. [Ann NY Acad Sci] Vol.510 P.104-112 google cross ref
  • 14. Karpati Z, Tasin M, Carde RT, Dekker T (2013) Early quality assessment lessens pheromone specificity in a moth. [Proc Nat Acad Sci USA] Vol.110 P.7377-7382 google cross ref
  • 15. Kelling FJ, Ialenti F, Den Otter CJ (2002) Background odours induces adaptation and sensitization of olfactory receptors in antennae of houseflies. [Med Vet Entomol] Vol.16 P.161-169 google cross ref
  • 16. Leal WS (1996) Chemical communication in scarab beetles: Reciprocal behavioral agonist-antagonist activities of chiral pheromones. [Proc Nat Acad Sci USA] Vol.93 P.12112-12115 google cross ref
  • 17. Miller JR, Gut LJ, de Lame FM, Stelinski LL (2006a) Differentiation of competitive vs. non-competitive mechanisms mediating disruption of moth sexual communication by point sources of sex pheromone (part 2): Case studies. [J Chem Ecol] Vol.32 P.2115-2143 google cross ref
  • 18. Miller JR, Gut LJ, de Lame FM, Stelinski LL (2006b) Differentiation of competitive vs. non-competitive mechanisms mediating disruption of moth sexual communication by point sources of sex pheromone (Part I): Theory1. [J Chem Ecol] Vol.32 P.2089-2114 google cross ref
  • 19. Murmu MS, Stinnakre J, Real E, Martin J-R (2011) Calcium-stores mediate adaptation in axon terminals of olfactory receptor neurons in Drosophila. [BMC Neurosci] Vol.12 P.105 google cross ref
  • 20. Mustaparta H (1997) Olfactory coding mechanisms for pheromone and interspecific signal information in related species of moths. In R.T. Carde, J.G. Millar (eds) Advances in Insect Chemical Ecology. P.141-164 google
  • 21. Stortkuh KF, Hovemann BT, Carlson JR (1999) Olfactory adaptation depends on the Trp Ca2+ channel in Drosophila. [J Neurosci] Vol.19 P.4839-4846 google
  • 22. Sun F, Du JW, Chen TH (2003) The behavioral responses of Spodoptera litura (F .) males to the female sex pheromone in wind tunnel and field trapping tests. [Acta Entomologica Sinica] Vol.46 P.126-130 google
  • 23. Tamaki Y, Noguchi H, Yushima T (1973) Sex pheromone of Spodoptera litura (F) (Lepidoptera: Noctuidae): isolation, identification and synthesis. [Appl Entomol Zool] Vol.8 P.200-203 google
  • 24. Wada-Katsumata A, Silverman J, Schal C (2013) Changes in taste neurons support the emergence of an adaptive behavior in cockroaches. [Science] Vol.340 P.972-975 google cross ref
  • 25. Wang HW, Wysocki CJ, Gold GH (1993) Induction of olfactory receptor sensitivity in mice. [Science (New York, N.Y.)] Vol.260 google
이미지 / 테이블
  • [ Fig. 1. ]  Mean separation of EAG responses of S. litura male antennae to five concentrations of its own pheromone components with pulse train by 200 ms on/off (A) and 1 s on/off (B). Different small letters in a column indicate significant differences among different treatments by least square analysis after ANOVA (p < 0.05).
    Mean separation of EAG responses of S. litura male antennae to five concentrations of its own pheromone components with pulse train by 200 ms on/off (A) and 1 s on/off (B). Different small letters in a column indicate significant differences among different treatments by least square analysis after ANOVA (p < 0.05).
  • [ Fig. 2. ]  EAG responses of S. litura to A-blend pulse trains across 3 stimulus loads. Each panel represents the response of S. litura to Z9,E11-14:OAc, followed in 30 s by Z9,E12-14:OAc at equal dose. After 1 min, the antennae were exposed to a train of 10 B-blend pulses at a rate of either 1 s on/1 s off, or 200 ms on/ 200 ms off. Finally, we stimulated with Z9,E11-14:OAc after the stimulation train. Error bars represent SEM. The responses of the antennae to the first and last stimulation in the train were significantly different in 200 ms series at p ≤ 0.001.
    EAG responses of S. litura to A-blend pulse trains across 3 stimulus loads. Each panel represents the response of S. litura to Z9,E11-14:OAc, followed in 30 s by Z9,E12-14:OAc at equal dose. After 1 min, the antennae were exposed to a train of 10 B-blend pulses at a rate of either 1 s on/1 s off, or 200 ms on/ 200 ms off. Finally, we stimulated with Z9,E11-14:OAc after the stimulation train. Error bars represent SEM. The responses of the antennae to the first and last stimulation in the train were significantly different in 200 ms series at p ≤ 0.001.
  • [ Fig. 3. ]  EAG responses of S. litura to B-blend pulse trains across 3 stimulus loads. Each panel represents the response of S. litura to Z9,E11-14:OAc, followed in 30 s by Z9,E12-14:OAc at equal dose. After 1 min, the antennae were exposed to a train of 10 A-blend pulses at a rate of either 1 s on/1 s off, or 200 ms on/ 200 ms off. Finally, we stimulated with Z9,E11-14:OAc after the stimulation train. Error bars represent SEM. The responses of the antennae to the first and last stimulation in the train were significantly different in 200 ms series at p ≤ 0.001.
    EAG responses of S. litura to B-blend pulse trains across 3 stimulus loads. Each panel represents the response of S. litura to Z9,E11-14:OAc, followed in 30 s by Z9,E12-14:OAc at equal dose. After 1 min, the antennae were exposed to a train of 10 A-blend pulses at a rate of either 1 s on/1 s off, or 200 ms on/ 200 ms off. Finally, we stimulated with Z9,E11-14:OAc after the stimulation train. Error bars represent SEM. The responses of the antennae to the first and last stimulation in the train were significantly different in 200 ms series at p ≤ 0.001.
  • [ Fig. 4. ]  Effect of adaptation of S. litura male antennae on its response to its pheromone components at three dosages. The adaptation index reflects the decrease of the antennal response after it has been exposed to the adapting stimulus, shown on the top of each graph. The star (*) on graph indicate differences of adaptation indexes between Z9,E11-14:OAc and Z9,E11-14:OAc using least square analysis after ANOVA (p< 0.05).
    Effect of adaptation of S. litura male antennae on its response to its pheromone components at three dosages. The adaptation index reflects the decrease of the antennal response after it has been exposed to the adapting stimulus, shown on the top of each graph. The star (*) on graph indicate differences of adaptation indexes between Z9,E11-14:OAc and Z9,E11-14:OAc using least square analysis after ANOVA (p< 0.05).
  • [ Fig. 5. ]  Effect of adaptation of S. litura male antennae on its response to conspecific pheromone components. The adaptation index reflects the decrease of the antennal response after it has been exposed to the adapting stimulus, shown on the top of each graph. Different letters within each graph indicate differences among adaptation indexes using least square analysis after ANOVA (p < 0.05).
    Effect of adaptation of S. litura male antennae on its response to conspecific pheromone components. The adaptation index reflects the decrease of the antennal response after it has been exposed to the adapting stimulus, shown on the top of each graph. Different letters within each graph indicate differences among adaptation indexes using least square analysis after ANOVA (p < 0.05).
(우)06579 서울시 서초구 반포대로 201(반포동)
Tel. 02-537-6389 | Fax. 02-590-0571 | 문의 : oak2014@korea.kr
Copyright(c) National Library of Korea. All rights reserved.