Secondary ion mass spectrometry (SIMS) is a promising technique to measure isotope ratios of individual uranium particles in environmental samples taken at nuclear facilities,1-3 similar to thermal ionization mass spectrometry.4-6 The isotope ratios provide valuable information on the sources of each particle, which are strongly related to nuclear activities in a nuclear facility. The International Atomic Energy Agency compares such isotope ratio data with values for nuclear materials used and declared by a facility. If there is an inconsistency between the obtained data and declared information, undeclared nuclear activities are suspected for the facility. This plays an important role in nuclear non-proliferation.
A drawback in isotope ratio analysis by SIMS is the occurrence of molecular ion interferences.7,8 During the analysis of a uranium particle, elements such as lead (Pb) and tungsten (W) in neighboring particles may produce molecular ions and cause spectral interferences on the uranium mass region (e.g., 206Pb12C16O+, 208Pb12C16O+ and 186W16O3+), resulting in inaccurate isotope ratio results. The use of a state-of-the-art SIMS instrument enables to overcome this problem to a considerable extent owing to a high mass-resolving power.8
As an alternative approach, the authors previously developed a manipulation technique for a uranium particle under a scanning electron microscope (SEM).7 This approach enabled individual uranium particles to be transferred onto another planchet using a micromanipulator attached to SEM, thereby eliminating molecular ion interferences by elements in neighboring particles. In this technique, prior to the manipulation and isotope ratio analysis by SIMS, a small number of uranium particles that coexisted with a large number of other particles containing no uranium must be identified using SEM. The observation of backscattered electron (BSE) images is useful for the identification of a uranium particle because a particle containing an element with a relatively higher atomic number yields an image with relatively higher brightness.9 Therefore, uranium containing particles can be easily distinguished from other particles containing elements with relatively lower atomic numbers such as carbon, aluminum, silicon, and iron. However, it is considerably difficult to distinguish uranium containing particles from particles containing elements with relatively higher atomic numbers such as Pb and W. Therefore, X-ray analysis for identified particles is necessary to confirm the presence of uranium in each particle. This analysis is manually performed over the entire area for each planchet, which requires enormous efforts and limits the throughput of the analysis.
In the present study, an automated particle search function known as “Particle Finder” (developed for SEM instruments by JEOL Co. Ltd. Japan) was used to efficiently identify uranium particles. Here, the observation of BSE images and X-ray analysis with an energy dispersive X-ray (EDX) detector were performed automatically for particle identification. The performance was evaluated through an analysis of a real environmental sample. After the identification of uranium particles, each particle was transferred onto another planchet, and isotope ratio analysis was performed by SIMS.
An environmental sample taken at a nuclear facility was used in this study. Particles in the sample were recovered onto a glassy carbon planchet (25 mm Φ, Hitachi Chemical Co. Ltd., Japan) by a vacuum impaction technique.10 The planchet was then introduced into the main chamber of SEM. After the identification of individual uranium particles with SEM-EDX, each uranium particle was manipulated with a glass needle attached to a manipulator and transferred onto another glassy carbon planchet. Glass needles were fabricated from glass rods with a diameter of 1 mm using a micropipette puller (PC-10, Narishige Co. Ltd., Japan) and thinly coated with gold using a coater (SC-701AT, Sanyu Electron Co. Ltd., Japan).
A field emission scanning electron microscope (JSM-7800F, JEOL Co. Ltd., Japan) equipped with EDX (JED-2300, JEOL Co. Ltd., Japan) was used to identify uranium particles. An electron beam with an accelerating voltage of 20 keV was used to observe BSE images of the particles. The number of pixels of the BSE images was set at 512 × 384. The magnification of the BSE images was set at × 250, × 500, × 750, × 1000, × 1300, or × 1600. Uranium particles were searched over a range of 1 cm × 1 cm on the planchet. The acquisition time in EDX analysis for each identified particle was set at 10 s.
A secondary ion mass spectrometer (IMS-6f, Cameca, France) was used for measuring isotope ratios in individual uranium particles. In SIMS analysis, an O2+ focused beam of 15 keV with a current of 1-5 nA and raster size of 30 or 40 μm was used for sputtering particles. Positive secondary ions emitted from a particle were accelerated through 5 keV. Transfer optics of 150 μm and a field aperture of 1800 μm were used. An energy slit was adjusted for a band pass of 50 eV. The mass resolution was set at 300.
>
Uranium particle identification
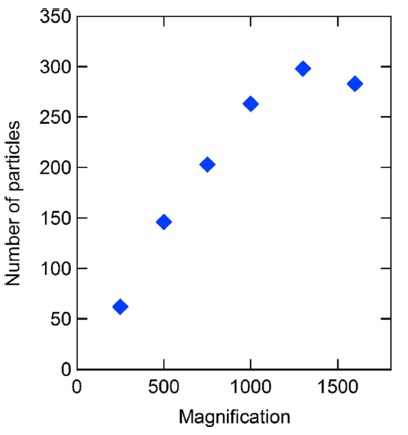
The relation among the magnification of BSE images, analysis time, and number and size of identified uranium particles was investigated to optimize analytical conditions for SEM-EDX analysis. In this study, uranium particles in the sample were identified by SEM-EDX with magnifications of ×250, ×500, ×750, ×1000, ×1300, and ×1600, and with increasing magnification, the analysis times increased, i.e., 6.4, 14.5, 31.5, 55.1, 92.8, and 137.1 h, respectively. The analysis times were strongly dependent on the number of uranium particles and other particles containing elements with relatively higher atomic numbers. The number of identified uranium particles increased with increasing magnification until ×1300 and slightly reduced at ×1600, as shown in Figure 1. At ×1300 magnification, 298 uranium particles were identified, whereas at ×250 magnification, only 62 uranium particles were detected. At ×1000 magnification, 263 uranium particles were identified, which is 88% of the number of particles identified at ×1300 magnification. In this case, the analysis time was reduced to 59% of that of the measurement at ×1300 magnification. By considering the analysis time and the number of identified uranium particles, ×1000 magnification appears to be appropriate for efficiently identifying uranium particles.
At ×1000 magnification, 263 uranium particles and 156 particles containing no uranium were identified by the BSE images. The main elements in the particles containing no uranium were Pb, W, and zinc (Zn). From the BSE images, it was difficult to distinguish uranium particles from the other particles containing these elements. Therefore, X-ray analysis for each identified particle was essential to confirm the presence of uranium.
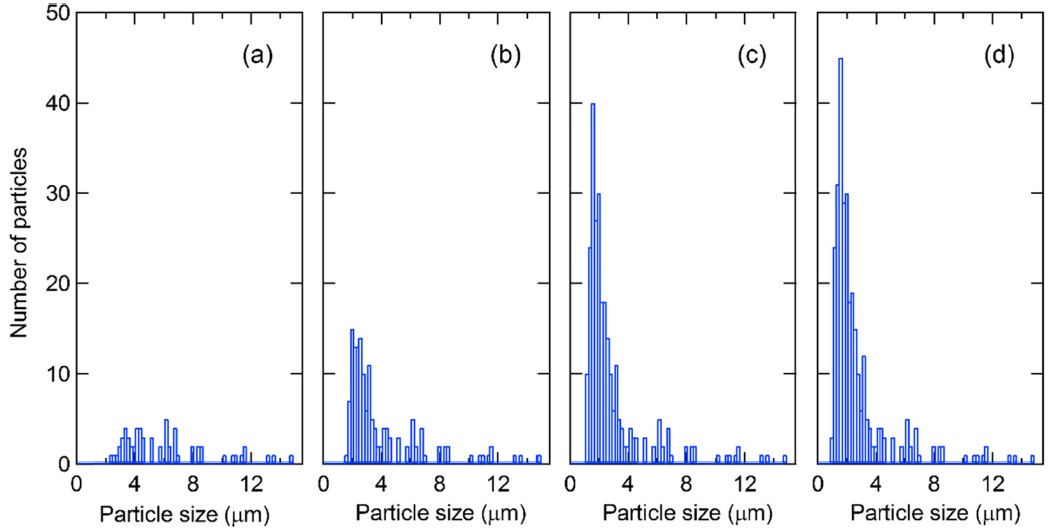
Figure 2 shows the number of identified uranium particles as a function of the particle size. At ×250 magnification, no uranium particle with a diameter of less than 2 μm was identified. Conversely, at ×1000 and ×1300 magnification, a large number of uranium particles with less than 2 μm diameter was identified. Environmental samples taken at nuclear facilities usually contain uranium particles with a diameter of approximately 1 μm. Therefore, ×1000 magnification is necessary to identify uranium particles for such samples.
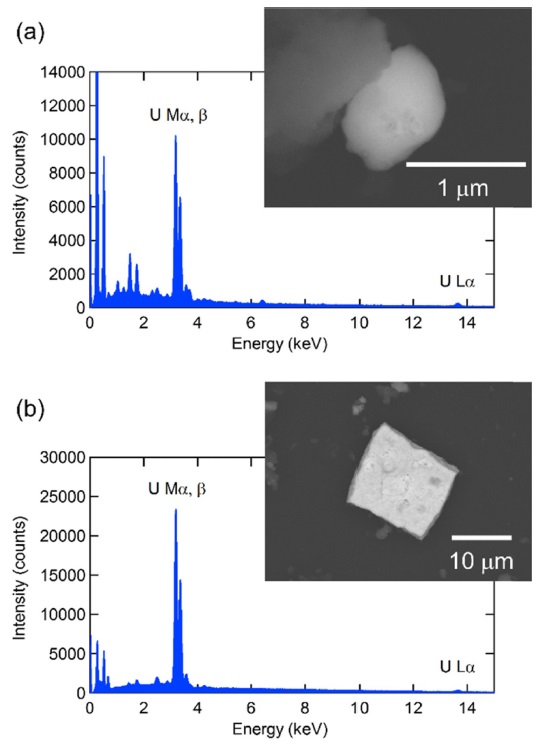
Figure 3 shows the BSE images and EDX spectra of the smallest and largest uranium particles identified in this study. Uranium exhibits a U Mα X-ray peak at 3.16 keV in the EDX spectra. This peak is easily distinguishable from Pb Mα (2.34 keV), W Mα (1.77 keV) and Zn Lα (1.01 keV) X-ray peaks. On the other hand, cadmium (Cd) exhibits a Cd Lα X-ray peak at 3.13 keV, which overlaps with the U Mα X-ray peak. It is difficult to distinguish a U Mα X-ray peak from a Cd Lα X-ray peak because of insufficient energy resolution in EDX analysis. In this case, a U Lα X-ray peak at 13.6 keV should also be observed to confirm the presence of uranium because Cd exhibits no X-ray peak in such energy.
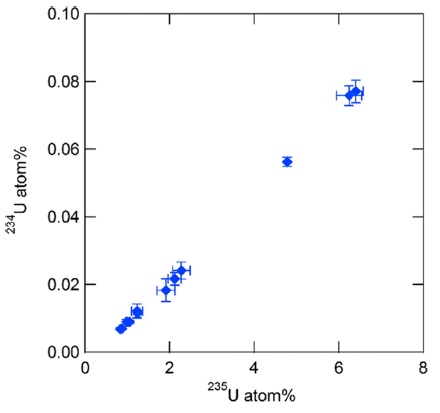
Each uranium particle identified at ×1000 magnification in SEM-EDX analysis was manipulated and transferred onto another glassy carbon planchet for subsequent isotope ratio analysis by SIMS. Figure 4 shows the 234U and 235U atomic ratios obtained for 12 individual uranium particles. The 235U atomic ratios were 0.8-6.4%. There is a good correlation between the 234U and 235U atomic ratios, which indicates that there is no molecular ion interference owing to particle manipulation. The correlation between the 234U and 235U atomic ratios also indicates that low enriched uranium materials have been used at the facility from where the sample was taken.11
In the present study, uranium particles were efficiently identified by SEM-EDX with automated particle search mode. The observation of the BSE images with ×1000 magnification was appropriate to efficiently identify particles with a diameter of approximately 1 μm. After the identification of uranium particles, the uranium atomic ratios of individual particles were successfully determined with SIMS without any molecular ion interference. The proposed technique based on the observation of the BSE images is especially useful for analyzing particles containing elements with relatively higher atomic numbers. Therefore, this technique would be a powerful tool for analyzing not only uranium but also heavy metal elements in environmental samples.