Recently, there is an increasing demand for large touch screen panels (TSPs) in the touch screen industry. With the availability of relatively large touch screens, TSPs have been adopted for various applications such as television screens, digital signage, and medical devices. Owing to the development of these devices, most of the recent touch applications require additional functions such as a multi-touch function. Further, since a touch screen can serve as both a display terminal and an input device, it often replaces a mouse or a keyboard [1-3].
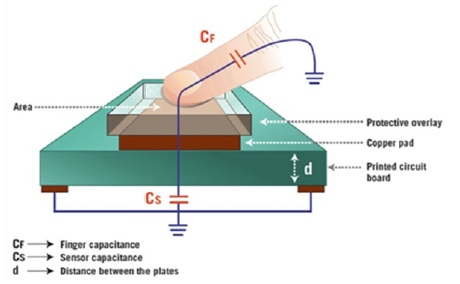
Various types of TSPs have been developed to improve the detection performance and to support a wide range of applications. Nowadays, projected-capacitance type TSPs have been increasingly adopted in most touch screen applications. Fig. 1 shows the general architecture of a projected-capacitance TSP with a human finger [4].
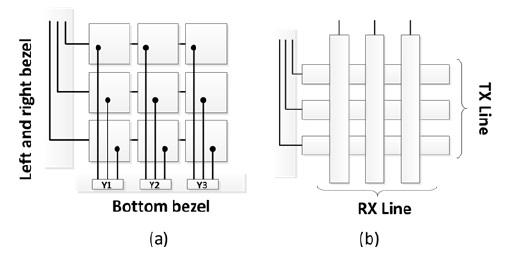
Projected-capacitance TSPs are further divided into the self-capacitance and the mutual-capacitance types [5-7]. Self-capacitance TSPs use rows and columns of conductors overlaid in a grid pattern, and mutual-capacitance TSPs use an array of capacitors located at each intersection of the conductor grid. Fig. 2 shows the structure of self-capacitance and mutual-capacitance TSPs. The detection method of projected-capacitance TSPs involves the measurement of the capacitance changes inferred by touched objects. In the case of self-capacitance panels, a controller detects the changes in the capacitance for each row and column. The self-capacitance TSPs, however, suffer from ghost point problems in the case of multiple touches, which is a serious drawback [8]. Mutual-capacitance TSPs, on the other hand, have two conductive layers for driving and sensing the signal. Since their controller measures the mutual capacitance between the two layers, mutual-capacitance type panels can better distinguish multiple touches.
To sense an RX signal from a mutual-capacitance TSP, either a single-line sensing or a differential sensing method can be used for recognizing the changes in the mutual capacitance throughout the TSP. While the early techniques usually drive TX lines sequentially, the latest techniques often drive the TX lines concurrently. As an example of the concurrent driving techniques, frequency division concurrent sensing (FDCS) [9] has been reported to provide a fast sensing speed for large touch screens.
The sensed signal from the RX lines is passed to an analog-to-digital converter (ADC) followed by a microcontroller unit (MCU), where software algorithms filter noise and calculate the touch positions [1,2,10-12]. The software algorithms running on MCUs, however, suffer from a critically low processing speed. Therefore, conventional software-based algorithms are often unacceptable for large TSPs. For example, the 23-inch TSP used for our experiments has 44 TX lines and 78 RX lines, and therefore, the number of touch points is 3,432. The complexity of a software algorithm rapidly increases with an increase in the number of touch points, which in turn increases with an increase in the TSP size. The speed of the touch position calculations of a TSP is, in general, calculated using Eqs. (1) and (2). Eqs. (1) and (2) express the resulting frame scan rate and report rate, respectively. Here,
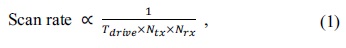

On the other hand, although the TSP size is being continuously increased because of the market demand, the target report rate requirement has mostly remained the same or in some cases, increased to meet the tight performance goal. To reduce the processing time and increase the report rate, we need to develop new high-speed algorithms or hardware-based methods.
In this paper, we propose a touch position recovery algorithm with a differential sensing circuit. The rest of this paper is organized as follows. In Section II, we briefly discuss the existing touch screen sensing methods, and the result of sensing a TSP. The proposed algorithm and the experimental results are described in Sections III and IV, respectively. Finally, we present the conclusion in Section V.
II. EXISTING TOUCH SCREEN SENSING METHODS
>
A. Single-Line Sensing Method
The touch positions in mutual-capacitance touch screens are determined by measuring the change in the mutual capacitance. The single-line sensing method has been most widely used thus far because of its simplicity. In this method, the drive circuit applies stimulus signals to a driving (TX) line. As its stimulus signals, it often employs chopping signals, pulses, or sinusoidal signals. Then, the sensing circuit sequentially reads out the sensing (RX) lines to measure the changes in capacitance. Most of the single-line sensing circuits convert the charge in the mutual capacitors to a voltage by integrating the sensed RX signal. An ADC translates the voltage into digital values that directly indicate the mutual capacitance variation, as shown in Fig. 3 [13]. Therefore, the touch position recovery algorithm of single-line sensing is as simple as noise filters. However, this method has a disadvantage: it is very difficult to remove the common-mode noise, a dominant noise in most TSPs.
>
B. Differential Sensing Method
Another approach is a differential sensing method, which can effectively reduce the common-mode noise and has thus received more attention. Differential sensing removes the common-mode noise affecting pairs of adjacent cells (touch points) on the same TX line, which is the most prominent noise type in TSPs [7]. Fig. 4 illustrates a conventional differential sensing circuit. A differential amplifier subtracts the RX signals from each pair of adjacent cells. A differential integrator accumulates the signal difference while cancelling high-frequency noise. Once the differential sensing is carried out for all the RX line pairs, a driving signal is applied to the next TX line, and then, the abovementioned process is repeated. The differential sensing method usually provides a substantially higher signal-to-noise ratio (SNR) than the single-line sensing method. However, it suffers from the multi-touch cancellation problem. If two differential RX lines are both touched, the two touched signals cancel each other and thus, may not be detected correctly.
A differential sensing method called the delta (Δ)-integration scheme [14,15] has been reported to detect the touched position effectively. It reads two RX lines that are Δ distance apart rather than two adjacent RX lines. However, this method treats a touched signal or an untouched signal as a binary value and counts the binary values to form a wide hill of touched areas. Therefore, it is only effective to detect a wide touched area. Further, it is not suitable for highly accurate multi-touch detection methods, which must distinguish multiple touch points having small areas and many levels of touch strength.
In this paper, we propose a new method that can accurately detect multiple touches of very small areas and a range of touch strength levels. It employs a recovery algorithm that recovers all the original touch points accurately even in the case of the multi-touch cancellation problem.
>
C. Frequency Division Concurrent Sensing Method
While the differential sensing method improves the SNR, it usually yields the same frame scan rate and the single-line sensing method. Recently, in order to improve the frame scan rate, concurrent sensing methods have been proposed, which drive multiple TX lines concurrently.
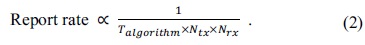
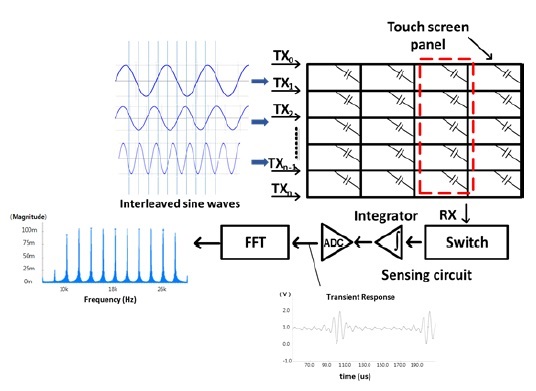
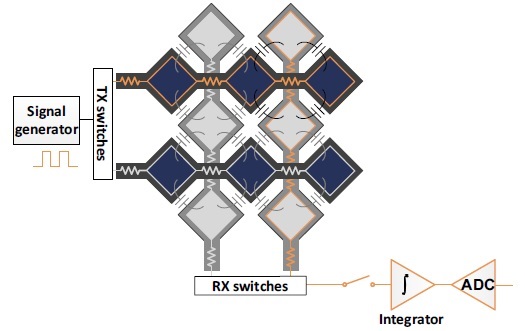
For example, a concurrent sensing method called FDCS [16] concurrently drives multiple sine waves of orthogonal frequencies onto all the TX lines. Then, its sensing circuit reads out each RX signal, which is the sum of all the sine waves propagated from all the TX lines. Thereafter, it determines the touch positions by analyzing the fast Fourier transform (FFT) of the sine waves [16]. Fig. 5 illustrates the operation of the FDCS method.
In addition to its high speed, the concurrent sensing method can employ differential sensing to achieve a high SNR. However, for such a concurrent differential sensing method, the multi-touch cancellation problem described above still remains as the cause of a critical TSP malfunction, a false-negative detection.
Therefore, the proposed touch position recovery method is an effective approach to both differential sensing and concurrent differential sensing methods.
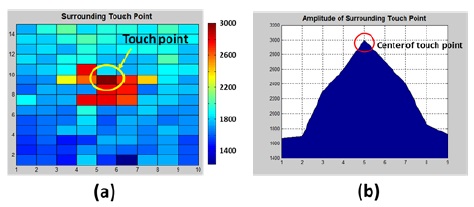
When a human finger touches a screen, not only the touched point but also its adjacent points experience changes in the mutual capacitance. This follows from the fact that TSPs usually have a small spacing between the crossing points for a high resolution. For example, Fig. 6(a) illustrates a touch point sensed using the single-line sensing method. The yellow circle indicates the center point of the touch position. The orange and the red squares denote the adjacent points affected by touch. The mutual capacitors of the adjacent points experience smaller capacitance changes than the center point. The blue squares shown in Fig. 6(a) represent untouched points. Fig. 6(b) shows the amplitude variation at the center and the adjacent points of the touch position. Fig. 6(b) has only one summit, and therefore, the software algorithm can easily determine the touch position by searching for the highest value. However, this method would not remove the noise.
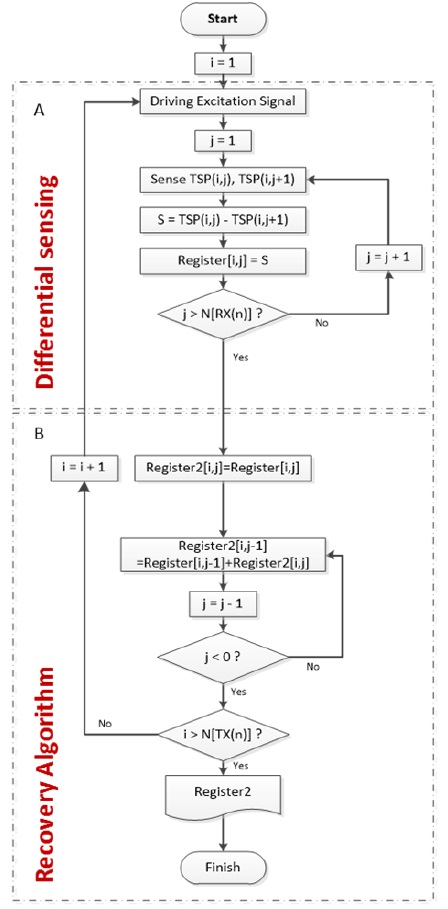
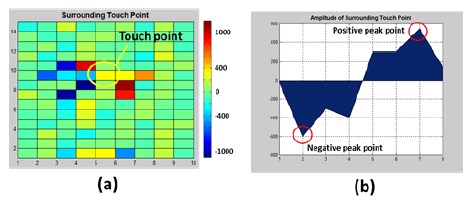
Fig. 7(a) shows the result of the differential sensing method. Depending on which RX line was touched, its differential integration result can be either a positive or a negative voltage. The amplitude variation shown in Fig. 7(b) appears as one positive and one negative summit. Therefore, in contrast to the single-line sensing method, the differential sensing method needs a special algorithm to accurately recover the touch positions. One such algorithm is proposed in this section. Fig. 8 depicts a flow chart of the proposed algorithm. The algorithm starts with a differential sensing step, which iteratively scans all RX lines of the TSP. Each sensed data sample is stored in the memory after the ADC. Once the differential sensing step completes the scanning of one frame, the recovery algorithm step begins.
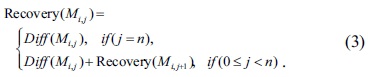
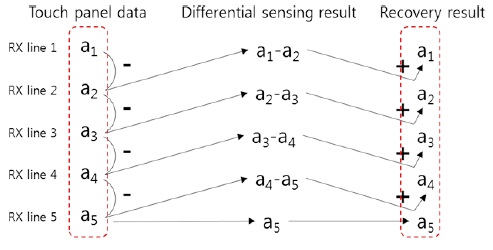
The remaining steps of the proposed algorithm are to find the peak values and to determine their positions as the touched points. The proposed algorithm iteratively processes two data samples and accumulates the intermediate results throughout all the RX differential data over each TX line. One of the two data samples is the intermediate result calculated in the previous iteration, and the other data sample is the next differential data sample read from the memory. The key recovery process of the algorithm involves adding these two data samples, as expressed in Eq. (3). It recovers the original touch points traversing backwards from the final differentially sensed data towards the first differentially sensed data.

For example, Fig. 9 illustrates how the proposed algorithm recovers the original touched points in a TSP. The first column shows a set of raw RX data for one TX line. The second column gives the intermediate results of the recovery process of Eq. (3). The third column shows the recovered RX touched data corresponding to the raw data. It is observed that the recovered results are not exactly the same as the raw data, but they have enhanced touch data with lower noise than the raw data. This enhancement is the consequence of the following advantages of the proposed method. While its differential sensing step can eliminate most of the common-mode noise, the accumulation process of its recovery step can further suppress the high-frequency random noise. An example is given in Section IV.
In addition, the proposed algorithm employs only simple accumulation operations; therefore, it can be easily implemented using low-cost hardware or possibly even software. Furthermore, it enables the simultaneous processing of an unlimited number of multiple touches with little overhead on the processing time. This is a significant advantage over the previous differential sensing approaches.
The proposed algorithm has been implemented on the top of our touch screen controller system on a chip (SoC) design employing a differential sensing circuit. The differential sensing circuit in the SoC consists of a differential integrator, a rotating auto-zeroing offset cancellation circuit [17], and an ADC supporting 8 bits. The rotating auto-zeroing offset cancellation circuit can eliminate the mismatch of the differential amplifier and thus, allow an accurate measurement of the difference between two adjacent cells.
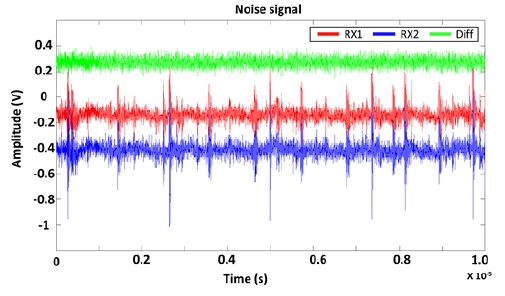
This sensing circuit has been implemented using a Magnachip/SK Hynix 0.18-μm CMOS process. To accurately evaluate its performance, we applied to the simulation the actual noise signals measured from a 23-inch commercial TSP. Fig. 10 illustrates the measured noise, where the blue and the red signals represent the noise signals measured from the RX lines RX1 and RX2, respectively. The green signal represents the differential signal obtained by subtracting the blue and the red signals.
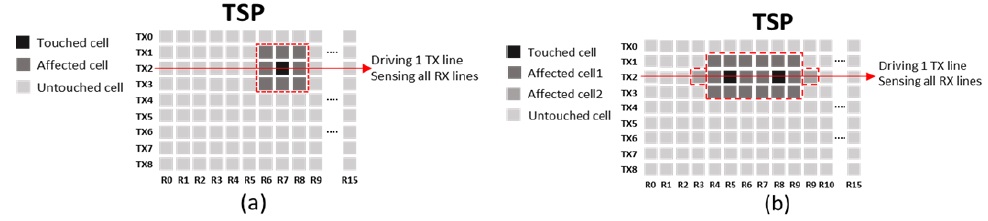
To evaluate the operation and the performance of the proposed method, we conducted extensive simulations by using an accurate TSP model with 9 TX lines and 16 RX lines. We drove pulse waves onto one TX line, and read out each pair of RX lines sequentially. We considered two touch cases:
1) TSP has one touch point and 8 surrounding points as shown in Fig. 11(a).
2) TSP has two touch points and 18 surrounding points as shown in Fig. 11(b).
In each iteration of the differential sensing step of the proposed algorithm, the ADC receives 15 differential data samples since there are a total of 16 RX lines. In the case of Fig. 11(a), the following four differential pairs are expected to observe large differential values, while others show very small values: RX(5,6), RX(6,7), RX(7,8), and RX(8,9). Similarly, in Fig. 11(b), nine differential pairs are expected to show large differential values.
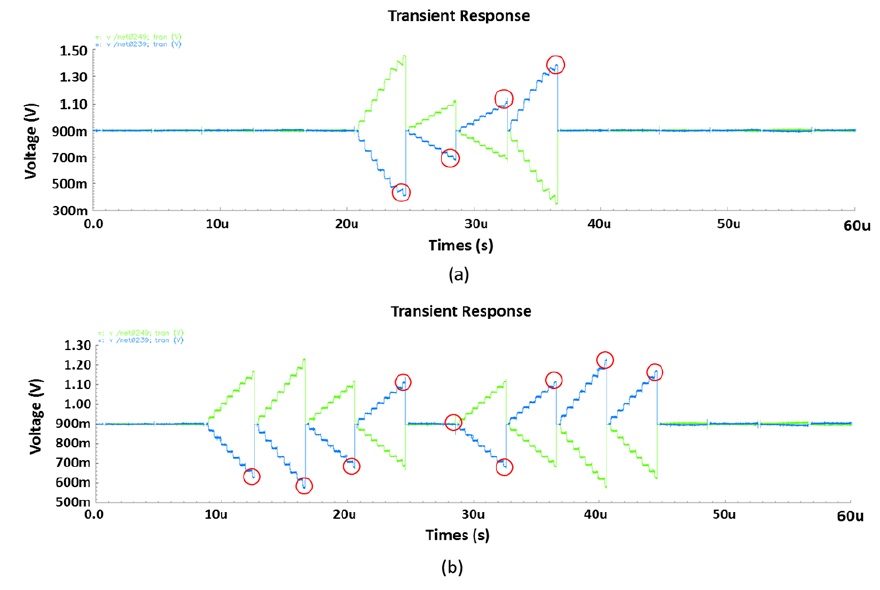
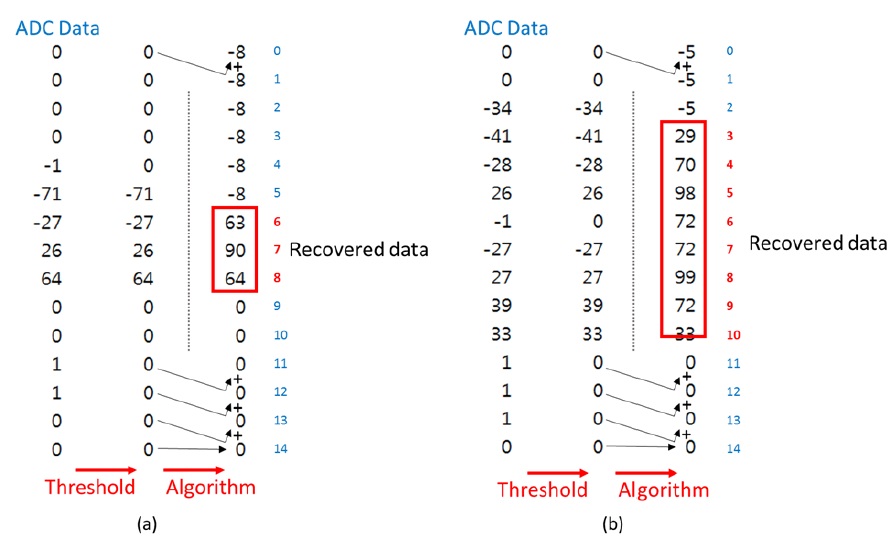
Fig. 12(a) shows the integration results of the simulation experiment illustrated in Fig. 11(a). While the four differential integration values show large values as marked by red circles, all other integration values are negligible, since their RX signal pairs have similar values. Similarly, Fig. 12(b) shows the integration results of the simulation experiment illustrated in Fig. 11(b). There are nine differential integrations that have large values. The resulting differential integration values are sampled by the ADC. Then, the sampled ADC data are processed by the proposed algorithm. Fig. 13 illustrates the calculation process of the proposed algorithm for the two examples illustrated in Fig. 11(a) and (b). In this experiment, we applied a threshold to filter out noise signals that are less than the threshold. Therefore, it can enhance the untouched signals and further improve the detection performance. After the proposed algorithm recovers the original touch strength values, we can select the peak values and their positions as the touched points.
For the example of the recovered values shown in Fig. 13(a), the peak value of 90 is the touched point. The slightly lowered values, 63 and 64 around 90, are the affected points surrounding the touched point. Note that the amplitude of the recovered values look like the amplitude of the single-line sensing case illustrated in Fig. 6. For another example, the recovered values shown in Fig. 13(b) have two peak values, 98 and 99, which indicate the two touched points.
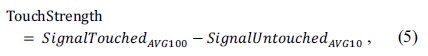
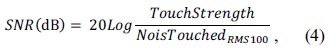
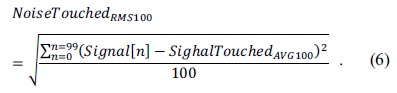
We calculate the SNR by using Eqs. (4)–(6). These equations are commonly used for measuring the performance of the touch screen detection methods and circuits. Therefore, using these equations, we calculate the SNR gain of the proposed algorithm to be 52.21 dB (42.17 – (–10.04) dB). Here, 42.17 dB is the SNR of the recovered signals based on the proposed algorithm, while 10.04 dB is the SNR measured at the RX lines of the TSP under experiment.
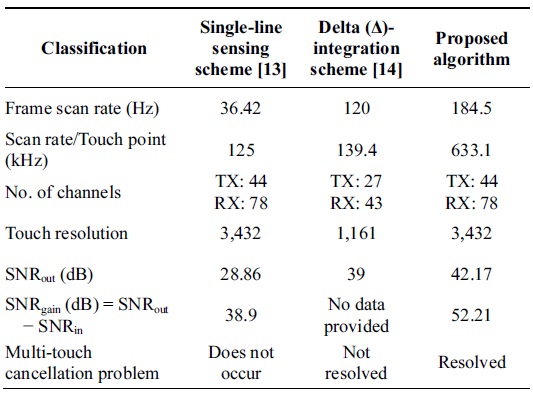
Table 1 compares a single-line sensing method [13], the delta-integration method [14], and the proposed method conducted an experiment with a real TSP that consists of 44 TX and 78 RX lines. While the previous methods provide the output SNR of 28.86 dB and 39 dB, respectively, the proposed method presents the output SNR of 42.17 dB. The proposed method provides a higher SNR than the single-line sensing scheme, owing to its common noise cancellation ability. On the other hand, the proposed method performs better than the delta-integration method, since the proposed recovery algorithm can filter out the remaining noise and maintain the high-resolution sensing data.

[Table 1.] Performance comparison table

Performance comparison table
Although differential sensing methods provide a better SNR than single-line sensing methods, they often suffer from the multi-touch cancellation problem. In this paper, a simple but highly accurate algorithm was introduced, which recovers the multi-touch values from differential sensing values. It can accurately recover not only the multi-touch positions but also the strength of the touches. The proposed method recovers the touched values by using the high-resolution ADC-sampled data. Therefore, it can provide a substantially higher accuracy than a previous method such as [14] without sacrificing the processing speed and the hardware cost. In addition, it is highly effective in detecting touches with very small touched areas, which was not addressed by the previous work [14].
The proposed method consists of only an adder and a comparator, and therefore, it allows a low-cost chip implementation with a negligible area overhead. Simulation experiments have shown that the proposed recovery algorithm provides a high SNR gain of 52.21 dB even before applying any noise-filtering process.