The confinement of ions in a quadrupole Paul ion traps are well known process and has outstanding applications in sciences and technology.1-4 Since the Paul ion trap was employed as a mass spectrometer, cooling (damping) process has become very important as successful damping improves the sensitivity and resolution of the ion trap performance.5-8 As we deal with the confinement of a non-neutral plasma in a Paul ion trap, buffere gas cooling becomes significant.9
Theoratically, the damping force F is assumed to be proportional to the velocity ν of the confined ion such as F = -mγν, where m denotes the ion mass, and γ depends on the mobility of particular gas and has unit of s-1. In generall, for non-energetic confined ion (up to few eV) the mobility is approximetly constant.10 Under the damping force, the Mathiu differential equations11 should be modified and in the u direction, r or z, may be written;
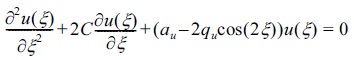
and the stability parameters
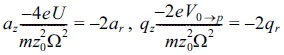
and 2
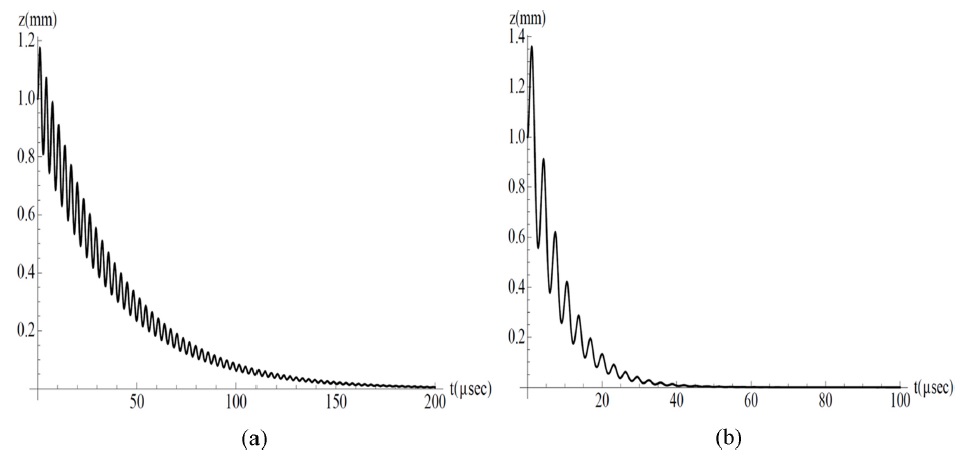
The influence of damping force on the ion motion has been studied using two
The existance of the buffer gas in the Paul ion trap caueses the ion cloud to move to the central region of Paul ion trap and increase in the ion signal detections. The purpose of this work is to show experimentally the effect of cooling (damping) ions with buffer gases in a homemade Paul ion trap. All componenets of the trap including the rf generator, the electron gun, trap electrods, the detection system and timing system are made in our Lab.
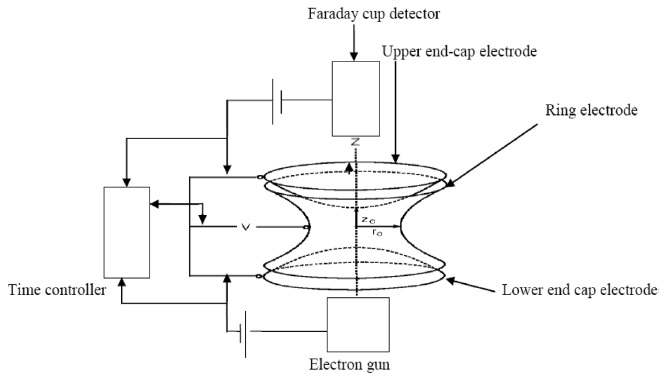
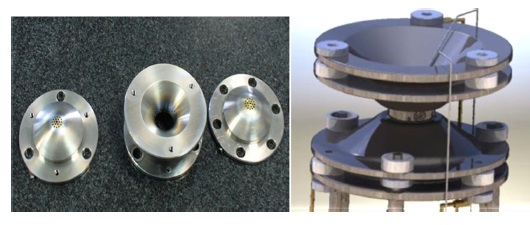
The Paul ion trap electrods are made of stainless steel 316, Figure 2. The
The lower and uper end-cap electrodes have 6 small holes, each 0.1 mm in diameter pass the electrons into the ionization volume and then ions get through the detector, respectivly, see Figure 3. The ion trap geometry is stretched hyperbolicly to have higher confinement efficiency. The truncation of the electrodes has been made at 3
The trap is set up in a vacuum chamber of volume 0.0147m3 and pumped with a turbo-pack up to pressure 10-5 mbar. The rf voltage is connected to the ring and end-cap electrodes in the mass-selective instability mode. An electron gun supplied the flow of the electrons is situated below the lower end-cap electrode. The Tungsten filament uses 0.46 A, and 9 V and a constant current circuit generates a constant follow of electrons. The acceleration of electron is made by -110V with respect to lower end-cap electrode. The ejection voltage applied between Faraday-cup and the upper end cap is up to -300 V, choosed in a way that during ejection phase ions sees fairly same voltage.
The variable time delay of the duty cycle depends on the experiments. Here, a delay time of 50-1000 μs is used in the experiments. The rf voltage can produce up to 350 V0→p (zero to pick) with 650 kHz and more. It is important to indicate that the times; electron acceleration time, the time of confinement and the ejection times can be adjusted through a 10 canals circuit with LVTTL controled by Labview program. The output signals from the detector can be visualized and memorized by oscilloscope providing 2500 data on the Excel software can be used for Origin-pro software.
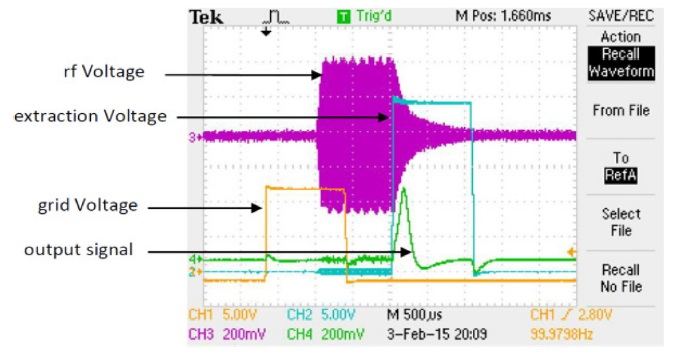
Figure 4. displays a typical Ar+ ion together with rf signals, electron accelerations voltage (grid voltage), and ejection voltage, respectively. The ion signal depends on some parameters including the ejection time and voltage amplitude.
For a more comprehensive ions signal, one should trigger the ejection voltage, whenever, the rf confinement voltage is nearly stopped, see figure 4.
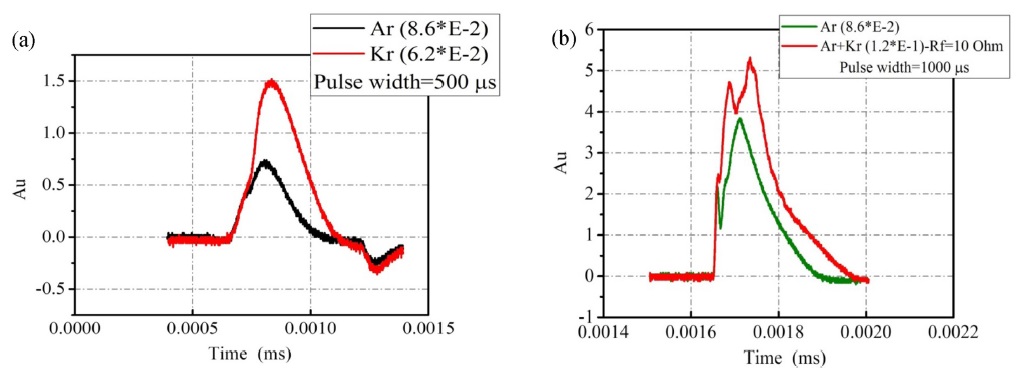
Shown in Figure 5 is a He buffer gas cooled ion scanned signals; (a) separated Ar+, Kr+ and (b) a mixed Ar+ + Kr+ scanned, respectively. As seen, at separately scanned masses, one easily obtains ion trapping and an acceptable signal. At mixed scanned, one observes a low resolution, caused by Paul ion trap rf voltage accuracy (13 V), which the limit of stability diagram of ions might be missed for ejection.
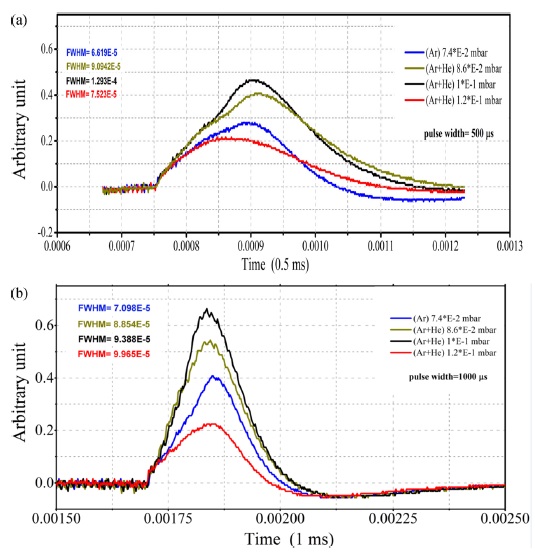
Some experiments with the goals of comparing He and Ne buffer gases cooled Ar+ ions are carried out. Shown in Figure 6 (a) and (b) is a signal from Ar+ cooled by a He buffer gas.
At 500 μs time of confinement, one easily obtains fast cooling; while, at higher 1000 μs time of confinement one observes the amplified Ar+ ion signal. These amplifications can be due to Ar+ ion reorganization towards the trap center.
At the pressure of 7.4×10⁻² mbar, and a time of confinement of 500 μs, the average Ar+ ion cloud temperture 1787.9 K, using the relationship is calculated, where
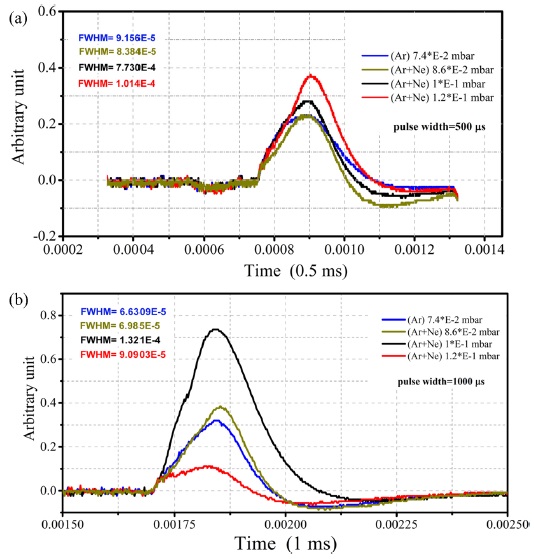
The same experiment is carried out with Ar+ ions cooling with heaver Ne buffer gas at 1000 μs confinement time. The acquired resluts is depicted in Figure 7 (a) and (b). Here, for Ar+ ions pressure of 7.4×10⁻² mbar, the average ion cloud temperture is 1774 K and ulternatively, for the mixed Ar+ + He pressure of 1 × 10⁻¹ mbar, the averge cloud temperture reduces to 448.3 K.
The observation of the results for Ne cooling buffer gas can quentitivly be understand, as Ne has heavier mass than the He buffer gas, a better ions signal is obtained; the longer time of confinement, the higher number of collisions occures, so, a better damping will arise. He is good buffer gas for fast cooling process, tens of μs confinement time, nevertheless, for a good quality signal, one should consider higher confinement time for ions reorganize themselves toward the trap centr. Finally, the experimental results for the mixed gases acquire low resolution due to lower pricision in rf voltage, i.e. a minimum of 13 V. However, a satisfactory results was found for the scanned singls of sample, the damping process can be done susesfully.