Evaluation of retrieval systems is mostly limited to laboratory settings and rarely considers changes of performance over time. This article presents an evaluation of retrieval systems for internal Web site search systems between the years 2006 and 2011. A holistic evaluation methodology for real Web sites was developed which includes tests for functionality, search quality, and user interaction. Among other sites, one set of 20 Web site search systems was evaluated three times in different years and no substantial improvement could be shown. It is surprising that the communication between site and user still leads to very poor results in many cases. Overall, the quality of these search systems could be improved, and several areas for improvement are apparent from our evaluation. For a comparison, Google’s site search function was also tested with the same tasks.
Search tools for Web sites are important for users to find relevant information on a site quickly. For the site provider search tools are a crucial technology in order to make products and services available.
The importance of site search systems can be seen by looking at their frequency. We analyzed some 50,000 sites from the DMOZ open directory in 2012 and checked whether an HTML form with a term related to search was available on the homepage. Overall, 26% of the sites contained at least one search field, 2% of them with even two or more fields. In online shops, the numbers are much higher. In 3319 sites extracted from shop categories in DMOZ, 47% contained a site search. In these sites, 4% even had two or more search forms. Search technology is widespread and there are millions of site search installations.
In contrast to horizontal or general Web search, vertical search does not encompass the entire Web but merely a defined subset which is often defined by a domain. Site search systems allow the users of a Web site to search the content of this particular site. Site searches are an important tool for communication between user and organization and they can have an impact on the economic success of organizations. The results should not be left to the possibly unexpected outcome of some algorithm but rather should be carefully monitored and evaluated.
Despite their importance, these tools are hardly evaluated in a comparative manner or over time. Nevertheless, it is important for organizations to know how well their system works for their users and in comparison to their competitors. For the evaluation of these tools, little methodology from retrieval evaluation can be adopted. There are two main paradigms for retrieval evaluation: lab experiments following the Cranfield paradigm and user experiments. Both are not suitable for the evaluation of real site search systems because they require a high level of standardization for the test environment, e.g. in using the same document collection for several systems or the same user interface for several test users.
We have conducted a thorough longitudinal evaluation of three sets of site search systems. One of the sets was evaluated three times in different years and twice compared to Google site search. The evaluation is based on a benchmark of over 70 individual tests which focus on the result quality, the functionality of the index and the tool, as well as the interface and the user interaction. The goal of our series of analyses is not to rank sites but to describe the state of the art of site search in general and to observe longitudinal trends.
The results show that despite substantial investment in site content and search technology, the site searches do not perform well and no substantial improvement could be shown between the years 2007 and 2011. Many benchmark tests failed for many sites. This shows areas for potential improvement.
This section briefly reviews work on information retrieval evaluation and on the analysis of evaluation results over time.
2.1. Information Retrieval Evaluation
Information retrieval is a key technology of knowledge management today. A retrieval system consists of several components and an implementation requires many heuristic decisions (Mandl & Womser-Hacker, 2015).
Evaluation in information retrieval has a long tradition. Systematic empirical experiments date back to the 1960s (Robertson, 2008). The standard approach is called the Cranfield paradigm. It consists of a collection of documents, topics as descriptions of potential information needs, and relevance judgments by jurors which state the relevance values for many documents and the topics (Borlund, 2013). Typically, after the experiments of the participating research groups, the organizers initiate the intellectual relevance assessments and publish comparative results based on statistical measures. Mostly, these experiments focus solely on ad-hoc retrieval or informational queries in which the user intends to get generally informed about a topic.
The Cranfield evaluation methodology is focused on identifying the performance and retrieval result quality of an algorithm. The influence of different users who necessarily introduce bias through heterogeneous competencies, cognitive styles, and contextual factors like time pressure or previously identified documents is neglected.
These factors are considered in user centered evaluations which claim to be more realistic in observing interactions between humans and systems as they may happen as part of real life information behavior (Borlund, 2013). In order to allow comparisons and to measure a specific effect, some aspects of the situation are modified (e.g. user interface, some value added components) while most factors are kept stable (Järvelin, 2009; Kelly, 2009).
2.2. Improvement of Technology over Time
There is little research on the improvement of information systems over time. It is much easier to compare hardware to previous generations but the evaluation of software is more difficult. Comparisons over time are rare, especially for retrieval systems. Zobel et al. (2000) argue that even search time as a performance measure has not improved dramatically over 10 years despite the quick and steep growth of computing power.
Armstrong et al. (2009) doubt whether retrieval algorithms have improved in search performance between 1994 and 2009. During these years, many experiments were conducted within the Text Retrieval Conference (TREC) and continuous progress was reported. But Armstrong et al. (2009) could not find empirical evidence for an improvement when running comparisons between original systems of 1994 and current systems with optimized algorithms.
As e.g. Kemp and Ramamohanarao (2002) stated, it is widely believed that Web search systems can learn from user interaction (click-through data) and improve their results. Thus, it could be assumed that site search systems have also improved over the last few years. Another reason for assuming that systems get better could be the large investments of organizations in their Web content. It would be wise to allow users to find the information for which much money was spent.
For user centered evaluations of retrieval systems, longitudinal studies are also rare and mostly refer to behavior in so-called multi-session searches. Merely a small number of studies based on log files go beyond a few weeks (e.g. Adar et al., 2008). None of them claims to observe the continuous improvement of search technology.
3. RESEARCH METHOD FOR SITE SEARCH EVALUATION
The evaluation is based on a multi-criteria benchmark which considers mainly the functionality of the site search and its result quality. The benchmark requires no knowledge about the internal system and is based on the user perspective. No information about the installed back-end or its components was collected.
A Cranfield-based experiment can hardly be carried out for site search systems in real life. The document collection behind each of the systems to be evaluated is different and as a consequence not all systems can be compared on the same collection. The amount of documents within the collections is unknown even for the observer. Each site typically presents an organization and as such, each system enables access to its own document collection. The information needs which need to be fulfilled will also have little in common. Even for identical information needs, like “Does the organization have any job offers?” the answer will not be identical. It can be easily seen that information needs and relevance judgments cannot be shared for a common evaluation pool as it is necessary for the Cranfield paradigm. In addition, an evaluation of site search needs to consider not only informational queries but also navigational and factoid queries.
It would also be hard to design a user experiment (Borlund, 2013) for the site search systems because the information needs cannot be identical and because they comprise different user interfaces as well. Too many variables cannot be kept stable to design a useful experiment which allows conclusions.
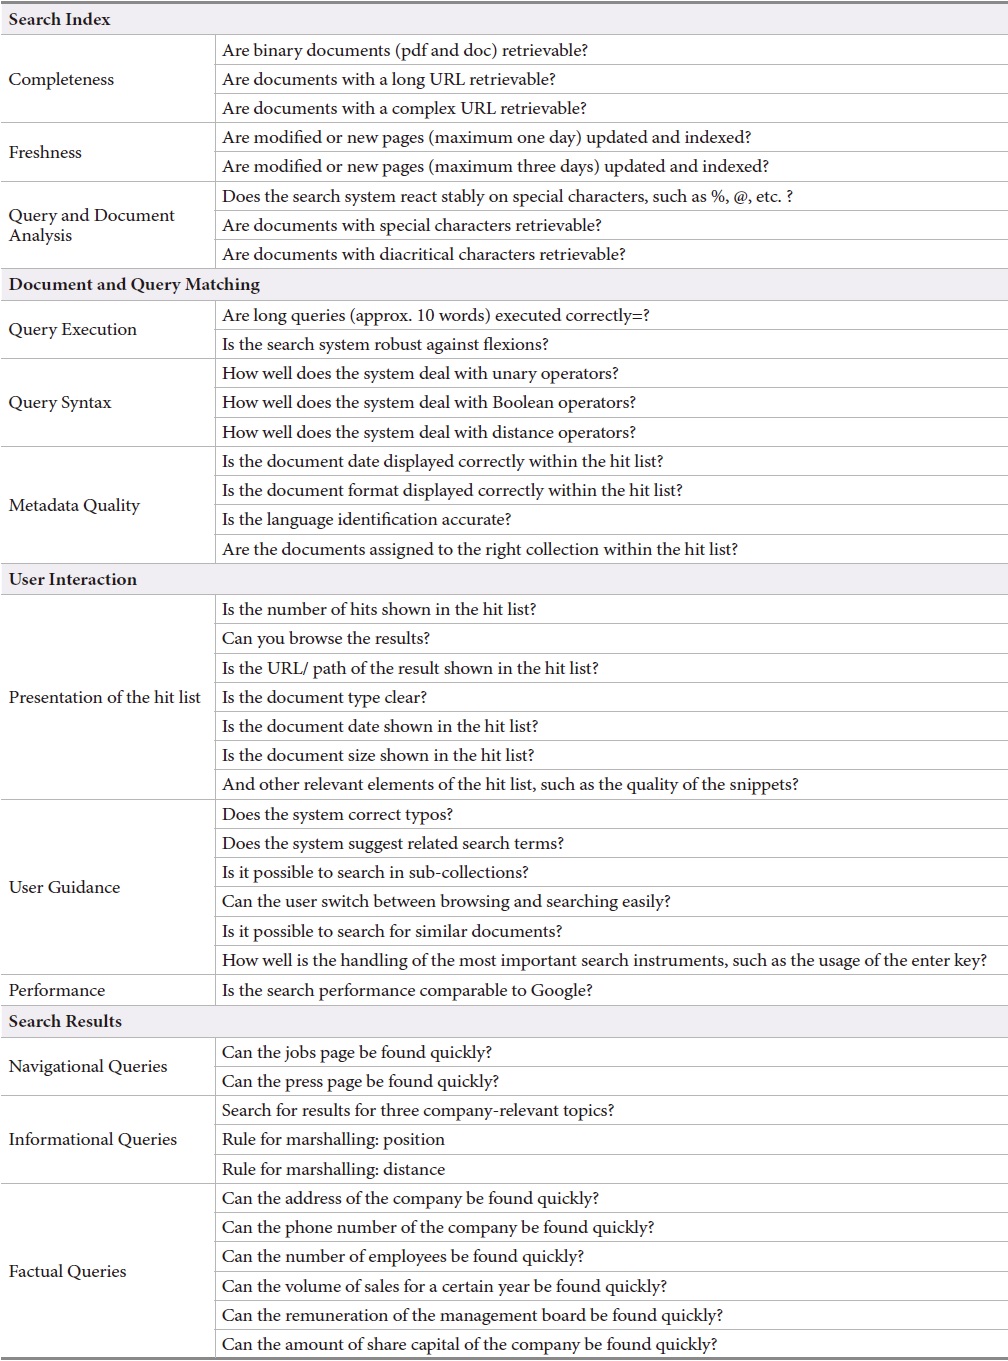
As a consequence, the methodology developed adopted a benchmark approach which includes 74 test criteria organized into four main categories:
[Table 1.] The Evaluation Framework and its Features

The Evaluation Framework and its Features
The first main category
The main category
The main category
The performance considering
The information tasks depend on the organization. They were developed for each site individually during the assessment for the benchmark. The navigational and factoid tasks were designed in a general way so that they could be used for all sites. The navigation queries target, for instance, the jobs page and the media page of the organization behind the site. The facts were also carefully selected for each organization. Examples include the number of employees, the address, the telephone number, and the name of the director of the board.
The number of tasks is smaller than the number of topics in evaluations based on the Cranfield methodology for which typically 50 topics are used. The measure only allows three levels of quality. A more detailed measure would not be adequate because the systems are too different to be compared. Furthermore, the development of further information queries would be too expensive. More detailed measures would also require relevance judgments for many more documents which would be unrealistic for most usage scenarios. The jurors should also not be asked to judge on a simple binary scale.
This evaluation is not aiming at a reliable ranking of the systems. Nevertheless, we assume that the overall state of site search is well represented due to the large number of tests and systems. Furthermore, the benchmark reveals tests for which many search systems do not perform well. These are areas and functions for which improvement is necessary.
The first evaluation study focused on professional Web sites of large enterprises in Switzerland and Germany. The first set evaluated comprises 56 large Swiss companies and was investigated in 2006 (Braschler et al., 2006). This set is hereafter called S’06. The same test was carried out for a set of 35 large German companies in 2007 (Braschler et al., 2009). For a subset of 20 of these German sites, the test was repeated in 2010 (Uhl, 2010) and 2011 (Gätzke, 2011). These sets are called G’07, G’10, and G’11, respectively. In 2010, a set of 40 media companies, called Media ’10 was also assessed (Uhl, 2010). Examples are shown in Table 2.
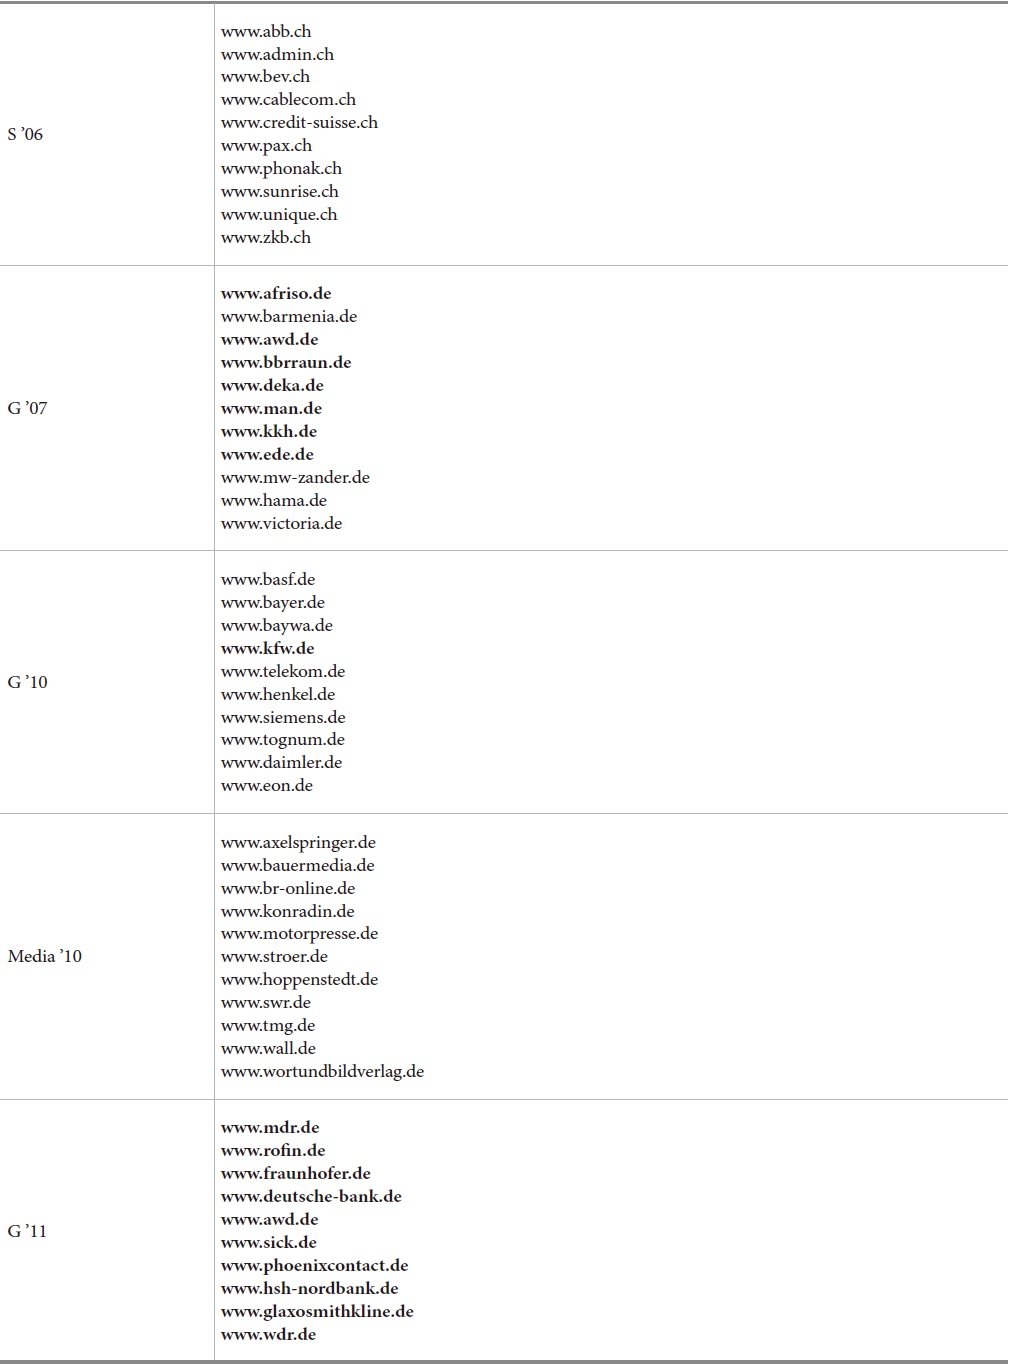
Examples for the Evaluated Websites. The subset of 20 German industry sites (G’07, G’10, G’11) is shown in bold
4. RESULTS ON THE PERFORMANCE OF SITE SEARCH SYSTEMS
The following sections show the results of our series of studies. The results for the individual sites are not shown but the results are presented as box plots which show the distribution of the quality values of the sites. The results of the test cannot tell whether one specific product for site search is superior or not. The test judges the perception for the user. As such, it evaluates concrete installations of a product at a site, the specific collection, and it includes the management policies and other contextual factors.
Most results are presented as box plots. These plots are well suited to visualizing statistical data as presented in our study. The shape of a box plot represents the range of the data set by displaying five statistical characteristics. The maximum and the minimum values are indicated by the ends of the line. The box displays the median (indicated by the line inside the box), the upper, and the lower quartile.
The overall results are shown in Fig. 1. It shows the average for all criteria for the four German sets tested. The results of the Swiss set have to be omitted. For this set, the detailed dataset was not available. Overall, no clear trend for improvement can be seen in our results. It needs to be pointed out that the Media ’10 set differs from the main set of German sites. The performance of the sites reveals that search technology could be improved. There is much to be desired. The following sections will give the results for the four main criteria.
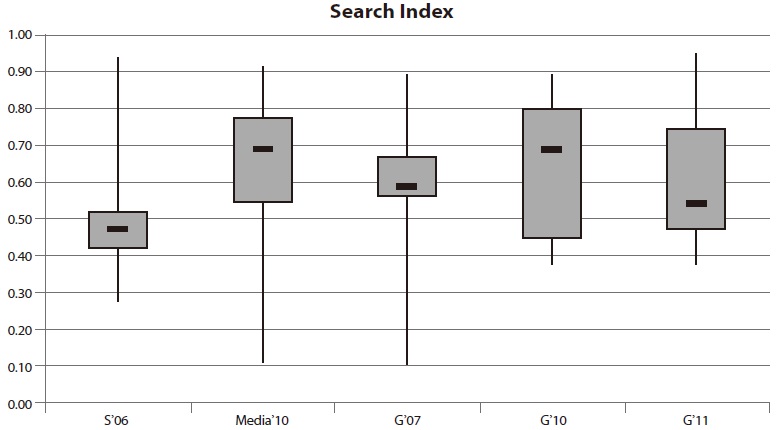
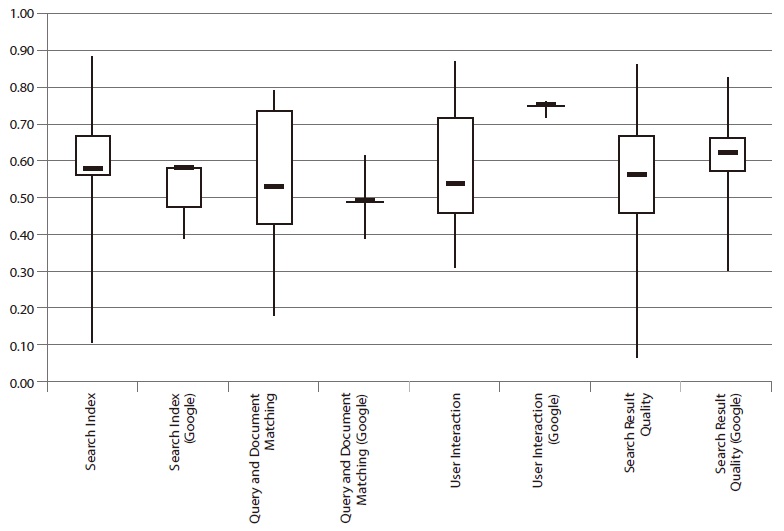
The first criterion judges the completeness, the freshness, and the query/document analysis of the search index within a site search application. The evaluation takes into account whether or not PDF and doc documents can be found and whether the update frequency is accurate. Besides this, an assessment of processing words with special characters, such as $ and %, is performed. The results are illustrated in Fig. 2.
There is a significant difference between the statistical values of the four evaluations. The range of the data shows especially vast variation. The maximum values of all sets vary to some extent, with a lowest performance of 88%. A result of 100%, however, has not been achieved for any set. The median for the Swiss applications S’06 is lower than 50% and thus the poorest performance in the group. The medians for the other evaluations range between 50% and 70%. The worst site search performances were observed within the media websites Media ’10 and during the evaluation for the German set in 2007 (G’07). The minimum values of these subsets are less than 15%. In contrast, all measured performances in 2010 and in 2011 were above 35%.
Although an improvement of the median can be seen between the evaluation in 2007 and the evaluation in 2010, there is a negative trend in 2011.
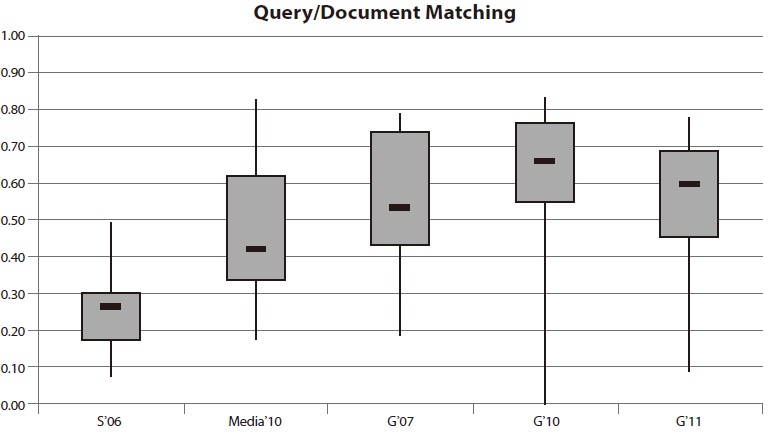
4.3. Results for Query and Document Matching
The category
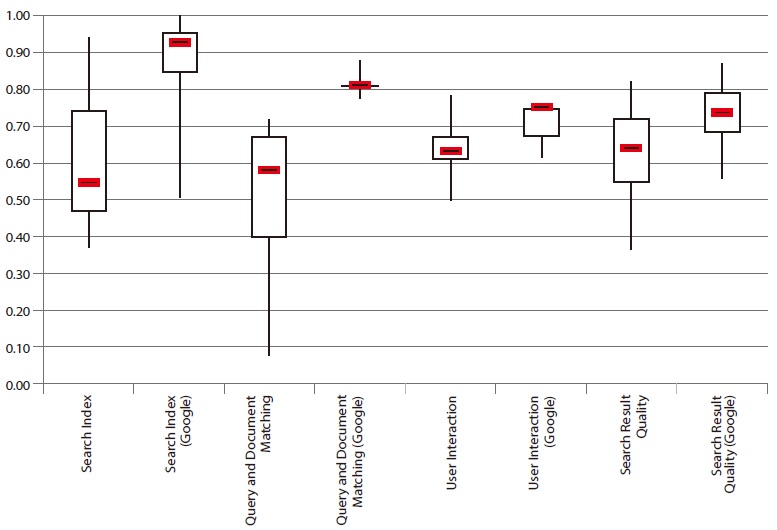
The results in Fig. 3 do not meet expectations: In all evaluations it seemed that site search operators pay only little attention to metadata, although it could improve the quality of search. The apparent lack of metadata quality is reflected in the results.
The median performance ranges from 26% within the Swiss evaluation to 66% in 2010. The maxima of all evaluations show remarkably low values of more than 80% in only two main criteria. As well as within the category Search Index, compared to the overall result the worst performers were the Swiss websites. Thereby, none of the tested searches were able to achieve a performance above 50%.
The results of site search on media websites, which in view of their wide information offerings have to provide good metadata quality as well as an accurate evaluation of long queries, are far from optimal achievement. The average performance remains minor and barely above 40%.
The performance of the 20 site searches on German websites shows fluctuating values. The minimum measured in 2007 is around 20%. In 2010, there was at least one search application which failed for all tests. Within the third evaluation, the minimum performance increased to 8% and still remains unsatisfying. Median performance also varies between 53% in 2007, 66% in 2010, and 60% in 2011. There is ample room for improvement.
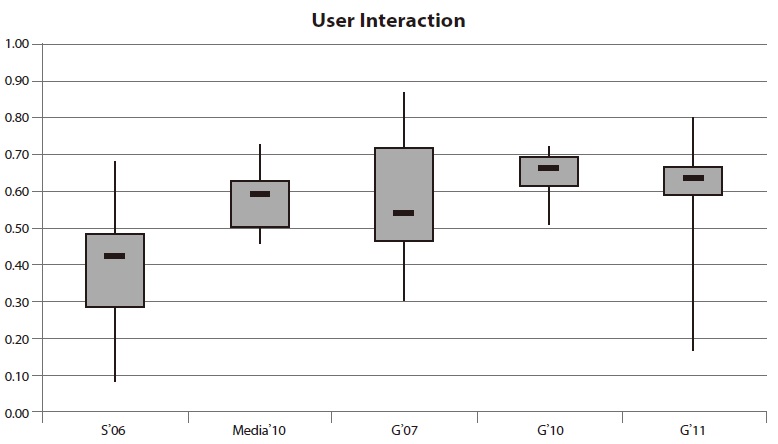
4.4. Results for User Interaction
The category
The results for the tests concerning the hit list reveal quite negative results. User interfaces for site search systems should try to resemble the user experience of popular web search engines (Shaikh & Lenz, 2006). Most users have gotten accustomed to certain principles of interaction with search engines. Deviations from these standards may lead to confusion.
The maximum values demonstrate that there are systems which are similar to the user interface of the web search engines. The majority of the systems, however, take a different approach. Once again, the worst performance within this category was measured during the Swiss evaluation. The median value of 42% and the maximum performance under 70% are the poorest compared to the other websites. On the one hand the performance of site search on media websites is convincing through a good minimum of nearly 50%. On the other hand, the maximum value of 73% is a sign of great potential for improvement.
The results of the 20 German site searches which were evaluated three times show remarkably different variances. The first evaluation is characterized by an inter quartile range of more than 25% and a relatively high minimum and maximum performance. During the second evaluation a small inter quartile range was measured. More than half of the search applications were below 60%.
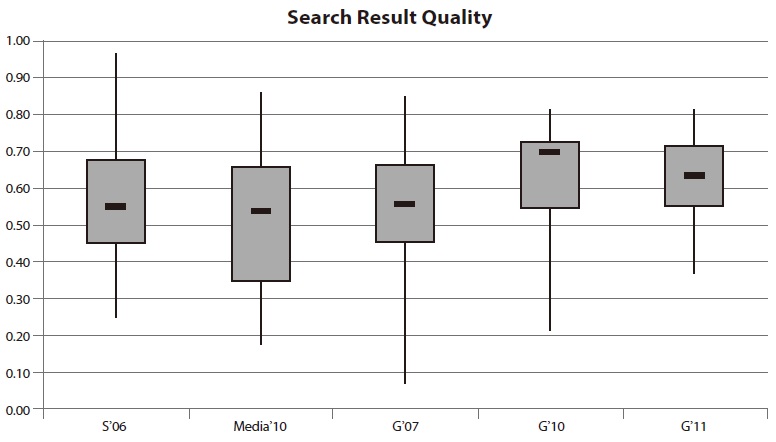
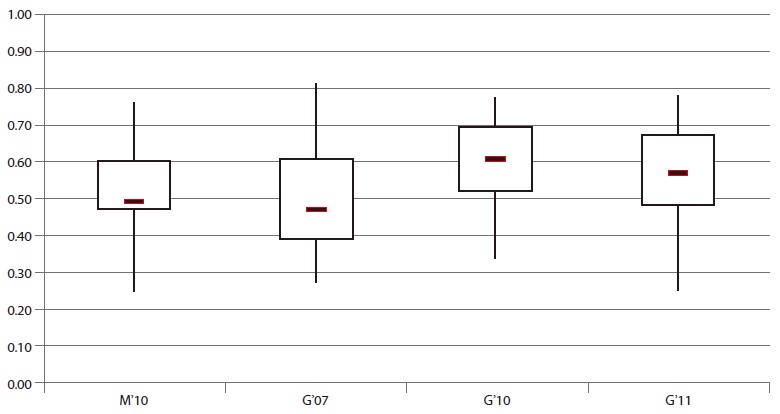
4.5. Results for Search Result Quality
The quality of search results is evaluated on the basis of navigational, informational, and factual queries. In comparison to other categories, the evaluated search applications achieved a relatively good search result quality (see Fig. 5). In contrast to the figures so far described, the results for the Swiss site searches do not attract negative attention. The best performer was very close to 100% and was also the best system in comparison to all German site searches within this category. The results of search functions on media websites disappointed expectations, with very low values.
4.6. Results in Comparison to Google Site Search
A first comparison between the site search tools and the Google search limited to a site was carried out for the Swiss set (Braschler et al., 2007). It revealed that Google did not always perform better than a site search. Compared to the evaluated site searches, Google lies slightly ahead of the average but does not deliver the best results (see Fig. 6). Within the categories
For
5. INTERPRETATION AND DISCUSSION OF RESULTS
The series of evaluation studies revealed large potential for improvement. The median performances often fluctuate between 20% and 70%. Many systems do not meet three quarters of the requirements that were set. In particular, the categories
The results on the performance of site search systems showed the following findings:
• The variation between different systems is extremely large over all four main categories. • The systems do not constantly and clearly improve over time. The comparison of four evaluations revealed a slight improvement, but there is still a large potential to increase in performance. • Some systems outperform Google site search, but many do not even reach the performance of a vertical search engine for their own data.
The subsequent sections discuss the internal reliability of the result data, future improvement of the methodology, and the lessons learned for site search technology.
There are three main criteria, which define the quality of a test: objectivity, reliability and validity. The reliability describes to what extent test result are free of measurement errors. There are various metrics methods for reliability. One of them is the internal consistency, which measures the homogeneity of a scale. A high internal consistency signifies that several items of a test generally measure the same concept. The most common indicator for internal consistency is Cronbach’s alpha (Cronbach, 1951). Higher alpha values are associated with a more stable test result. Stability means that measurement errors have little influence on the entire test.
For the interpretation of Cronbach’s alpha, Wittenberg (1998) suggested the following convention:
α <0.5 No sufficient reliability α≥ 0.5 Sufficient reliability α≥ 0.7 Satisfying reliability α≥ 0.9 High reliability
The estimation of the reliability for the evaluation framework used in our analysis was carried out with SPSS and produced the following results:
[Table 3.] Reliability Statistics for the Complete Framework with 101 Items
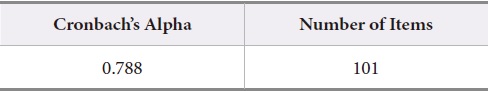
Reliability Statistics for the Complete Framework with 101 Items
The complete evaluation benchmark indicates a satisfying reliability of almost 79%. As already mentioned the benchmark has been modified by Gätzke (2011). In total, the analysis of the Boolean and distance operators, the display of document size within the hit list, and the availability of HTML versions of binary documents were excluded. Cronbach’s alpha for the reduced evaluation framework according to Gätzke (2011) is shown in Table 4. Cronbach’s alpha does not change significantly and still represents a satisfying reliability. Thus, we can assume that the reliability of the overall benchmark results is quite good.
[Table 4.] Reliability Statistics for the Modified Framework with 93 Items
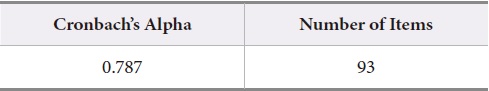
Reliability Statistics for the Modified Framework with 93 Items
The evaluation framework has been used several times since 2006. Over the years, some functions and aspects of web search technology have appeared while others may have become more obsolete. Currently, the live suggestion and completion of search terms is expected by users while it was still not implemented in 2006. It needs to be integrated as a test into the benchmark. The use of Boolean operators has decreased fundamentally. It can be doubted whether they are expected by users and whether their existence in the benchmark is still justified. In addition, research shows that Boolean Logic tends to confuse the average user, rather than to help in finding the needed information (Jansen, Spink, & Saracevic, 2000). For this reason, Gätzke (2011) suggested removing the testing of Boolean and distance operators from the evaluation framework.
In addition, some tests gave identical results for almost 100% of the sites. Consequently, tests are not appropriate for comparing site search systems. These items have been removed and should be removed in future tests. They include the analysis of Boolean and distance operators, the display of document size within the hit list, and the availability of HTML versions of binary documents.
All results given in the paper are based on the adapted set of tests except for the Swiss set S’06. Overall, as mentioned, none of the items in the benchmark scored dramatically different over the 6 years in which the benchmark has been used. In future work, the evaluation framework would need to be updated to current technology, e.g. to the quality of auto suggest (Furtner et al., 2015) and other value added search support tools.
5.3. Potential for Improvement
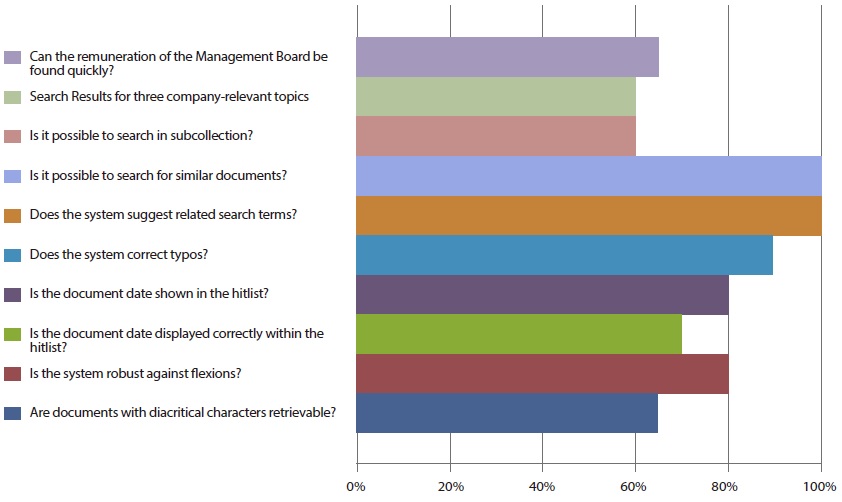
Our evaluation aims at showing potential for improving site search systems. We can identify very common failures by showing the worst performing tests. Fig. 8 shows these with the percentage of sites which did not pass the test in 2011.
These problems can be fixed with current technology, but many sites fail to pass these tests. Consequently, these functions can be a starting point for improving many existing site search systems. The most problematic issues were fairly stable over time.
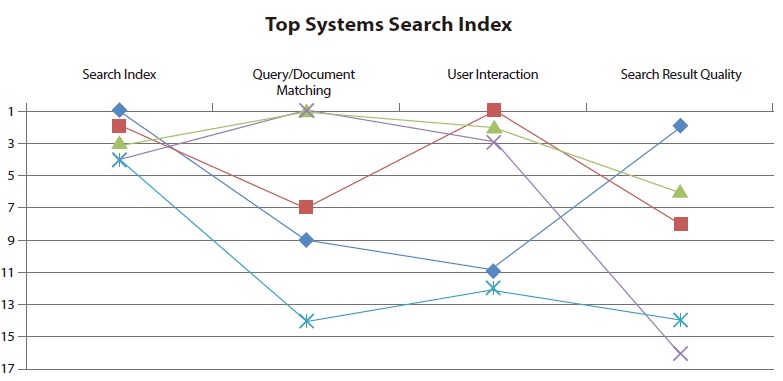
The evaluation framework was driven by the intention to illustrate the state of the art of site search. In 2011, a comparison of the five top systems in Search Index demonstrated that every search application needs to improve for at least one of the other main categories (see Fig. 9). This trend was also monitored by Braschler et al. (2007). None of the evaluations presented observed a search application which achieved equally good performance within all categories.
Thus, there is still a huge potential for improvement, especially in terms of
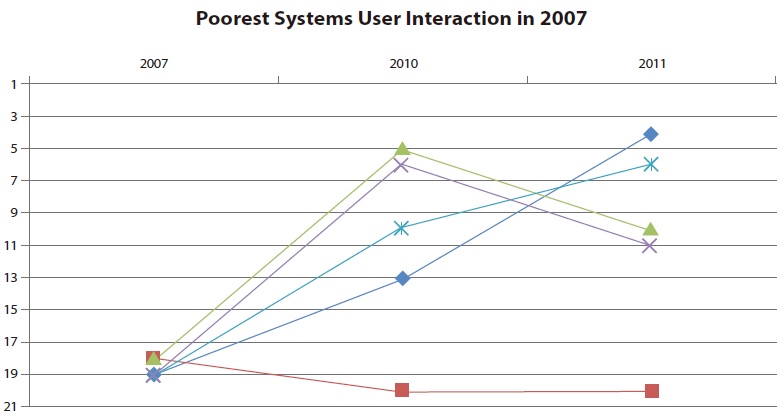
Since 2007, all but one site search has improved by at least eight positions. Nevertheless, none of the applications reached a position within the top three systems. This shows that potential for improvement remains unused in many cases. A similar analysis for top performers in one main category revealed that these sites are typically not among the best performers for other main categories. That means that even site searches performing well in one area have space for improvement in other areas.
In considering hardware, we often assume that technology automatically improves over time. This seems to be questionable for software as far as search technology is concerned. A scientific field with as much research as information retrieval cannot show that systems have considerable improved over the last few years.
Our benchmark, which was first presented by Braschler et al. (2006), proved to be an adequate method for evaluating site search over time. The stability of the results is remarkable. Although the framework was used by different evaluators the resulting figures did not change notably. Consequently, the presented evaluation framework may be considered as a stable instrument. The individual position of a single site should not be considered to be meaningful since a holistic point of view to all categories is crucial. Nevertheless, the general trend seems to be very reliable.
Users and customers need better tools to fulfill their tasks. The importance of site search as a tool for communicating with users and potential customers needs to be stressed and understood.