The Asian cavity-nesting honeybee, Apis cerana (Hymenoptera: Apidae), has been extensively studied for its biogeography and genetic diversity, but the molecules utilized in past studies were mainly ~90 bp long mitochondrial non-coding sequences, located between tRNALeu and COII. Thus, additional molecular markers may enrich our understanding of the biogeography and genetic diversity of this valuable bee species. In this study, we reviewed the public genome database to find introns of cDNA sequences, with the assumption that these introns may have less evolutionary constraints. The six introns selected were subjected to preliminary tests. Thereafter, two introns, titled White gene and MRJP9 gene, were selected. Sequencing of 552 clones from 184 individual bees showed a total of 222 and 141 sequence types in the White gene and MRJP9 gene introns, respectively. The sequence divergence ranged from 0.6% to 7.9% and from 0.26% to 17.6% in the White gene and the MRJP9 introns, respectively, indicating higher sequence divergence in both introns. Analysis of population genetic diversity for 16 populations originating from Korea, China, Vietnam, and Thailand shows that nucleotide diversity (π) ranges from 0.003117 to 0.025837 and from 0.016541 to 0.052468 in the White gene and MRJP9 introns, respectively. The highest π was found in a Vietnamese population for both intron sequences, whereas the nine Korean populations showed moderate to low sequence divergence. Considering the variability and diversity, these intron sequences can be useful as non-mitochondrial DNA-based molecular markers for future studies of population genetics.
The biogeography and genetic diversity of
Nuclear loci require four times more the effective population size than mitochondrial loci (Brown, 1983). Thus, several more folds of nucleotides are required from nuclear DNA to obtain equivalent numbers of variable sites to mitochondrial loci in general (Zink and Barrowclough, 2008). Because of this condition, population genetics studies of
In this study, we reviewed the genome database to find introns of cDNA sequences for
A total of 184
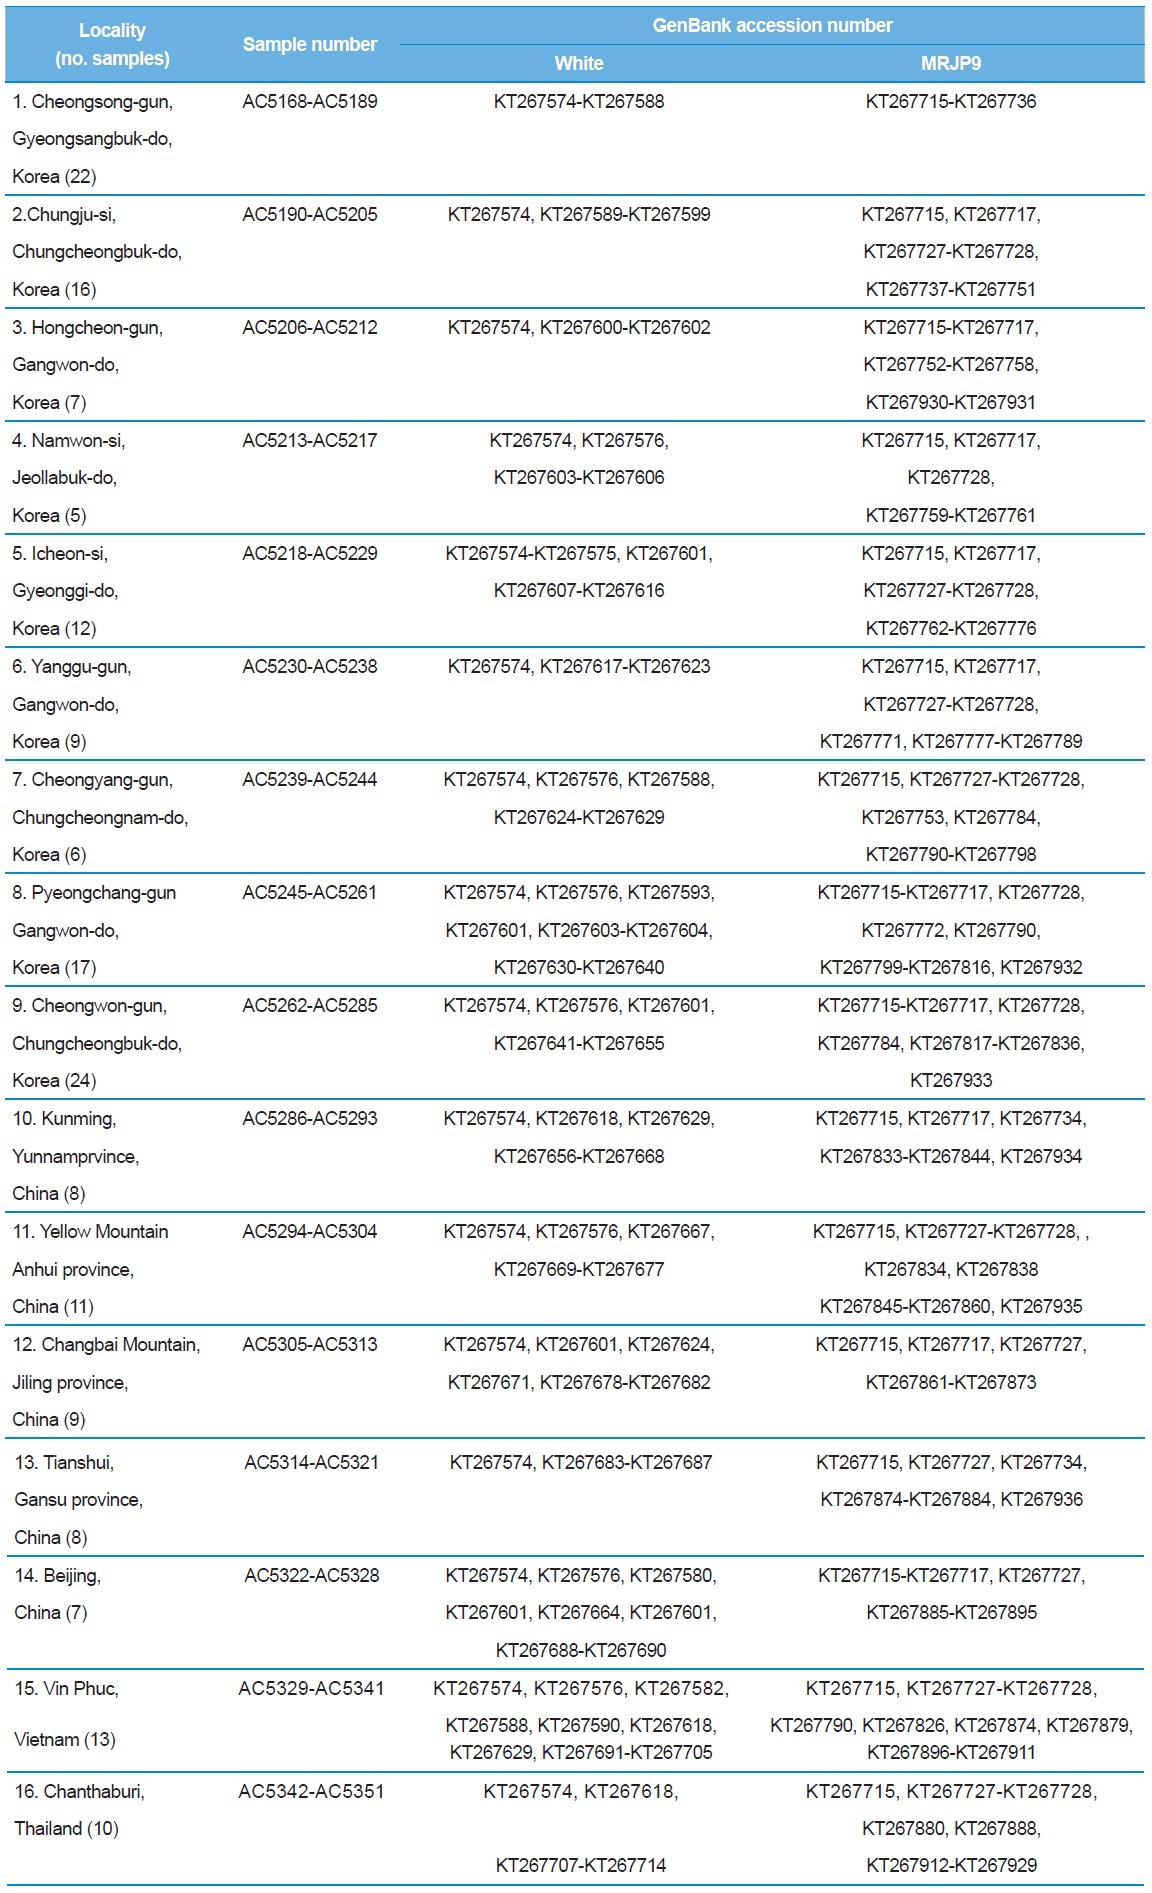
[Table 1.] A list of trapping localities, sample numbers and GenBank accession numbers

A list of trapping localities, sample numbers and GenBank accession numbers
Total DNA was extracted from one or two legs using the Wizard Genomic DNA Purification Kit, in accordance with the manufacturer’s instructions (Promega, Madison, WI, USA). While reviewing intron sequences of
[Table 2.] List of primer sequences used to amplify and sequence the introns of Apis cerana
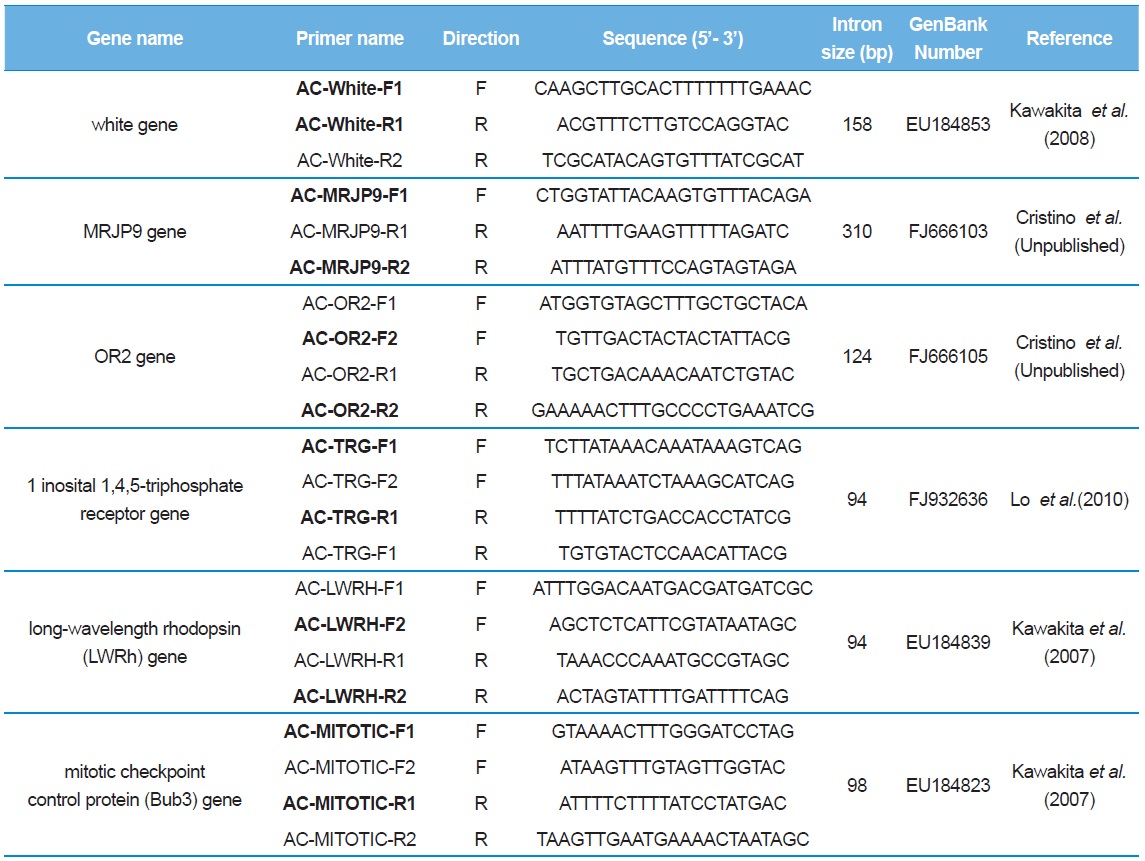
List of primer sequences used to amplify and sequence the introns of Apis cerana
A 35-cycle amplification (94℃ for 1 min, 50–52℃ for 1 min, and 72℃ for 1 min) process for PCR was conducted after initial denaturation at 94℃ for 5 min and the final extension step continuing for 7 min at 72℃. To confirm successful DNA amplification, electrophoresis was carried out using 0.5× TAE buffer on 0.5% agarose gel. After purification with the PCR purification Kit (Qiagen, Germany), the amplicons were cloned into a pGEM-T Easy vector (Promega, USA). For the cloning process, XL1-Blue competent cells (Stratagene, USA) were transformed with the ligated DNA, and the resultant plasmid DNA was isolated using a Wizard Plus SV Minipreps DNA Purification System (Promega, USA). Two or three clones with limited sampling were sequenced for preliminary experiments and the obtained sequences were analyzed for their variability. Eventually, the White gene and the MRJP9 gene introns were selected and these introns were subjected to full individual screening, analyzing three clones per individual. DNA sequencing was conducted using the ABI PRISM® BigDye® Terminator ver. 3.1 Cycle Sequencing Kit with an ABI 3100 Genetic Analyzer (PE Applied Biosystems, USA). All products were sequenced from both strands.
Sequence delimitation was conducted by comparing newly acquired sequences to the GenBank-registered corresponding cDNA using MAFFT ver. 6 (Table 2; Katoh
In order to estimate the variability of the intron sequences, population diversity estimates, such as sequence diversity and nucleotide diversity, both of which are reflective of genetic diversity within a population, were determined using Arlequin ver. 3.5 (Excoffier and Lischer, 2010). The maximum sequence divergence within each locality was estimated via extraction of the within-locality estimates of unrooted pairwise distances from PAUP ver. 4.0b (Swofford, 2002).
As a preliminary experiment, sequencing was performed only for limited individuals: 53 clones from the intron of the White gene, 18 from MRJP9 gene, 24 from OR2 gene, 31 from 1 inosital 1,4,5-triphosphate receptor gene, 27 from LWRh gene, and 29 from Bub3 gene. Six introns provided multiple numbers of sequence types (8–20), but the introns of the Bub3 gene and the LWRh gene provided one and two sequence types, respectively (Table 3). When diversity of sequence types was considered, the intron of one inosital 1,4,5-triphosphate receptor gene showed the lowest as eight (25.8%), excluding the introns of Bub3 gene and LWRh gene. Furthermore, this intron was shorter in original length at 92–94 bp and this may be problematic, considering the potential of variable sites in a given length. The intron of OR2 gene provided the second highest diversity of sequence type (45.83%) and the highest sequence divergence (0.79–7.14%), but the original sequence length of the intron is only the third (118–126 bp), after the introns of the White gene and the MRJP9 gene (158–160 bp and 310–313 bp, respectively). Thus, these were excluded from subsequent full individual screening, and finally, the introns of the White gene and the MRJP9 gene were selected for full investigation to evaluate their potential as nuclear population genetic markers.
[Table 3.] Preliminary information of intron sequenced
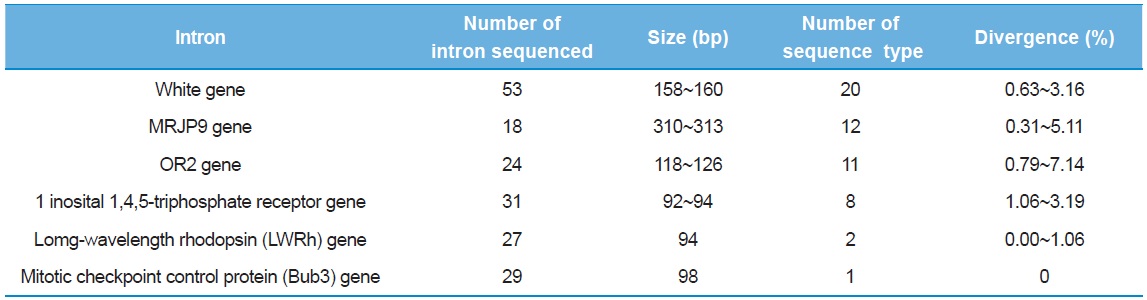
Preliminary information of intron sequenced
>
Sequence analysis of the two introns
The sequence analyses of 552 clones from 184 individual bees provided a total of 222 sequence types, ranging in size from 157 to 163 bp for the White gene intron and 141 sequence types, ranging in size from 307 to 357 bp for the MRJP9 intron (Table 4). The G/C content was ~27.8% (72.2% in A/T content) in the White gene intron and 19.5% (80.5% in A/T content) in the MRJP9 intron, indicating that the two introns are highly biased for A/T nucleotides. The sequence divergence of the two introns was 0.6%–7.9% in the White gene intron and 0.26%–17.6% in the MRJP9 intron, indicating moderate to substantial divergence. Previously, Lee
[Table 4.] Characteristic of intron sequences
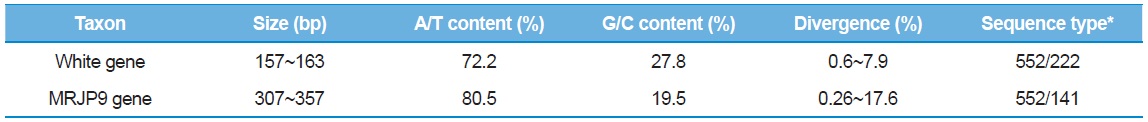
Characteristic of intron sequences
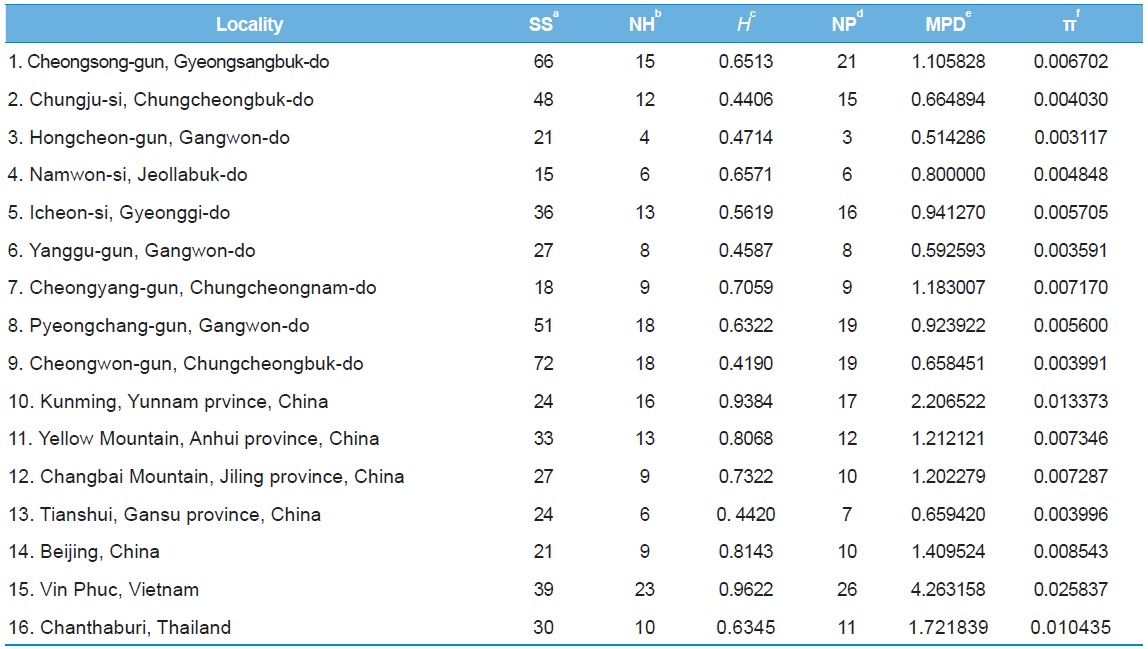
In order to understand the population genetic diversity of
[Table 5.] Within-locality diversity estimates of Apis cerana from White gene intron

Within-locality diversity estimates of Apis cerana from White gene intron
[Table 6.] Within-locality diversity estimates of Apis cerana from MRJP9 gene intron
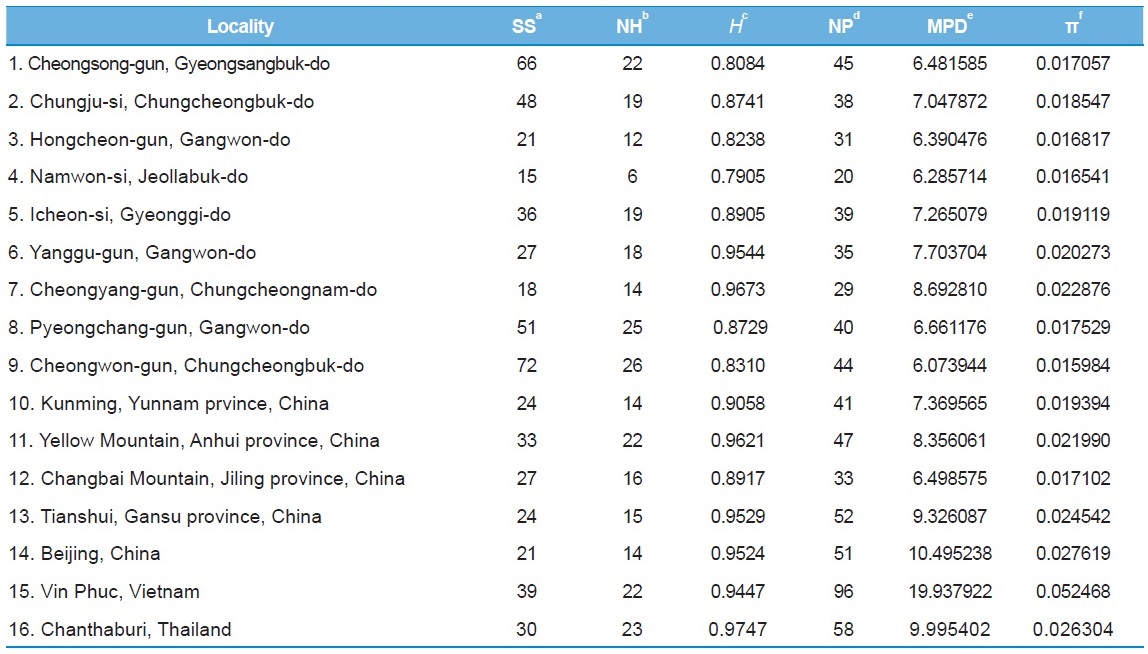
Within-locality diversity estimates of Apis cerana from MRJP9 gene intron
Among the 16 populations, the highest
In summary, we selected two intron sequences from the public genome database and sequenced 552 clones from 184 individuals of