The chest X-ray image cannot be focused in the same manner that optical lenses are and the resultant image generally tends to be slightly blurred. Therefore, the methods to improve the quality of chest X-ray image have been studied. In this paper, the inherent noises of the input images are suppressed by adding the Laplacian image to the original. First, the chest X-ray image using an Gaussian high pass filter and an optimal high frequency emphasis filter has shown improvements in the edges and contrast of flat areas. Second, using fuzzy logic_histogram equalization, each pixel of the chest X-ray image shows the normal distribution of intensities that are not overexposed. As a result, the proposed method has shown the enhanced edge and contrast of the images with the noise canceling effect.
Lung tissue abnormalities that are roughly spherical with a round opacity and a diameter of up to approximately 30 mm are known as lung nodules [1,2]. To identify these abnormalities, enhanced methods of obtaining a chest X-ray image are very important for improving the visual quality of the image. Numerous enhancement methods have been proposed in the literature, mainly on the grayscale transform and the frequency-domain transform.
Adaptive techniques usually provide a better performance than global ones at the expense of more algorithms that are complex and more computations. A close examination of the existing techniques reveals some problems. It is likely for a processed image to have some regions where the local contrast is already very high, and other regions where the local contrast is still not sufficient for the observers to see the details [3].
In this paper, fuzzy logic shows that an improved contrast has dark regions where the local contrast is darker and bright regions where the local contrast is brighter.
In particular, a Laplacian filter used as a noise suppresser, a Gaussian high-pass filter, an optimal high-frequency emphasis filter, and fuzzy logic_histogram equalization are used in this study. The experimental results show that the proposed algorithm performs significantly better than other well-known filters.
The remainder of the paper is organized as follows: Section II describes the high-pass filter, the high-frequency emphasis filter, and the fuzzy logic used in this study. Experimental results and conclusions are presented in Section III and Section IV, respectively.
If we are given the transfer function

Among the three high-pass filters (ideal, Butterworth, and Gaussian), the Gaussian filter shows the most enhanced result.
The high-frequency emphasis filter has the following transfer function:

where a denotes the offset and
In the experiment to find the optimal value, the value of
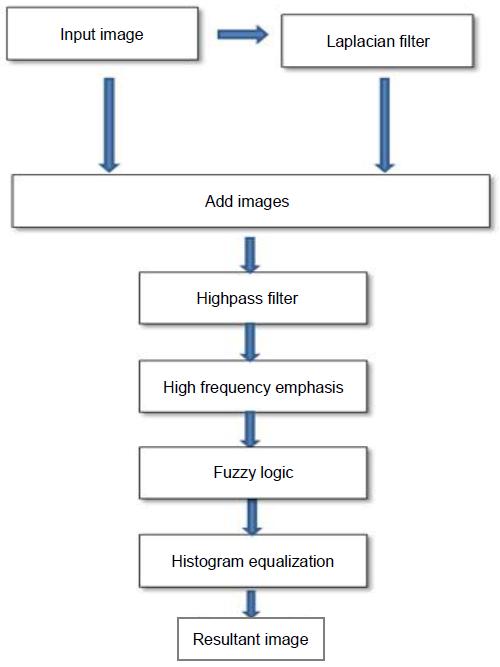
The image process diagram is shown in Fig. 1. This figure shows the process of the optimal high-frequency emphasis filter followed by the fuzzy logic. In this study, fuzzy sets were used for intensity transformations. Further, the process of enhancing the contrast of a grayscale image can be considered to use the following rules:
Therefore, the concepts of dark, gray, and bright can be expressed by the membership functions [6].
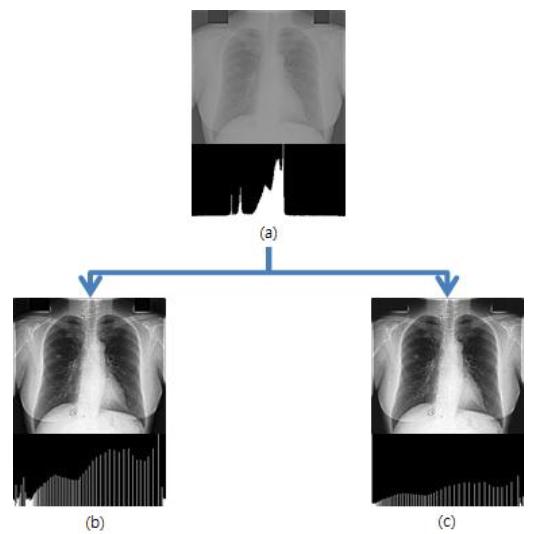
The result histogram of using fuzzy, rule-based contrast enhancement shows improved contrast; that is, the dark levels are moved left, thus darkening the other levels on this side, and the bright levels are moved right, thus brightening the other levels on this side.
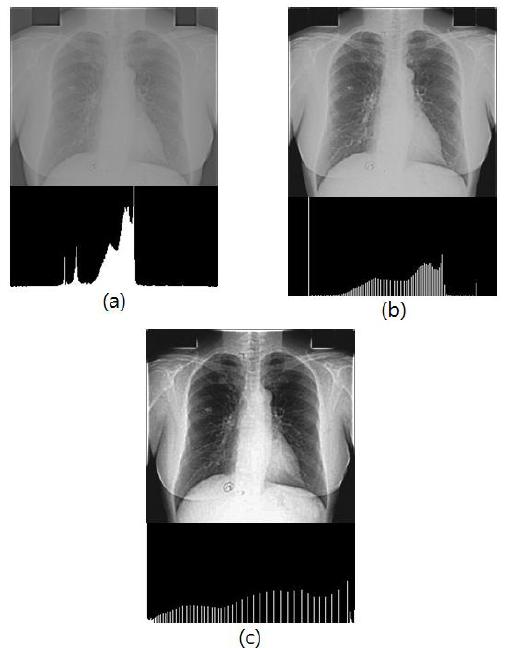
Fig. 2(b) shows the result of using fuzzy logic-based contrast enhancement. By comparing Fig. 2(a) and (b), we see a considerable improvement in the tonality in the latter. Fig. 2(c) is used for histogram equalization, which is extended simply for the intensity distribution. Fig. 3(a) shows the high-frequency emphasis image whose intensities span a narrow range of the grayscale (see the image histogram in Fig. 3(a)), thus giving the image an appearance of low contrast.
For improving the low contrast, we only use histogram equalization. Fig. 3(b) shows the histogram of this result; here, expanding the entire grayscale increases the contrast but introduces intensities that give the image an “over-exposed” appearance. This appearance is so bright that the details of the image disappear. To complement this shortcoming, Fig. 3(c) shows fuzzy logic_histogram equalization, that is, a histogram equalization image using fuzzy logic. It shows the improved contrast and the enhanced detailed parts.
A series of experiments have been performed using images from the Standard Digital Image Database, Japan; here, nodule 154 and non-nodule 93 on the chest radiogram (CR) verify the proposed algorithm.
During the enhancement process, artifacts such as the bone and soft-tissue boundaries are inherent. These artifacts have a detrimental effect on the diagnosis. In some cases, they can be pathological evidence in a normal radiograph or can hide subtle lesions [7]. In this study, such noises have been suppressed by adding a Laplacian image to the original. For a quality analysis, an unsharp masking (Unsharp) filter and a homomorphic (Homo) filter have been compared, which enhance the details of chest X-ray images [8].
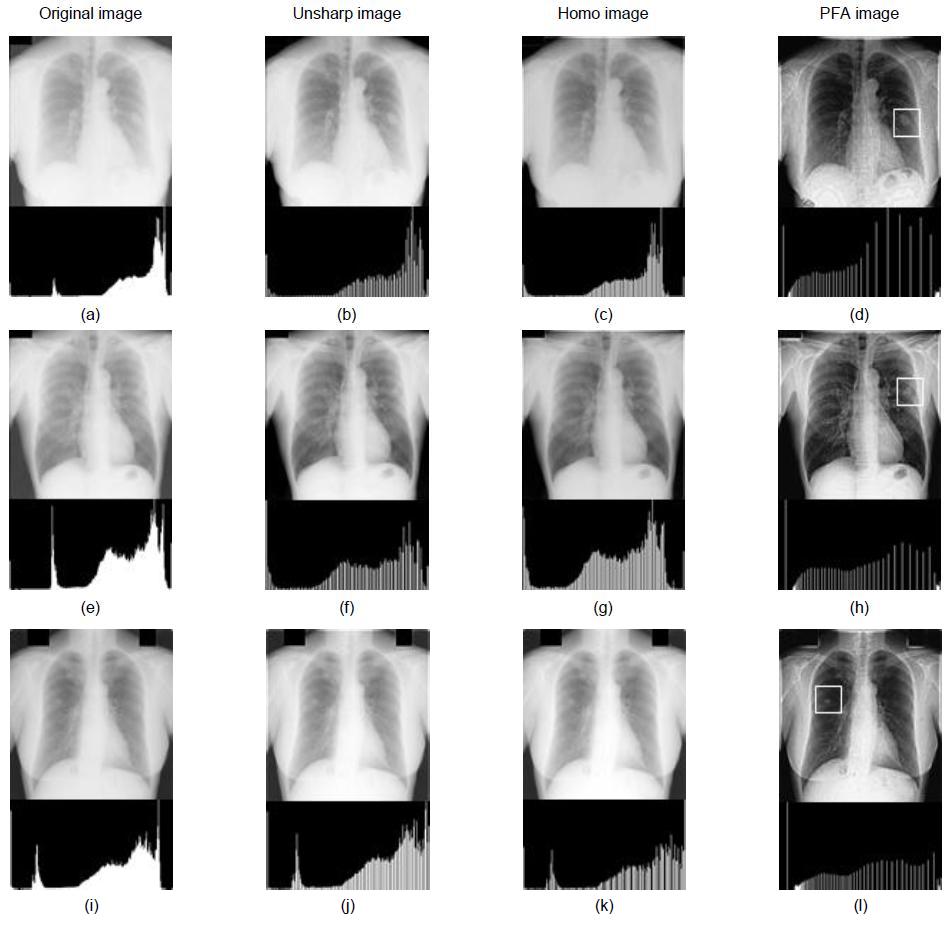
As shown in Fig. 4, Unsharp, Homo, and the proposed filter algorithm (PFA) are used for improving the input blurred chest X-ray image.
The resultant PFA image is superior to the existing resultant images of Unsharp and Homo.
Fig. 4(a), (e), and (i) show the original images with large, medium-sized, and small nodules, respectively.
The original images of Fig. 4 exhibit undesirable properties such as a low signal-to-noise ratio and a low contrast ratio. Therefore, these images have such a poor image quality that nodules cannot be seen. In the PFA simulation, the large, medium-sized, and small nodules can be seen clearly in the white box shown in Fig. 4(d), (h), and (l).
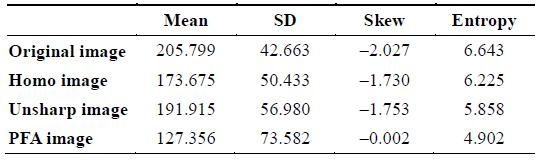
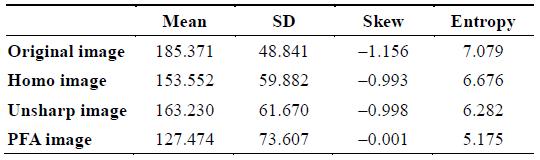
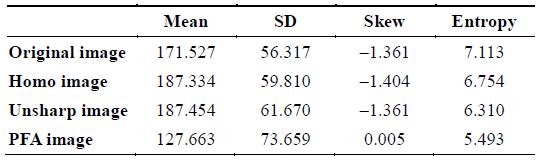
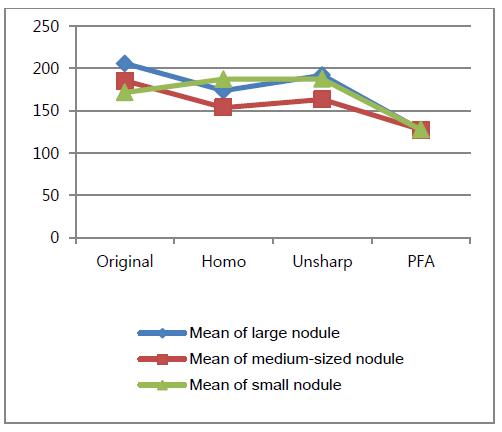
The values of the mean listed in Tables 1–3 denote the degree of symmetry of the histogram. The value for the PFA image is the closest to 128 (the mid-gray level of a histogram). Therefore, the contrast of the PFA image is improved with the histogram stretch.
[Table 1.] Large nodule measurements based on histograms

Large nodule measurements based on histograms
[Table 2.] Medium-sized nodule measurements based on histograms

Medium-sized nodule measurements based on histograms
[Table 3.] Small nodule measurements based on histograms

Small nodule measurements based on histograms
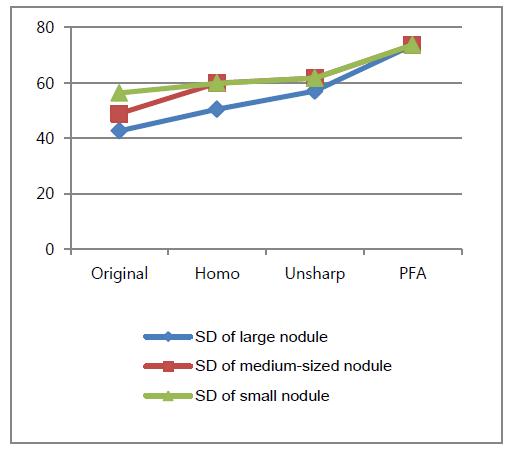
The values of the standard deviation listed in Tables 1–3 show that the original image has significantly less variability in intensity levels (it is smoother) than the other three images. Because of having the highest value of PFA’s standard deviation, the PFA image has a highest contrast.
The skew is positive if the tail of the histogram spreads to the right, and negative if the tail of the histogram spreads to the left. The values of the skew listed in Tables 1–3 show that the PFA image has the lowest value, and therefore, the PFA histogram is the most spread out. Consequently, the distribution of the histogram is dispersed in a large number of different gray levels.
Further, the lower the entropy value is, the lower is the variation in the intensity level. The entropy values listed in Tables 1–3 show that the PFA image has the lowest value, and therefore, the distribution of the PFA histogram is constantly dispersed in all gray levels.
In Fig. 5, as each nodule’s standard deviation has an ascending curve, the standard deviation of the PFA image shows its top portion of the ascending curve. As a result, the contrast of this images increases considerably.
In Fig. 6, as each nodule’s mean has a descending curve, the mean of the PFA image shows the bottom portion of the descending curve (closest to 128). Finally, it seems reasonable to conclude that the optimal high-frequency emphasis filter based on fuzzy logic shows enhanced details with improved contrast.
In this study, we used a padded X-ray CR image as the input image, on the basis of the cut-off frequency. A Laplacian filter was used for suppressing the artifacts inherent in the X-ray CR images.
An optimal high-pass filter and a high-frequency emphasis filter were used for enhancing the edge and the contrast of the flat areas. However, the high-frequency emphasis image shows intensities that span a narrow range of the grayscale. To achieve an improved contrast, fuzzy logic is used. For the qualitative analysis, PFA was compared with the existing filters. Therefore, as compared to the original chest X-ray images, the resultant images of the proposed filter algorithm showed subjectively enhanced quality and enhanced histograms.