The word “tribology” was coined by Jost (1966) in a report as a composition of two Greek words,
Scientometrics is referred to as a science about science; it is a distinct, recognized, and well-established scholarly field with its own identity, history, theories, and methodologies (Sorenko et al., 2009). Scientometric analysis is used very frequently for evaluating R&D activity and its impact on regions, countries, and institutions up to the level of individual scientists as well as the mapping of growths of scientific disciplines (UNESCO, 2001). According to Ivancheva (2008), worldwide scientometrics is becoming a more powerful instrument of science policy, determining to a great extent the way of a project and institutional funding by assessment of priorities, perspectives, and capacity.
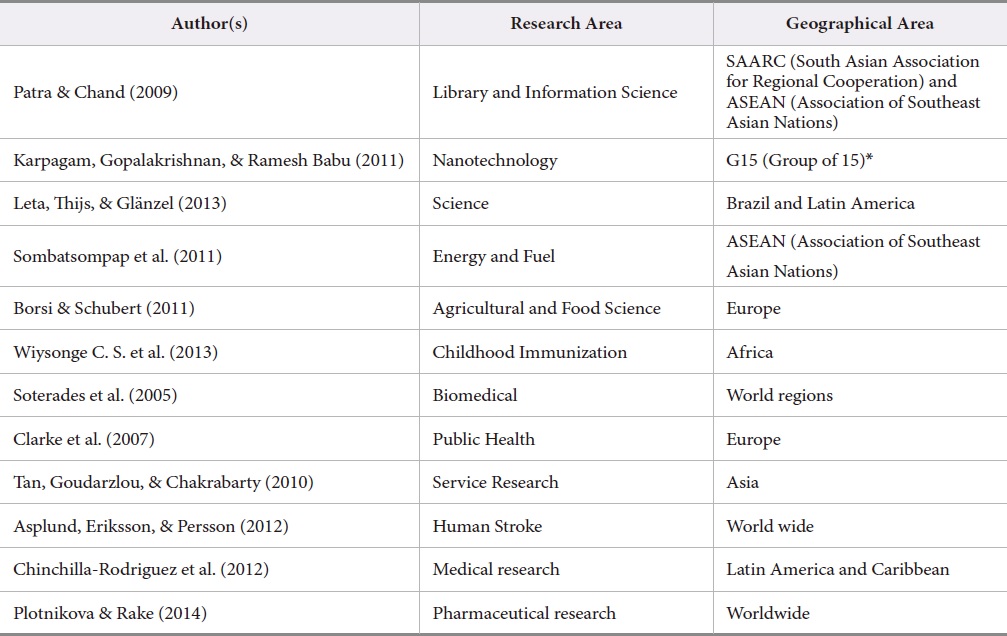
According to van Raan (2005), scientometric methods have been used in many disciplines of science and engineering to measure scientific progress. Scientometric indicators are useful to help scientists and decision makers to obtain valuable information (Jin & Rousseau, 2004). Bibliometric (or scientometric) studies can be classified into three levels: macro (countries, scientific disciplines), meso (research centers, university departments, scientific sub-disciplines), and micro (single papers, individual researchers) (Vinkler, 1988; Glänzel & Moed, 2002; Fiala, 2013). Macro-indicators, especially national science indicators, are standard tools in bibliometrics and provide a comprehensive picture of national research output in scientific fields (Moed, Glänzel, & Schmoch, 2004). Scientometric analyses performed at the macro-level (e.g. countries) yield at best general assessments of fields as a whole, for instance, the quality of a country’s performance in physics, chemistry, psychology, or immunology (van Raan, 2003). Several macro level scientometric studies have been carried out in the past in various research fields (see a selection in Table 1).
[Table 1.] Recent Macro Level Scientometric Studies

Recent Macro Level Scientometric Studies
Recently, Elango, Rajendran, and Manickaraj (2013) analyzed the tribology research output in BRIC countries (Brazil, Russia, India, and China), Elango, Rajendran, and Bornmann (2013) examined global nanotribology research output, and Rajendran, Elango, and Manickaraj (2014) analyzed India’s contribution to world tribology research. As a final step in analyzing tribology research, publication output of countries and regions, and degree of interdisciplinarity, are analyzed in this study.
The objective of this paper is to analyze scientific productivity and its citation impact in the field of tribology research as reflected in SCOPUS (Elsevier) during 1998-2012 using macro-level indicators by world region, level of income, and various country groups such as the Developing Eight Countries (D8), the Association of Southeast Asian Nations (ASEAN), the Union of South American Nations (UNASUR), and the Emerging and Growth-Leading Economies (EAGLEs). Further, this study is designed to address the following questions: What are the top countries in this research field? What is the level of interdisciplinarity in this research field?
SCOPUS was used to retrieve the bibliographic records related to tribology research for the period of 15 years from 1998 to 2012. The following keywords were used in the combined fields of title, abstract, and keywords: *
3.2. Scientometric Indicators and Tools Employed
Growth Rate
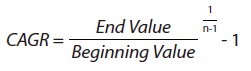
Compound Annual Growth Rate (CAGR) is used to give an indication of yearly growth (Choi, Lee, & Sung, 2011):

where n = number of years
Share of International Collaborative Papers
The Share of International Collaborative Papers (SICP) measures internationally co-authored publications in the national total as well as the strength of co-publication links between countries (Glänzel, 2000).
Citation Per Paper
Citation Per Paper (CPP) is obtained by dividing the total number of citations by the total number of papers.
Non-Citation Relative Rate
The Non-Citation Relative Rate (NCRR) is the quotient of the percentage of a country’s non-cited papers and of all the countries. NCRR = 1 indicates that a country’s uncitedness is equal to the world average; NCRR > 1 (NCRR < 1) indicates that a country’s uncitedness is greater (lower) than the world average. NCRR = 0 indicates that a country’s uncitedness is 0.
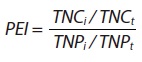
Publication Efficiency Index
Publication Efficiency Index (PEI) (Guan & Ma, 2007) is a measure of research quality and indicates whether the impact of publications in a country within a research field is compatible with the research efforts. The value of PEI>1 (PEI<1) for a country indicates that the impact of publications is more (less) than the research effort devoted to it by that particular country, and vice versa.

where TNCi denotes the total number of citations of country i, TNCt denotes the total number of citations of all countries, TNPi denotes the total number of papers of country i, and TNPt denotes the total number of papers of all countries
Simpson Index of Diversity
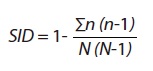
The multidisciplinary character of tribology can be measured on the basis of SCOPUS subject areas (Igami & Saka, 2007). SCOPUS classifies journal titles into 27 major subject areas, where a journal may belong to more than one subject area. The multidisciplinary nature of tribology research can be assessed by the distribution of the papers across different subject areas. We use the Simpson Index of Diversity to characterize this:

where n is the number of papers attributed to the ith subject area and N is the total number of papers attributed to all subject areas. The value ranges between 0 and 1; the greater the SID, the greater the sample diversity.
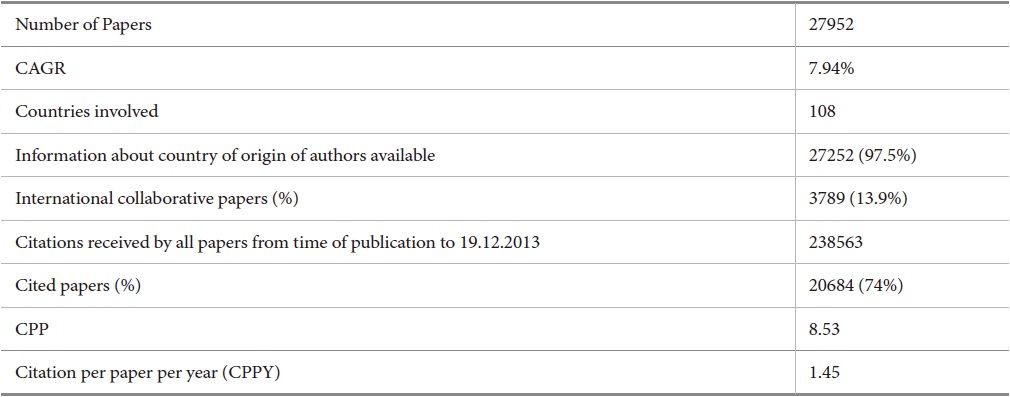
Table 2 provides a general overview over tribology research output for the period of 15 years from 1998 to 2012. 97.5% of the tribology research papers have country affiliation information for the authors (in SCOPUS). 7.94% annual publication growth was observed over the period.
[Table 2.] Summary Of Tribology Research Output During 1998-2012

Summary Of Tribology Research Output During 1998-2012
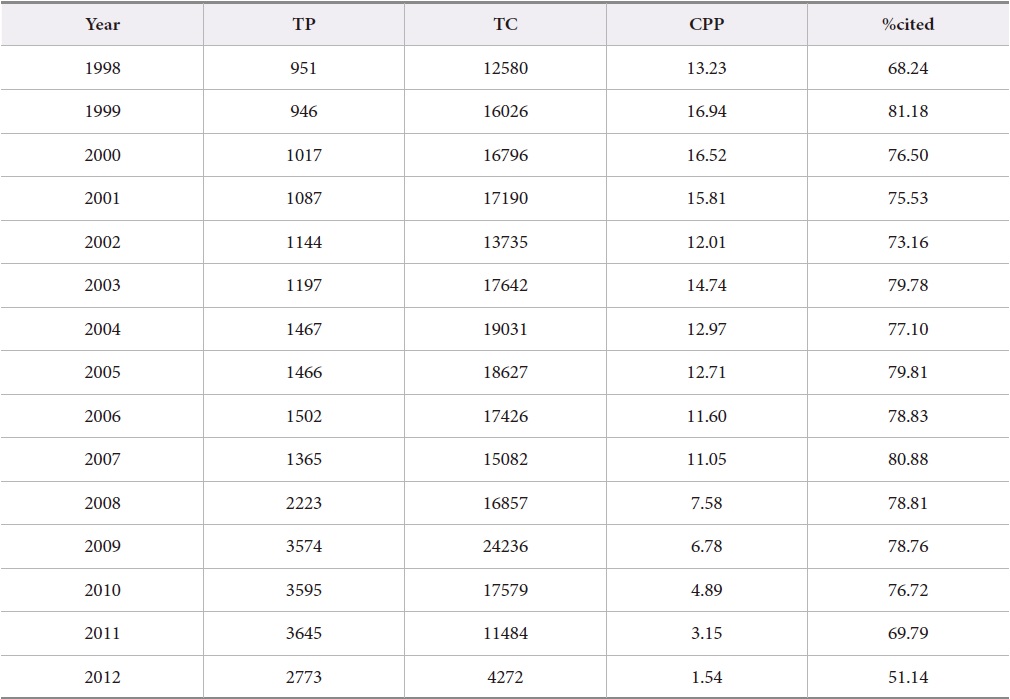
General characteristics of tribology research from 1998 to 2012 are presented in Table 3: yearly output, CPP, and share of cited papers. A threefold increase was observed over the study period, (from 951 in 1998 to 2773 in 2012). The highest number of papers was published in the year 2011 with 3645, and the lowest in 1999 with 946.
[Table 3.] Yearly Output And Citation Impact 1998-2012

Yearly Output And Citation Impact 1998-2012
Table 4 shows the comparison between international collaboration and national output. International collaborative papers received higher CPP than nationally collaborative papers. This result is in agreement with the result of many other studies (Glänzel, 2001).
[Table 4.] International vs. National Output
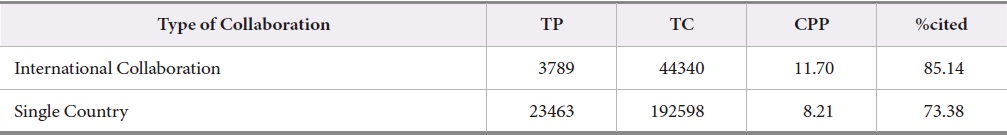
International vs. National Output
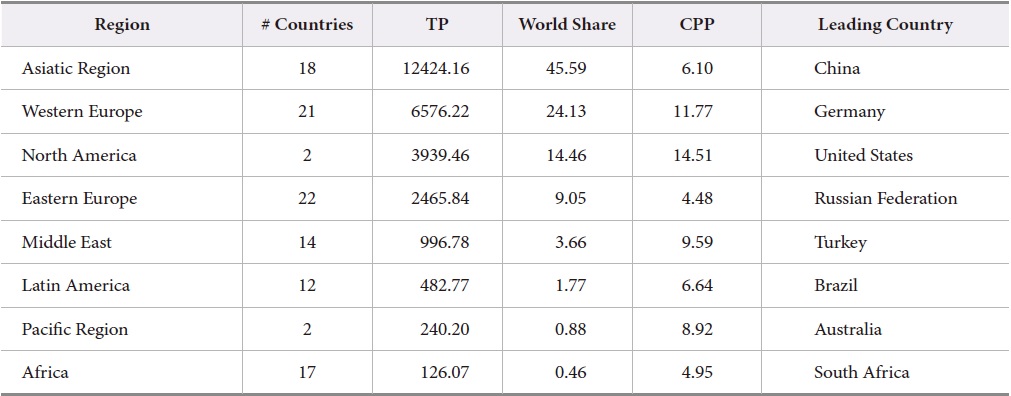
Classification of countries by world regions is adopted from SCImago (www.scimagojr.com). Table 5 presents the contribution and share of the world regions. Almost 46% of world tribology research output was contributed by authors located in the Asiatic region followed by Western Europe, North America, and Eastern Europe. Africa had the lowest contribution among the world region even though the number of contributing countries is higher than for the Middle East. Publications from North America received the highest citations per paper (14.5) followed by Western Europe with 11.8 and the Middle East with 9.6.
[Table 5.] Contribution by World Regions

Contribution by World Regions
The classification of countries by income group was obtained from the World Bank (http://data.worldbank. org). The distribution of tribology contributions by income group is presented in Table 6. It can be observed that there is a relationship between the income of a specific country and its research activity. Almost 95% of world publications are from countries of the high and upper middle income categories. This result is in agreement with earlier studies (Huffman et al., 2013; Al & Taskin, 2015). As expected, publications from high and lower income countries have the highest CPP. The lower income countries profit from larger proportions of papers with international collaboration: Out of the eight countries in the lower income group, five published all their papers with international collaboration.
[Table 6.] Contribution by Income Groups
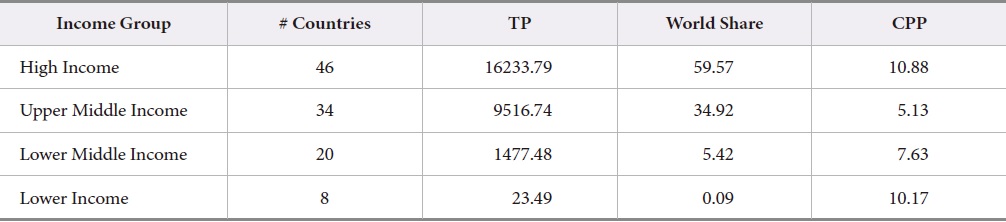
Contribution by Income Groups
Table 7 provides information about the publication patterns of the top 7 countries in the dataset, which published more than 1000 papers over the study period. Countries having more than 1000 publications in a research field are termed as highly productive countries (Kademani et al., 2013). Except for China and India, five countries belong to the G7 group (USA, UK, France, Germany, Italy, Canada, and Japan). This shows that the G7 nations are the leaders in tribology research. The seven countries in Table 7 together contributed 66.5% of the world output. This list of countries replicates the top countries contributing in materials science and technology (Adams & Pendlebury, 2011). Among the top countries, China contributed 25% of the total output, followed by the United States with 13% and Japan with 10.5%. India tops the list in the papers’ growth rate with 19%. With growth rate greater than 8%, only India’s and China’s growth rates were higher than the world average. Among the top seven countries, five belong to the high income group.
[Table 7.] Contributions of Top Countries (>1000 papers)
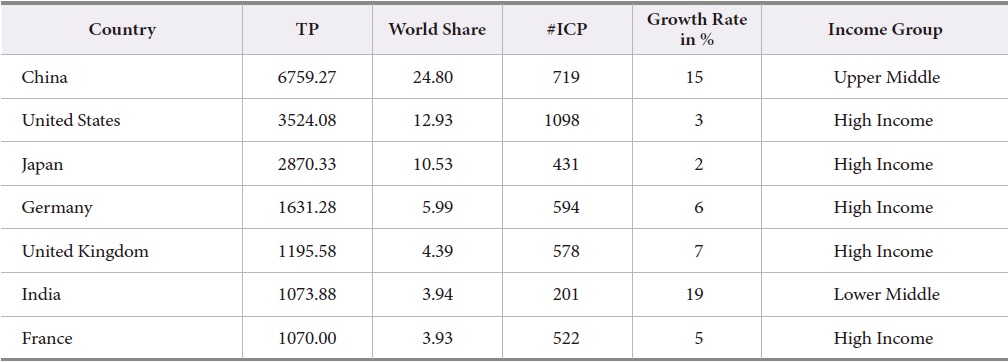
Contributions of Top Countries (>1000 papers)
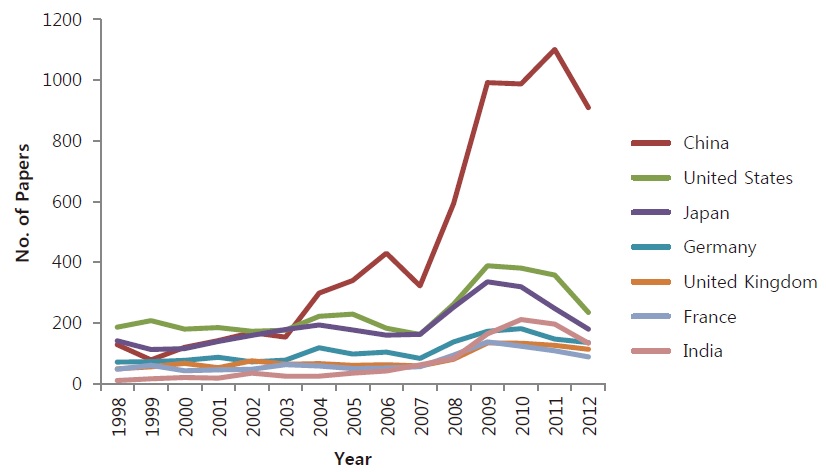
According to the Royal Society’s report in 2011, China will overtake the United States in Science in two years. In case of tribology research, China surpassed the United States in 2004 itself (Fig. 1) and continues to the world leader in terms of scientific production in this research field.
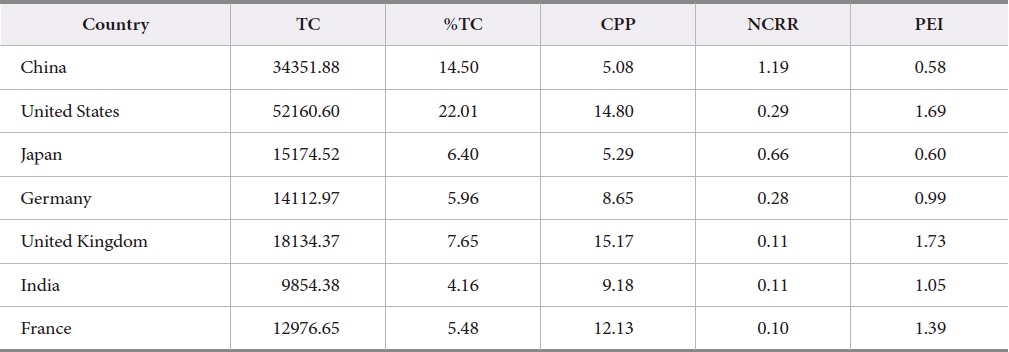
The citation impact of the top countries is provided in Table 8. The papers of these top countries received 66% of world citations. Among the top countries, contributions from the United States received 22% of world citations and contributions from India only 4%. However, India has the fourth highest CPP of 9.18. Contributions from the United Kingdom have the highest CPP of 15.17, and the lowest CPP applies to contributions from China and Japan. Except for China, the NCRR of all the top countries is lower than the world average of 1. The PEI values for China and Japan are lower than the world average of 1 because these countries publish articles in their regional languages such as Chinese and Japanese, which are not easily understood by the scientific community in the rest of the world.
[Table 8.] Citation Impact of Top Countries (>1000 papers)

Citation Impact of Top Countries (>1000 papers)
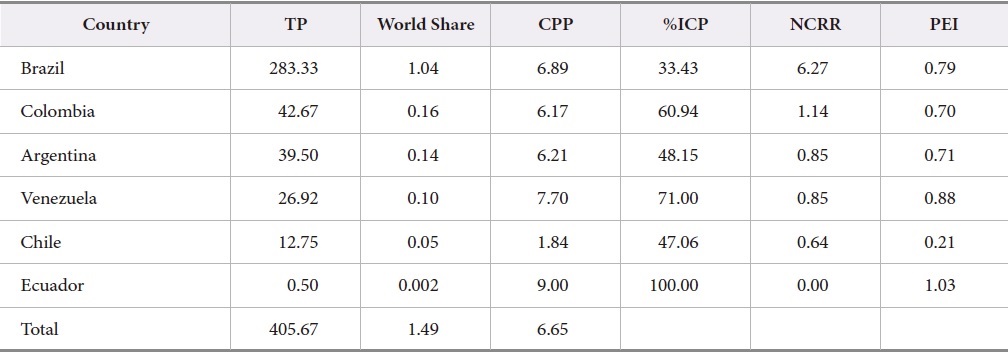
Table 9 presents the most productive UNASUR (Union of South American Nations) countries from 1998 to 2012. Among the countries, Brazil contributed more than 1% of world publication output during the study period, followed by Colombia and Argentina. Only Ecuador received a higher CPP value than the world average of 8.53 (see Table 2). Except for Brazil and Colombia, the NCRR of all this group of countries is lower than the world average of 1. PEI value is below the world average of 1 for all these countries except Ecuador, which published its article with international collaboration.
[Table 9.] Contribution and Impact of UNASUR Countries

Contribution and Impact of UNASUR Countries
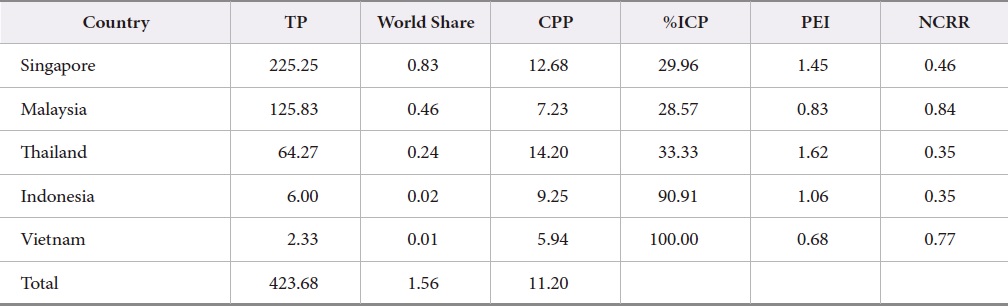
Table 10 shows the publication pattern of ASEAN (Association of Southeast Asian Nations) countries. Out of 10 ASEAN countries, only five countries engaged in the research field of tribology during the study period, and these five countries together contributed 1.56% of total world output. Singapore is the top ASEAN country with the highest publication share, and Thailand received the highest CPP. Among the ASEAN countries, Singapore and Thailand received a higher CPP than the world average of 8.53 (see Table 3). Vietnam contributed all its share of papers with international collaboration. All ASEAN countries had higher shares of international collaborative papers than the world average. All countries received lower NCRR than the world average.
[Table 10.] Contribution and Impact of ASEAN Countries

Contribution and Impact of ASEAN Countries
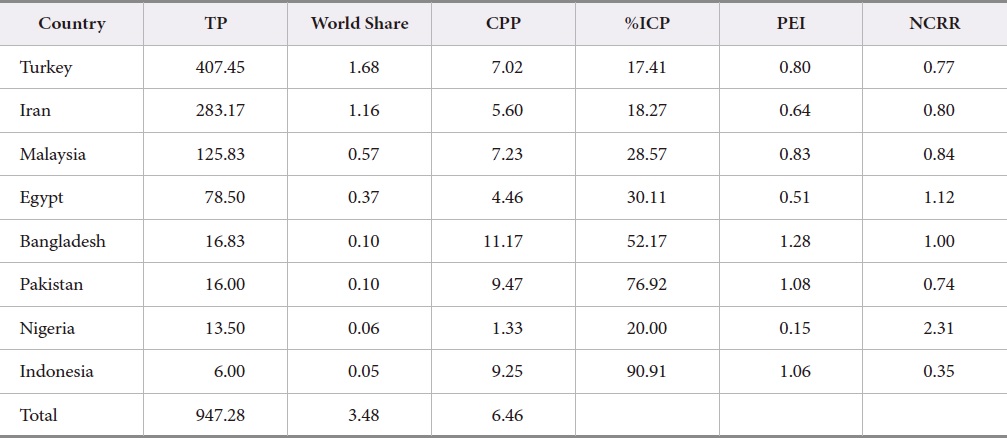
All the countries of the D8 (Developing Eight) are engaged in tribology research (see Table 11). Among the D8 countries, Turkey and Iran contributed more than 1% of total world output and all the D8 countries together contributed 4% of total world output. Publications from Bangladesh received the highest citations per paper (11.2) followed by Pakistan with 9.5 and Indonesia with 9.25. Indonesia produced most of its papers in international collaboration, as did Pakistan and Bangladesh. Among the D8 countries, Egypt, Bangladesh, and Nigeria received a higher NCRR than the world average.
[Table 11.] Contribution and Impact of D8 Countries

Contribution and Impact of D8 Countries
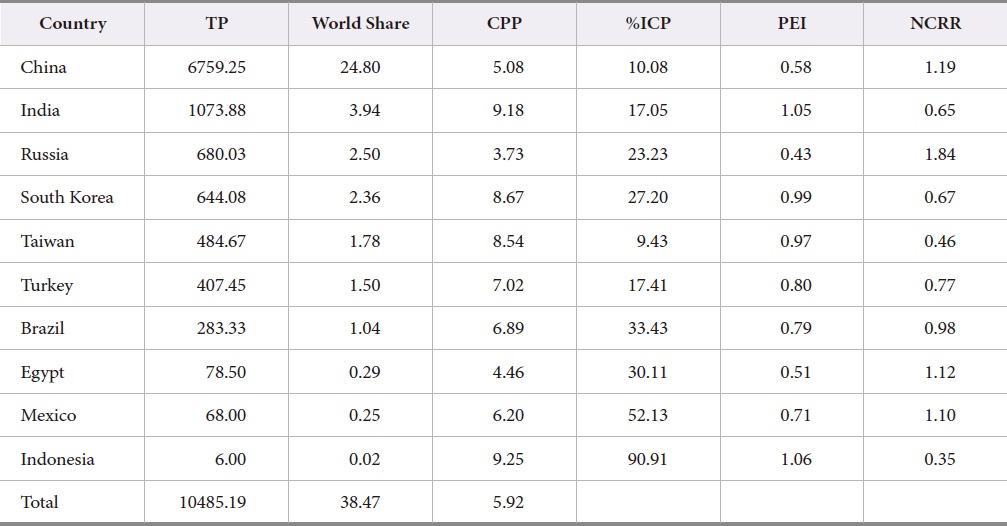
EAGLEs (Emerging and Growth-Leading Economies) countries together contributed 38% of the tribology output, where China is the leader followed by India, Russia, and South Korea (see table 12). Apart from Egypt, Mexico, and Indonesia, all D8 countries contributed more than 1% of the world’s total output. The share of international collaborative papers for China and Taiwan is lower than the world average. Among the D8 countries, the share of non-cited papers for China, Russia, Egypt, and Mexico is higher than the world average.
[Table 12.] Contribution and Impact of EAGLEs Countries

Contribution and Impact of EAGLEs Countries
Measurement of Interdisciplinarity
In this study, we use the Simpson Index of Diversity based on the number of SCOPUS subject areas to measure the level of interdisciplinarity in tribology research (Kalz & Specht, 2013). This index is commonly used for calculating biodiversity habitats in ecology. For example, the degree of interdisciplinarity has been assessed in the fields of forestry (Bojović et al., 2014) and cardiovascular systems (Leydesdorff & Opthof, 2013). The analyses of interdisciplinarity are based solely on those papers in the dataset of this study which are indexed under the main SCOPUS subject category Physical Sciences. Tribology research belongs to pure engineering and nearly all papers have been categorized in this main category.
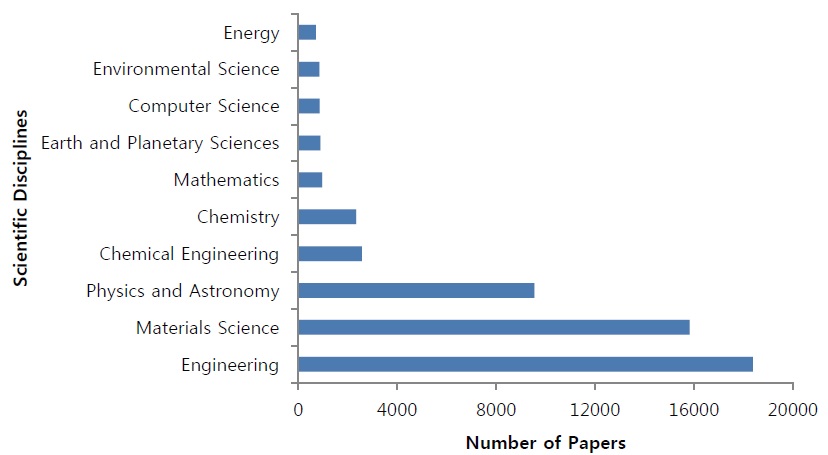
The value of the Simpson Index of Diversity is calculated as 0.75, which shows the high level of interdisciplinarity in tribology research. Fig. 2 shows the different subject areas of the papers (through journals) in tribology research. It can be observed from Fig. 2 that all the papers in the dataset have been attributed to either Engineering or Materials Science along with other subject areas.
We examined the world tribology research output across a 15 year period. Tribology research output has increased drastically over the 15 year period by a factor of three, from 951 in 1998 to 2773 in 2012. The number of countries engaged in tribology research also grew from 55 in 1998 to 85 in 2012. There were 108 countries involved in tribology research during this period. Tribology research work is dominated by the Asiatic region and high income countries. Similar results have been reported for related disciplines such as materials science (Kademani et al., 2013). There exists a high level of interdisciplinarity in the tribology papers. The share of international collaborative papers is 13.9%, which is lower than for other research fields such as stem cells (Luo & Matthews, 2013) with 21%. China contributed 25% of the world’s total tribology research output during the study period, which is a higher share than in other research fields such as global positioning systems (Wang et al., 2013), stem cells (Luo & Matthews, 2013), and medicine (Gupta & Bala, 2011). In these fields, China’s contribution was below 10%. Contributions by authors from North America had the highest impact and those from Eastern Europe the lowest.
There are two limitations of this study. First, growth rates have been calculated using CAGR, which is based entirely on the initial and final values. It takes no account of changes in-between. Second, the level of interdisciplinarity has been evaluated based on the subject classifications at journal level. Interdisciplinarity should actually be measured on the basis of individual papers.
The results of this study could provide help not only to the scientists and science policy makers in the field of tribology, but also to information managers. Future studies will be addressed the limitations of this study. Further studies such as research efforts given by countries in different sub-disciplines of tribology research and adjusted with GDP can be useful to monitor the research progress. Research collaborations of countries in this research field could be of interest which would be useful in finding research partner especially for scientists of under developed countries.