This paper describes an implementation method and the results of numerical mobile phone models representing real phone models that have been released on the Korean market since 2002. The aim is to estimate the electromagnetic absorption in the human brain for casecontrol studies to investigate health risks related to mobile phone use. Specific absorption rate (SAR) compliance test reports about commercial phone models were collected and classified in terms of elements such as the external body shape, the antenna, and the frequency band. The design criteria of a numerical phone model representing each type of phone group are as follows. The outer dimensions of the phone body are equal to the average dimensions of all commercial models with the same shape. The distance and direction of the maximum SAR from the earpiece and the area above –3 dB of the maximum SAR are fitted to achieve the average obtained by measuring the SAR distributions of the corresponding commercial models in a flat phantom. Spatial peak 1-g SAR values in the cheek and tilt positions against the specific anthropomorphic mannequin phantom agree with average data on all of the same type of commercial models. Second criterion was applied to only a few types of models because not many commercial models were available. The results show that, with the exception of one model, the implemented numerical phone models meet criteria within 30%.
Some research [1,2] has been conducted to estimate the specific absorption rate (SAR) values in numerical human head models based on the measured SAR distribution in a specific anthropomorphic mannequin (SAM) phantom to provide the exposure gradient for the Interphone study [3–5], an epidemiological study about mobile phone use and the risk of brain cancer. In [1], a method was proposed to estimate the three-dimensional SAR distributions in a realistic head model using the data obtained from compliance testing measurements. The basic concept is to project the SAR on the conformal plane of the SAM phantom to a numerical head model and then to extrapolate the SAR inside the model from the conformal plane assuming an exponential decay exposure gradient in specific locations of the brain. A large number of mobile phone models released in Europe and Japan were analyzed to identify those models with a similar volume and location of the area above –3 dB of the maximum SAR [2].
The Mobi-Kids Study [6] is a multinational epidemiological case-control study of brain tumors in young people aged 10 to 24 in relation to electromagnetic field exposure from mobile phones and other sources. In that study, a different approach was used to evaluate the SAR in human head models for mobile phone radiation. Mobile phone models are numerically implemented to represent real commercial phones, and the SAR distributions in head voxel models are calculated. It is important to identify all commercial models using previous and current market surveys because the Mobi-Kids Study fundamentally looks backward when examining exposure.
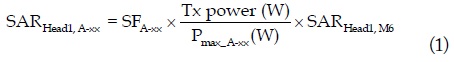
We decided to investigate the SAR compliance test reports of commercial phone models that were released in Korea from 2002 to mid-2013. We determined the representativeness of each type of model from the viewpoint of exposure assessment by (A) extracting the average 1-g SAR level for the test positions of the left cheek, right cheek, left tilt, and right tilt from the test reports and (B) measuring the SAR distributions of available commercial models in a flat phantom. Fig. 1 shows a flowchart for the development of a representative phone model. As the figure shows, the idea is to achieve a difference of within ±30% between the requirements and the implemented results. The ±30% target value is the same as the expanded measurement uncertainty of SAR measurement methodologies developed by international standards development organizations [7,8]. The physical dimensions of each model follow the average of the same type of commercial phone models based on the test reports and web surveys.
The remainder of this paper is organized as follows. In Section II, commercial phone models are classified into 11 types by analyzing the SAR test reports. Detailed design requirements for these 11 types of phone models are given in Section III. The implementation results of the representative phone models are then described in Section IV.
II. SURVEY AND CLASSIFICATION OF MOBILE PHONE MODELS
The SAR of mobile phones has been regulated since 2002, and more than 1,200 models have been tested for SAR compliance in Korea. The limits of spatial peak SAR in the head are based on IEEE Standard 95.1 [9,10]. A mobile phone model should be compatible with the spatial peak SAR, that is, 1.6 W/kg for 1 g of mass based on the measurement procedure of IEC 62209-1 [7].
Code division multiple access (CDMA) and wideband CDMA (WCDMA) services were launched in Korea in the late 1990s and the mid-2000s, respectively. CDMA networks have used the frequency bands of 824 to 849 MHz (CDMA2000 Band Class 0) and 1,750 to 1,780 MHz (CDMA2000 Band Class 4). WCDMA networks have used the frequency bands of 1,920 to 1,980 MHz (UMTS Band 1) (uplink) [11]. The recently launched Long Term Evolution (LTE) mostly services data communication such as text message use and Internet acess. Therefore, we considered mobile phone models for only the CDMA and WCDMA frequency bands.
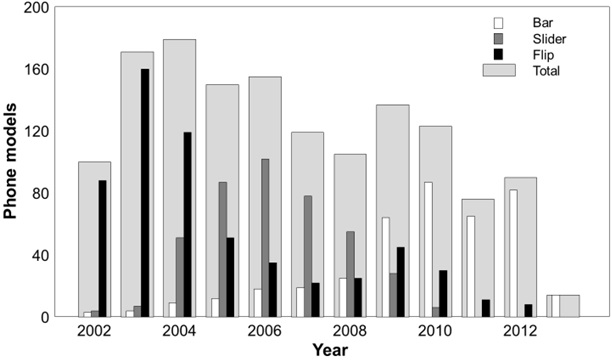
Fig. 2 shows the shapes of phone models released by year. Flip, slider, and bar types comprised the majority in the early, mid, and late 2000s, respectively. Since the release of smart phones, most recent models have been bar types.
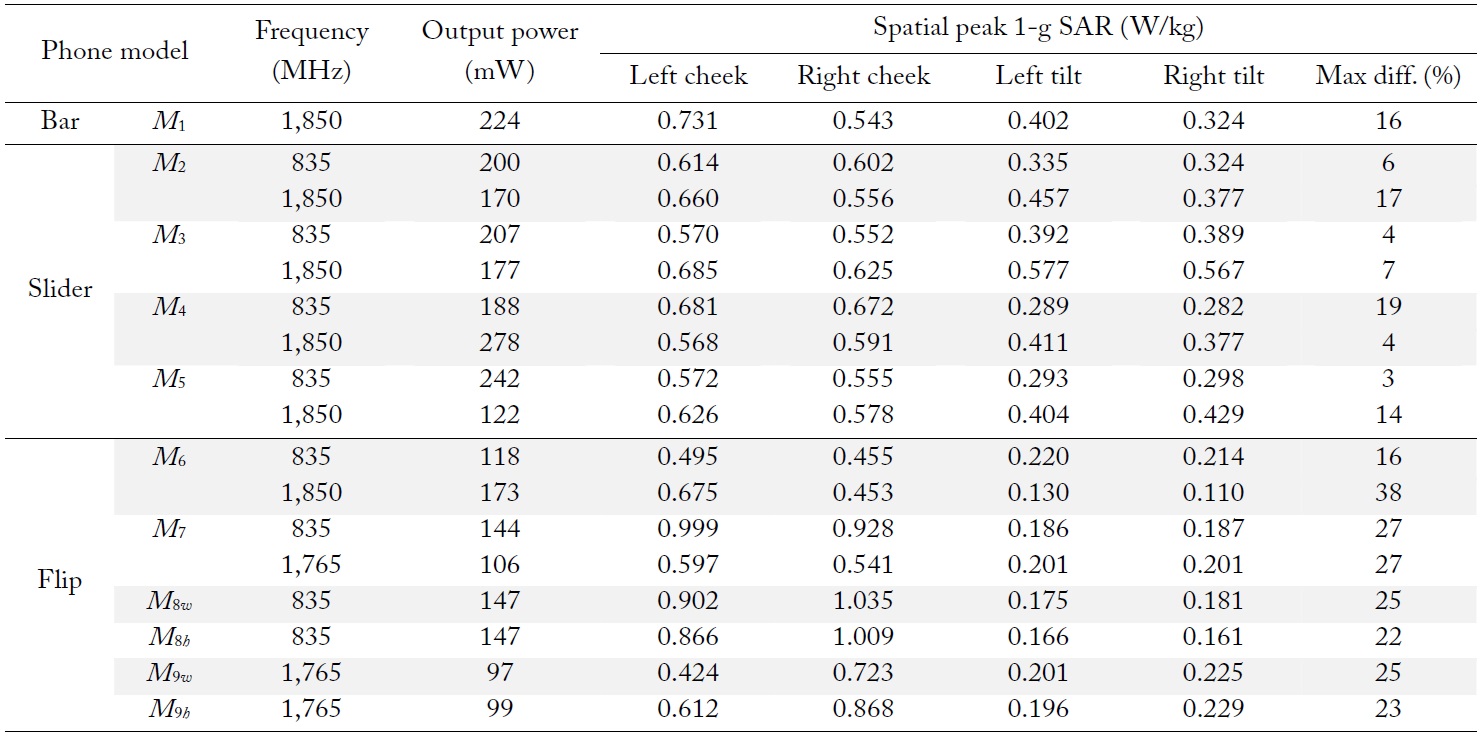
More than 1,400 test reports from 2002 to June 2013 were collected. We amassed a large amount of data, including information about manufacturers, frequency bands, phone shapes, antenna type (internal/external), maximum output power, body dimensions, and spatial peak 1-g SAR values in the four test positions of the left cheek, right cheek, left tilt, and right tilt at the center frequency for all models. Information about the antenna location (top/bottom for the internal antenna, and right/left for the external antenna) was also examined using SAR distributions in the SAM phantom and is described in a test report and a manual available on the Internet.
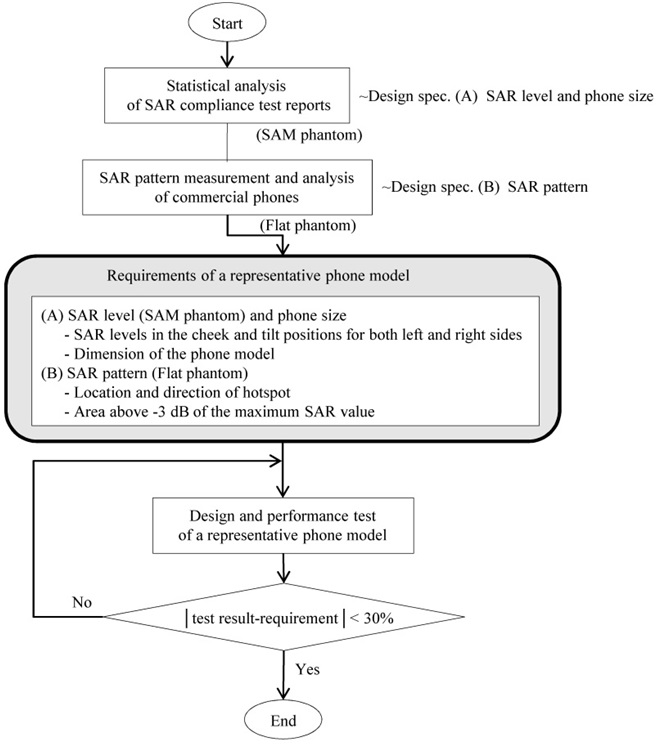
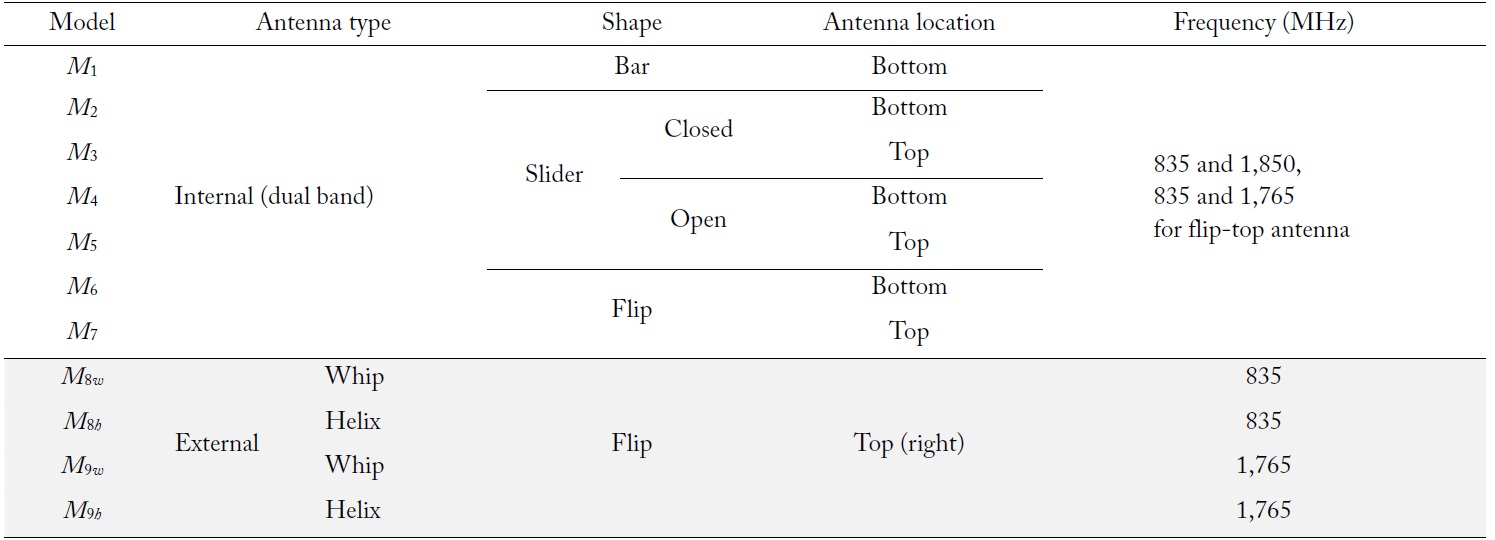
Mobile phone models were first classified according to their shape, antenna type and location, and frequency bands, as shown in Table 1. The numbers in parentheses indicate how many models have been released.
[Table 1.] Mobile phone models released in Korea since 2002

Mobile phone models released in Korea since 2002
Internal antennas are mostly located at the top or bottom of phones. If not stated in the user manual or test report, the location can be determined only by taking the phone apart. The position of the internal antenna for 59 models could not be determined. The internal antenna of most bar-type models is located at the bottom of the phone.
All external antennas are at the top of phones and can be either on the left or the right when looking at the front of a phone. The location can be easily determined by looking at pictures provided in the reports. Only 11 of 443 models with an external antenna have the antenna at the top left side of the phone. Flip-type models account for about 82% of all models with external antennas, while bar-type models comprise only 4%.
There are basically two types of external antennas—stubby antennas and whip-stubby antennas. A stubby antenna protrudes from the phone and does not have any movable parts [12]. Our investigation showed that most external antennas are of the whip-stubby (retractable) type or the helix stubby type. The whip-stubby type is a combination of a whip antenna and a helix stubby antenna. When the whip is extended, it dominates the radiation because the whip is much longer than the stubby and can achieve a better performance. When the whip is retracted, the stubby becomes the primary radiator.
Regarding the phone models with an internal antenna, the number of models is evenly spread across the CDMA BC4 and WCDMA services, except for the flip type with a top antenna, as shown in Table 1. The flip-type models with a top antenna were rarely used on WCDMA networks. A simple simulation using the finite-difference time-domain technique showed that the difference between spatial peak 1- and 10-g SARs at 1,765 MHz (center frequency of CDMA2000 BC4) and 1,950 MHz (center frequency of WCDMA band [UMTSBand1] and at 1,850 MHz in the standard flat phantom exposed to a dipole antenna were found to be within 6%. The SAR difference has gradually declined as the distance from the inner surface of the phantom has increased. Therefore, 1,850 MHz was the target frequency of a numerical model for the CDMA2000 BC4 and WCDMA frequency bands.
Groups accounting for more than about 3% of all phone models are indicated in the bold boxes in Table 1. A numerical phone model with an internal antenna is intended to basically operate in the dual bands of 835 MHz and 1,850 MHz (1,765 MHz for a flip type with a top antenna), even though most models in Korea operate in one frequency band, either the 835 band or the 1,850 band. The group in each box is numerically implemented as one representative phone model according to the procedure shown in Fig. 1. However, a slider type with an internal antenna and a flip type with an external antenna are implemented as two phone structures, respectively: open- and closed-slider models for the slider type with an internal antenna and whip antenna and helical antenna models for the flip type with an external antenna.
The internal antenna was designed as a dual band planar inverted F antenna (PIFA) operating at 835 MHz (center frequency of CDMA2000 BC0) and 1,850 MHz representing the higher frequency bands (CDMA2000 BC4 and WCDMA). However, the flip type with a top antenna was designed to operate at 835 MHz and 1,765 MHz because only three models are equipped with WCDMA, as shown in Table 1. Based on the information in Table 1, a list of representative phone models can be drawn up, as shown in Table 2. Each model represents the corresponding group from the bold boxes in Table 1.
[Table 2.] List of representative mobile phone models

List of representative mobile phone models
III. REQUIREMENTS OF REPRESENTATIVE PHONE MODELS
1. Analysis of SAR Compliance Test Reports
The outer dimensions and 1-g SAR levels in the SAM phantom of each representative model in Table 2 were determined by analyzing SAR compliance test reports. Information found on the Internet was mainly used to find the outer dimensions. An SAR compliance test report following IEC 62209-1 [7] and the local SAR limit of the Korean government [9,10] provided the spatial peak 1-g SAR information about the left and right sides of the SAM phantom for the cheek and tilt positions at the center frequency of each phone model.
The averaged SAR values and dimensions for each type of commercial model are shown in Table 3 and became the design specifications (A) of each representative model, as described in Fig. 1. The dimensions of the slider-type models,
[Table 3.] Design requirement (A): phone dimensions and SAR levels in the SAM phantom
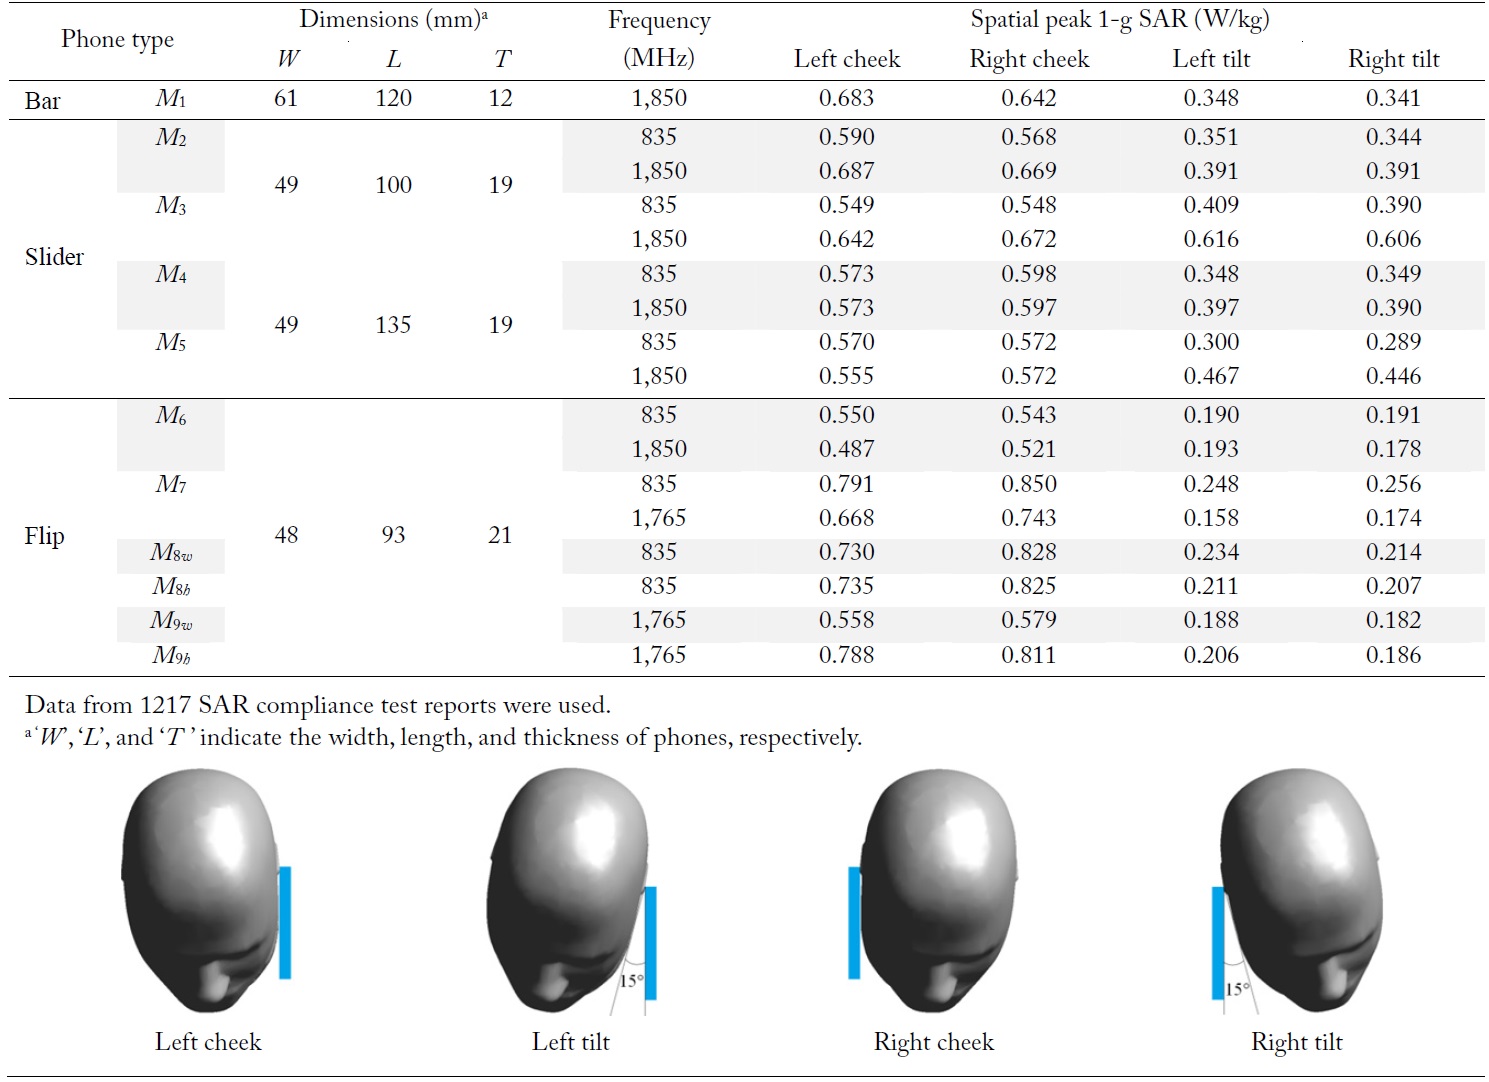
Design requirement (A): phone dimensions and SAR levels in the SAM phantom
It is noticeable that the SAR levels on the left and right sides of the SAM phantom are similar to each other for each of the cheek and tilt positions. In this study, our goal was for the SAR of each numerical model to fall within ±30% of the value given in Table 3.
2. SAR Patterns of Commercial Mobile Phones
Another important design specification can be derived from the measured SAR patterns of commercial phones. The SAR pattern in this paper denotes a two-dimensional SAR distribution on a plane in a flat phantom, which is used for body SAR compliance tests or system validation. In the SAR distribution at the surface of a head model, the location and level of the maximum SAR varies according to the position of the phone against the head. However, the SAR pattern in the flat phantom provides a useful measure for designing a numerical phone model.
When a mobile phone is against the human head, the user generally places the earpiece of the phone to their ear to listen to the other person’s voice. Regardless of the position, the earpiece is constantly located at the ear, which is referred to as the ear reference point (ERP) in IEC 62209-1 [7]. Therefore, the distance and direction of the maximum SAR from the earpiece of a phone are very important design parameters. In this paper, the earpiece is assumed as a reference point in an SAR pattern.
A total of 70 commercial phones were measured to determine their SAR pattern in a flat phantom. The specifications of the flat phantom follow IEC 62209-2 [8]. The maximum area that the electric field probe scanned was 120 mm × 230 mm. All scan areas cover a –7 dB contour of the maximum SAR at a height of 4 mm above the inner floor of the phantom.
The number of SAR patterns for the
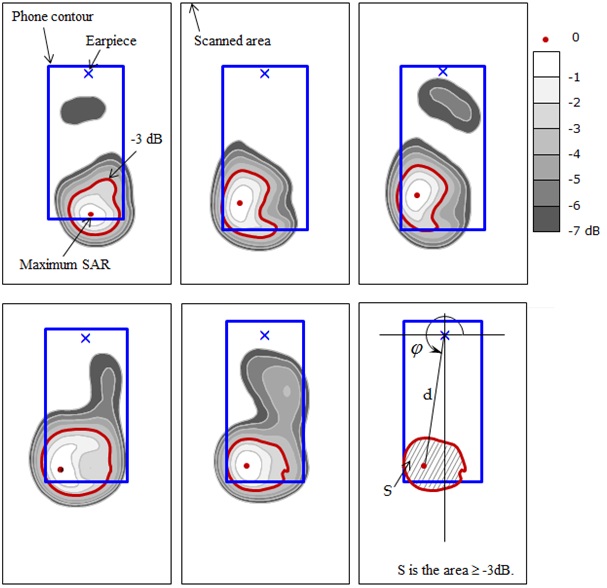
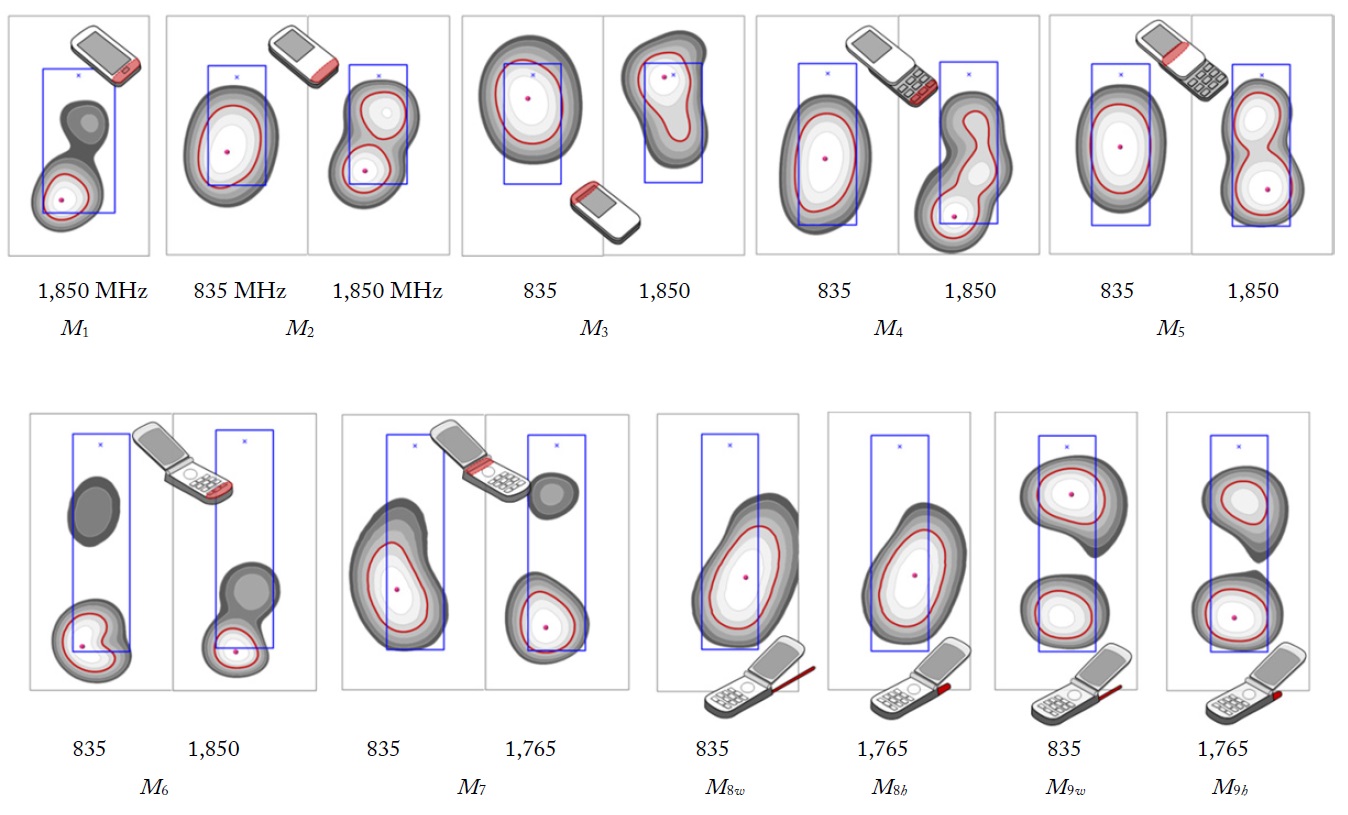
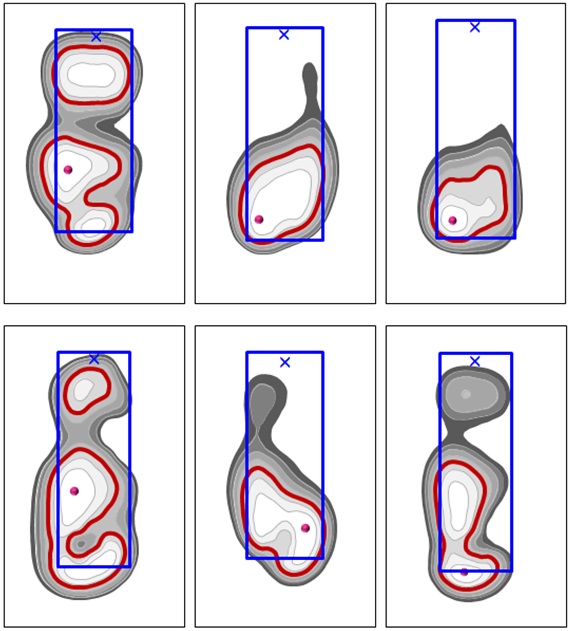
Fig. 3 shows some measured SAR patterns of commercial bar-type phones with the antenna at the bottom. Their frequency band is CDMA BC4 or WCDMA. These patterns were used to develop
The graph in the lower right-hand corner shows the parameters required for a representative pattern. Here, ‘φ’ and ‘
Similarly, Fig. 4 shows several SAR patterns of M4-type commercial models. A small number of models showed another contour isolated from the –3 dB contour that included the maximum SAR point. For example, patterns with two areas above –3 dB are shown on the left side of Fig. 4.
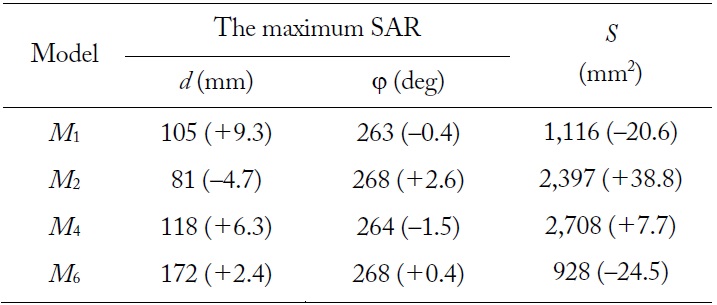
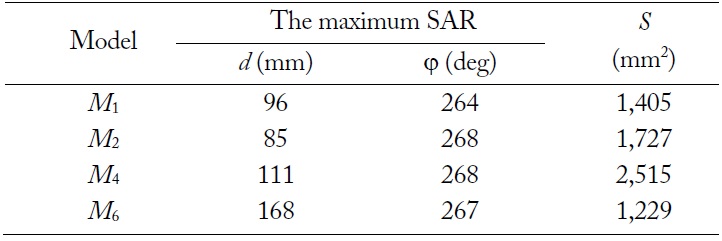
The average values of ‘
[Table 4.] Design requirement (B): SAR pattern

Design requirement (B): SAR pattern
IV. IMPLEMENTATION RESULTS OF REPRESENTATIVE PHONE MODELS
1. Structure and Characteristics of Representative Phone Models
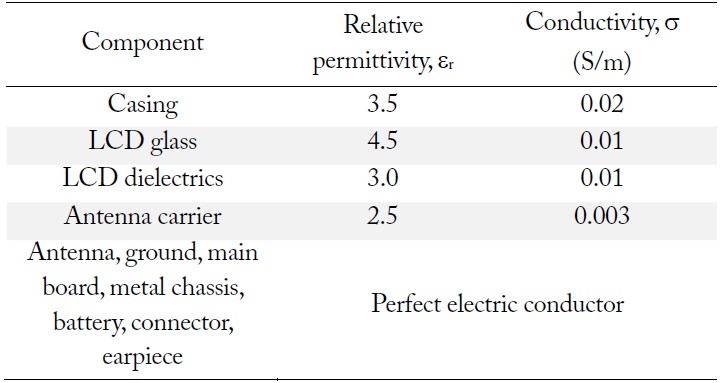
Commercial phones are composed of a huge number of components and materials, but in this study they were simplified to contain only the essential parts to meet the design requirements in Tables 3 and 4. The resultant numerical phone models consist of the main elements, including the casing, the liquid-crystal display (LCD) parts, a battery, a main board, a metal chassis, an antenna, and an antenna carrier, that affect the electrical performance of the phone. Generally, the metallic components play an important role in the radiation performance of the antenna, while the nonmetallic elements, such as plastic materials, affect the resonant frequency. The dielectric properties of the components shown in Table 5 are from previous studies [13,14]. The metallic parts were modeled as a perfect electric conductor (PEC) and are the antenna, main board, battery, metal chassis, connector, and earpiece.
[Table 5.] Dielectric properties of key components for numerical phone models

Dielectric properties of key components for numerical phone models
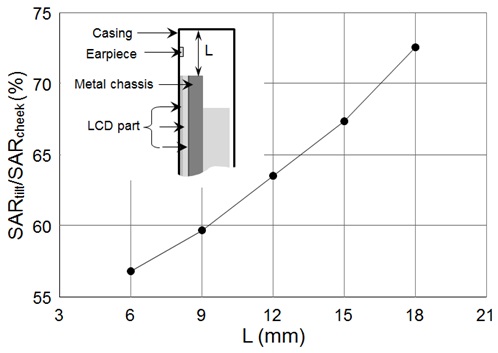
The performance of an internal antenna, such as a PIFA, greatly depends on the ground conditions. Moreover, the location of the antenna and dimensions of the chassis are key factors influencing the radiation characteristics of a mobile phone. In this study, the ratio of the SAR at the cheek position to the SAR at the tilt position should be optimized to meet the requirements in Table 3. The metal chassis was employed to adjust the SAR ratio by altering the distance from the top of the phone model to the chassis.
Fig. 5 shows the SAR ratio between the tilt and cheek positions on the right side of the SAM phantom. The changes in distance ‘
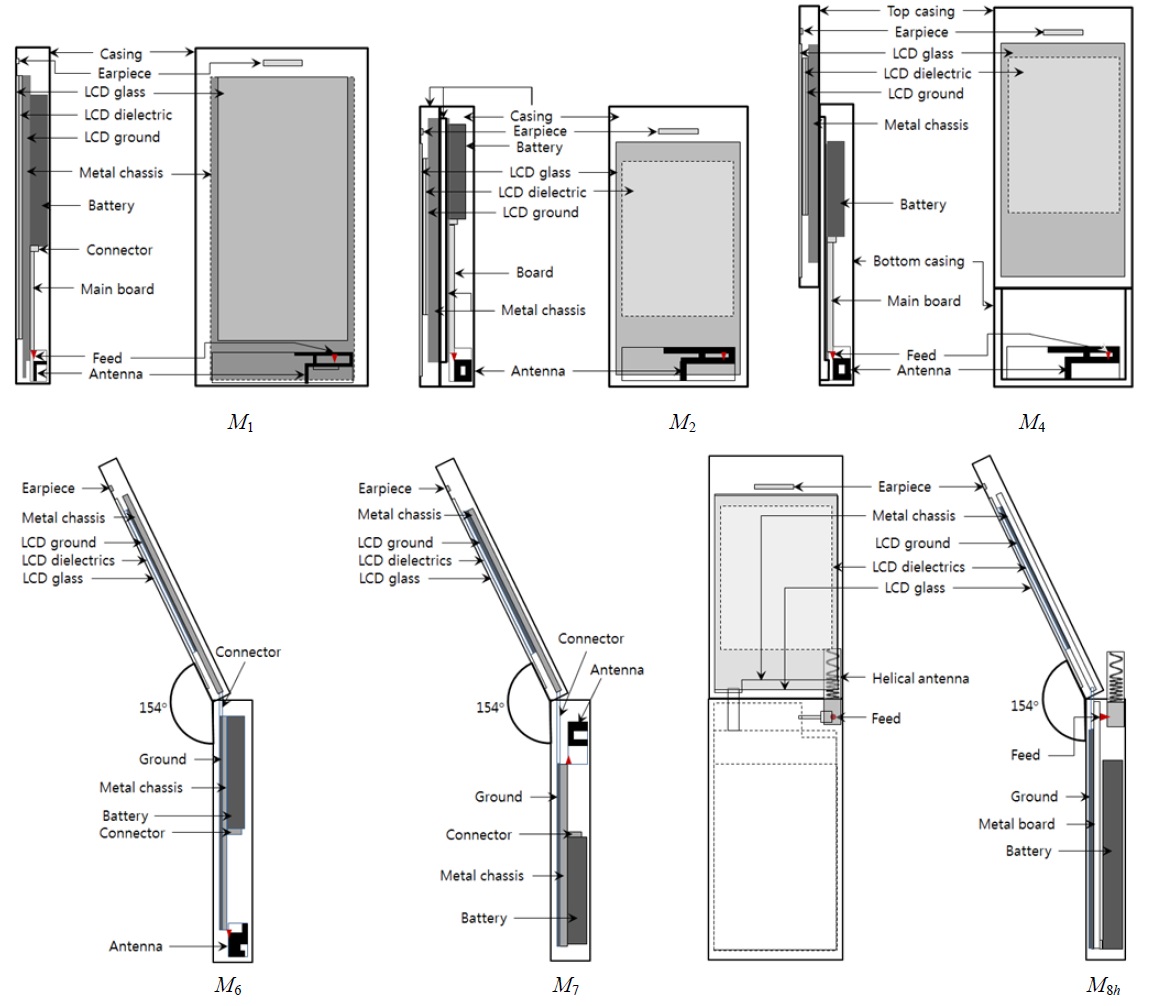
The spatial resolution of the final structures is 1 mm × 1 mm × 1 mm, except for the antenna part where the thickness of the dielectric cover and helical wire are 0.5 mm. Fig. 6 shows the structures of some representative phone models. Slide-type models in the open and closed positions are a little different in structure to meet the average SAR patterns and levels of commercial models. The open angle, 154°, of the flip-type models is the measured average of the commercial models.
A commercial electromagnetic simulation tool, SEMCAD X [15], with an FDTD solver was used for the reflection coefficient and SAR calculation. The spatial peak 1-g SAR was calculated according to IEEE Standard C95.3 [16].
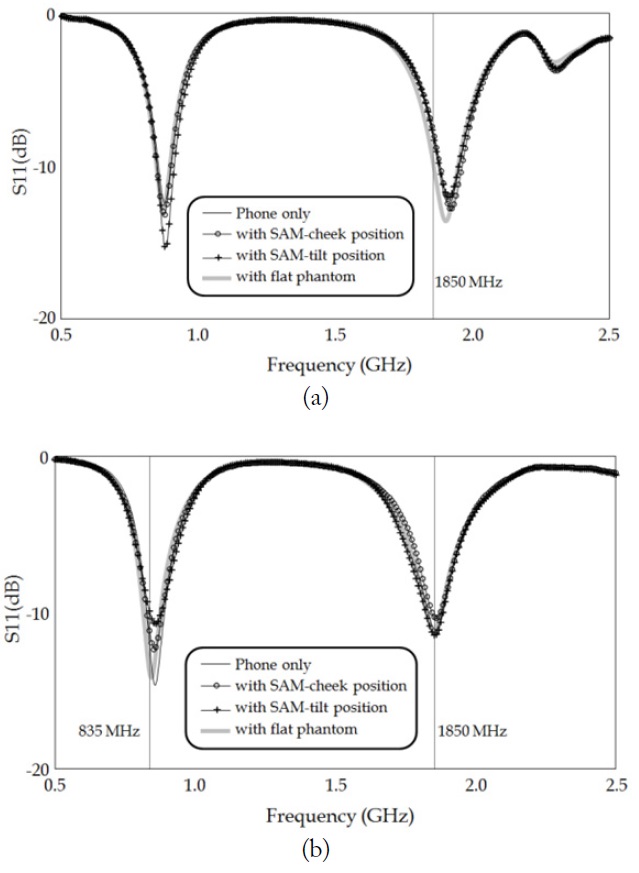
As previously stated, the internal antenna of the phone models was designed to operate in two frequency bands. The return loss was calculated when a phone model is at the cheek and tilt positions of the SAM phantom, when the phone model is at distance of 5 mm from the flat phantom, and when only the phone model exists. All models showed a return loss of more than 7 dB at each target frequency; some of the results are shown in Fig. 7.
Seventeen SAR patterns of all representative models in Table 2 are provided in Fig. 8. As stated in Section II, the target frequencies are 835 MHz and 1,850 MHz for the internal antenna of
[Table 6.] Design results: SAR patterns of representative phone models (CDMA BC4 or WCDMA)
Design results: SAR patterns of representative phone models (CDMA BC4 or WCDMA)
Most of the measured SAR patterns of eight
3. SAR Levels in the SAM Phantom
The SAR values of the representative phone models in the SAM phantom are shown in Table 7. Each representative phone model was intended to satisfy the SAR requirements of Table 3 within ±30% for all positions at one output power level. For example, in Table 3, the target SAR values of
[Table 7.] SAR levels in the SAM phantom for representative phone models
SAR levels in the SAM phantom for representative phone models
For simplification of the numerical models, unified dimensions of 48 mm × 93 mm × 21 mm are used for the flip-type phone models listed in Table 3, which were determined from all commercial flip-type models irrespective of the antenna type and location. However, more recently released
The SAR values of M6 operating at CDMA BC4 or WCDMA have a wider gap between the tilt and cheek positions compared with those in Table 3, even when the SAR difference between the right and left sides is negligible. This seems to produce a relatively high SAR in the cheek position because the length of
The output power of a phone model required for the optimum SAR levels to meet the requirements in Table 3 is also shown in Table 7. This power level, however, may be different from the maximum power levels when commercial phone models are tested for SAR compliance. Most of the commercial models include shielding materials or components for SAR reduction and electromagnetic interference countermeasures [17–19]. Therefore, a simplified representative model generally provides similar SAR levels at a lower power than the maximum possible power of commercial models.
The output power values between
Some slider-type models allow phones to be used only when open. About 20%–40% of all slider models are of this type, and the percentage varies a little according to frequency band and antenna location. It was found that the commercial models of
The difference between the output power levels of the representative and real commercial phone models does not matter when estimating SAR in the human head for a specific real phone. A method to evaluate SAR in a human head model exposed to a commercial phone model is proposed in the next section.
SAR compliance test reports provide the spatial peak 1-g SAR information measured with the maximum output power of the corresponding mobile phone based on international measurement standards and the local SAR limit given by Korean government. The technical standards of the Korean government for radio communications equipment state that a mobile device should transmit power lower than 2 W [20]. However, in practice, the maximum possible power of commercial mobile phones released in Korea is below 500 mW, and most have 250 or 300 mW according to the SAR compliance test reports.
As stated above, the simplified representative models in Table 7 generally provide similar SAR levels at a lower power than the maximum of commercial models. The SAR of a specific commercial phone in a given real environment would be estimated for an epidemiological study. There are two factors that significantly affect the SAR level during real use. The first is that commercial phones have a wide range of SAR levels even though they belong to the same class.
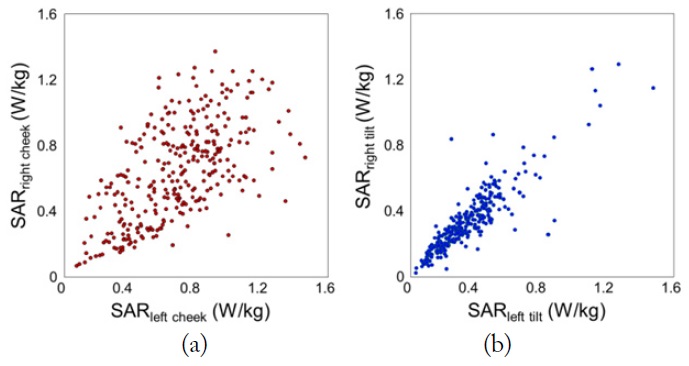
Fig. 9 shows the scatter plots obtained using the 1-g peak spatial SAR data from the SAR test reports. For commercial phones of the same type, the SAR values on the left and right sides of the phantom are very similar, and the correlation was good (0.6–0.9). However, the SAR information from the test reports should be reflected in SAR estimation in the human head because the SAR values vary considerably according to phone model. To reduce the SAR gap between a specific commercial phone model and its representative model, the SAR factor for different types of phone models has been studied in [21].
The other factor is that real transmitted power in operating networks is time varying and generally much lower compared to the exposure measured in laboratories with the maximum power. The information on the real exposure of study subjects is very important for epidemiological studies. Several studies have been published about the transmitted (Tx) and received (Rx) power variation of mobile phones in operating networks and the estimated exposure in the human body.
The previous studies on the output power of mobiles phones in operating networks were mainly conducted in European countries [22–24]. The 3G UMTS (WCDMA) is available in Asia as well as in Europe and North America. However, there seems to be a lack of data in Asia; therefore, the authors are investigating the Tx and Rx power set of CDMA2000 BC0, BC4, and WCDMA terminals in Seoul and Gyeonggi Province, Korea. The influence in indoor/outdoor and rural/urban, environments will be considered for data collection in each network of operators. The deviation between the powers of different phone models in the same class will be also investigated. Measurement data are collected using commercial mobile phones controlled by software (OPTis-S; Innowireless Co. Ltd., Seongnam, Korea) on a notebook computer.
Assuming that the SAR in a numerical head model (Head1) exposed to
where SFA-xx is the SAR factor of a commercial phone model (A-xx) based on its SAR test report and the SAR data calculated in the SAM phantom for
To investigate the health risks related to mobile phone use, the first step in an exposure assessment is to determine the SAR distribution and level in subjects’ brains resulting from mobile phone radiation at the maximum power. The SAR distribution and level in a human brain exposed to radiation from a mobile phone depend on many factors, such as the phone structure, operating frequency, shape and location of the antenna, head size, and use position [25]
In this study, we proposed 11 numerical phone models representing commercial mobile phones that have been released in Korea since the government began to regulate the SAR from mobile phones. SAR compliance test reports for most commercial mobile phone models were collected, analyzed, and classified. The average spatial peak 1-g SAR values at the center frequency for the same categories of phones were obtained. The SAR distributions of commercial phones in a flat phantom were measured to determine the typical SAR pattern of each category of commercial phone models. The numerical phone models were designed to meet the representative spatial peak 1-g SAR values and SAR pattern. However, the SAR pattern requirements for several types were not available because there were difficulties in purchasing older models, often because few commercial models of the corresponding type were released.
SAR calculations were completed in anatomical head models for the representative phone models. We plan to work on the following tasks in the near future:


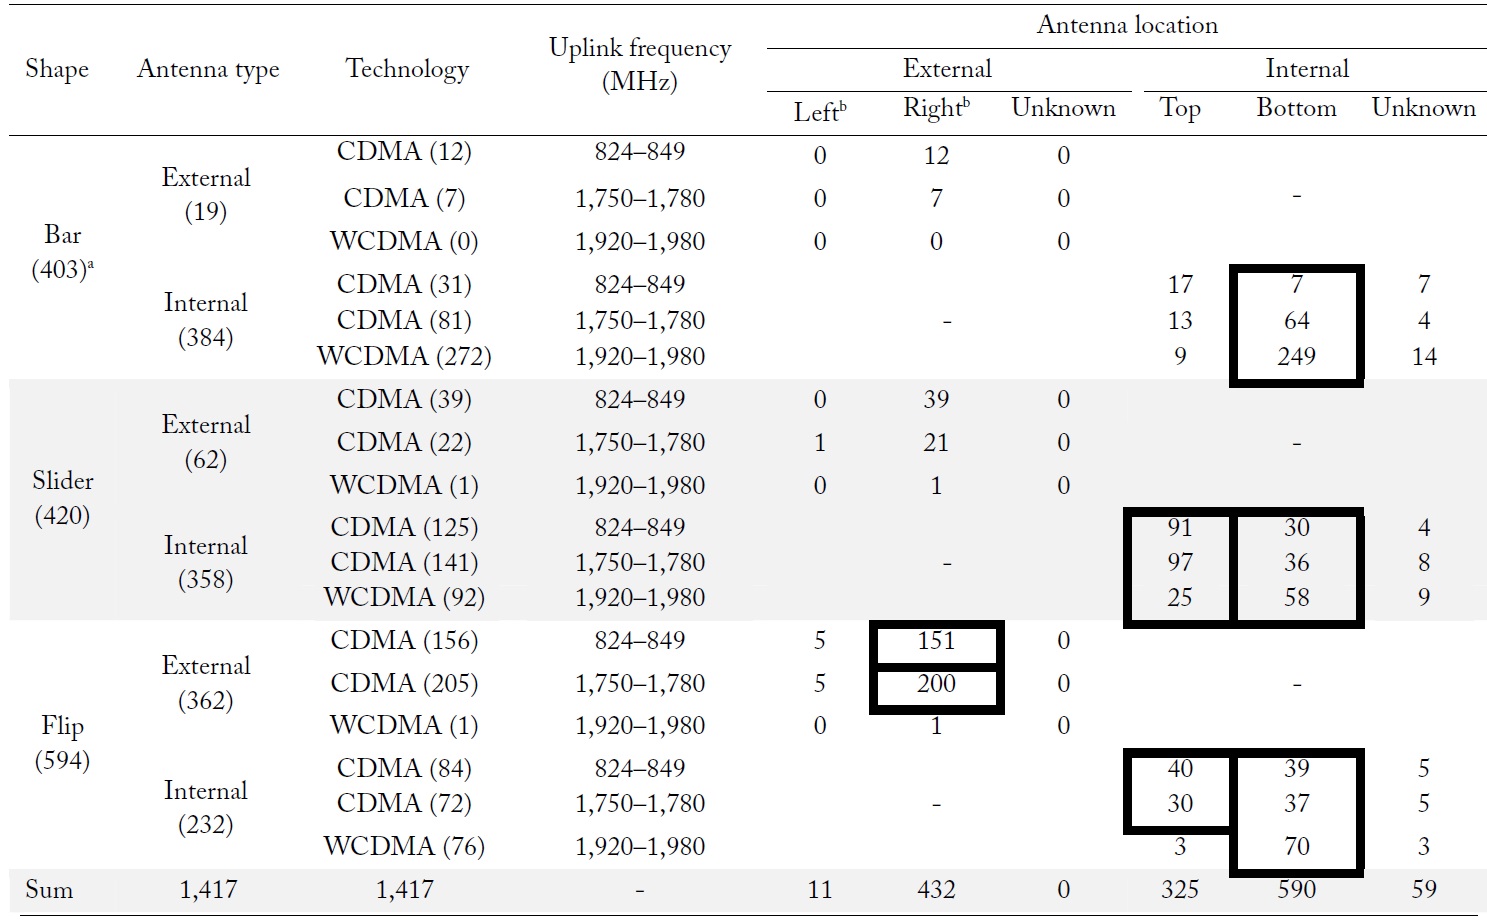


![Scatter plot of the 1-g peak spatial SAR values measured on the left and right sides of the SAM phantom for the M1 type of commercial phone models (CDMA BC4 or WCDMA) [21]. (a) Cheek position and (b) Tilt position.](http://oak.go.kr/repository/journal/20412/E1ELAT_2016_v16n2_87_f009.jpg)