검색 전체 메뉴
PDF
맨 위로
OA 학술지
RF Conductivity Measurement of Conductive Zell Fabric
  • 비영리 CC BY-NC
  • 비영리 CC BY-NC
ABSTRACT
RF Conductivity Measurement of Conductive Zell Fabric
KEYWORD
Conductivity , Material Characterization , Ring Resonator , Zell Fabric
  • I. INTRODUCTION

    In recent years, wearable antennas for body-worn communication systems have been studied extensively [1]. One way to realize such antennas is by using conductive fabrics [2]. Such fabrics are highly flexible, durable, and restorable, and they can be directly integrated onto clothing by ordinary sewing or embroidering techniques. To derive an appropriate antenna design, it is essential to have accurate information about the electrical properties of conductive fabrics, especially the conductivity (σ) at the antenna’s operation frequency.

    Commonly, the manufacturers of conductive fabrics provide the DC sheet resistances (Rs) measured by the well-known four-point probe or van der Pauw methods [3,4]. The DC sheet resistance values range from 0.02 to 0.8 Ω/sq [5], implying that the DC conductivity ranges from s=1.2×10⁴ to 5×10⁵ S/m based on the formula s=1/(Rs×t), where t is the thickness of the fabric. This study aims to measure the RF conductivity instead of the DC one to realize accurate modeling of wearable antennas.

    Many studies have measured the RF permittivity of dielectrics. However, few studies have measured the conductivity of highly conductive materials at RF. In [6,7], a planar resonator is used as a test fixture to measure the quality factor (Q-factor) with the conductor under test inserted in. Then, the conductor’s σ is obtained from a closed-form equation of the Q-factor under the assumption that the dielectric and radiation losses are trivial. However, in practice, these losses may distort the resulting σ, and they should not be underestimated.

    As an alternative, full-wave simulation data can be used to estimate the conductivity instead of the approximate closed-form equations.In a full-wave simulation tool, a structure identical to the material under test is modeled, and then, the simulation data is collected by varying the material properties (e.g., σ). Subsequently, the measured and simulated data are compared in a root-searching algorithm to find the best fit. Recent reports have verified the effectiveness of this method for the measurement of the dielectric constant (εr) and loss tangent (tan δ) of an antenna substrate [8,9].

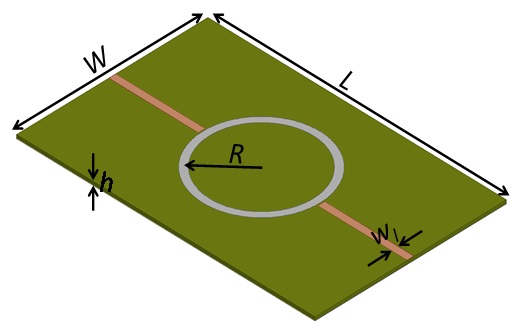
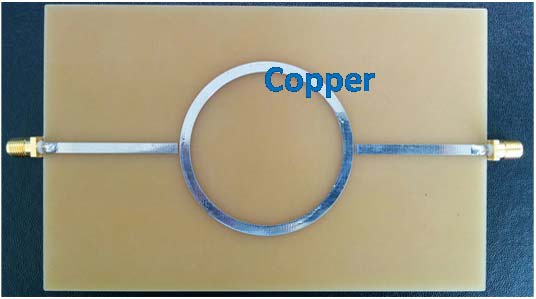
    In this paper, we present a conductivity measurement method by employing a planar ring resonator (shown in Fig. 1) and surrogate-based optimization (SBO) [10] as the root-searching tool. Section II provides an outline of the measurement process. Section III demonstrates the effectiveness of the proposed method by measuring a copper ring with known conductivity. Section IV discusses the conductivity measurement of the Zell fabric. The results appear to be within the order of 104 S/m, which is lower than the DC conductivity of the order of 105 S/m reported by the manufacturer.

    II. OVERVIEW OF PROPOSED MEASUREMENT METHOD

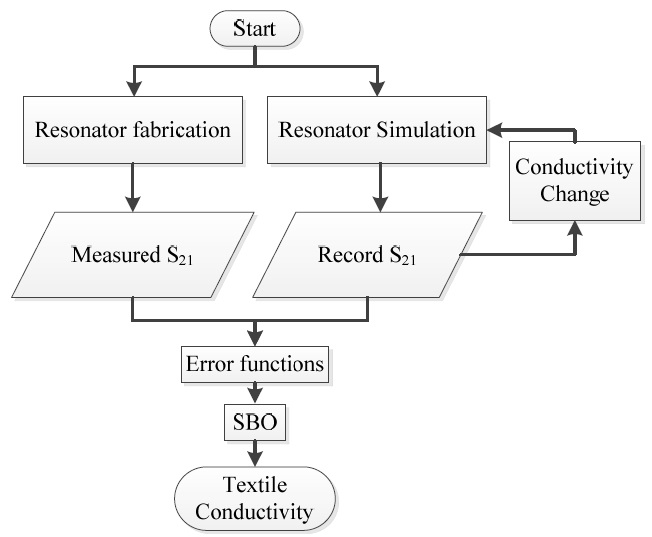
    Fig. 2 shows a flowchart of the conductivity measurement process. A microstrip ring resonator with H=1.6 mm, W=90 mm, and L=140.3 mm is fabricated on a FR-4 substrate to measure the transmission coefficient (S21). This resonator is fabricated to exhibit a resonance of around 2 GHz, which is the frequency of interest. The transmission lines between the ports and ring are made of copper, and the ring is made of the material under test. The main radius of the ring is R=25.9 mm, and the width of both the ring and the transmission lines is wl=3.2 mm to conform to the 50-Ω impedance matching condition at 2 GHz. The coupling gap separating the feeding lines from the ring should have an appropriate size to avoid any effect on the fields of the resonant structure and to minimize losses. Specifically, the gap is set to 0.64 mm to support resonance around 2 GHz based on the ring resonator design equation found elsewhere [11].

    Meanwhile, a resonator identical to the fabricated one is modeled in a full-wave simulation tool (Ansys HFSS). The conductivity of the ring in the simulation model is varied to collect a set of S21 data, as shown in the right-hand-side branch in Fig. 2. The measured S21 and the set of simulated S21 values are then compared in an error function formulated using the magnitude and phase of S21. The conductivity of the unknown fabric is determined when the error function becomes zero (or close to zero). We use SBO as the iterative comparator to efficiently search for a σ value that minimizes the error function. SBO is widely used to find solutions of nonlinear electromagnetic problems as it offers an efficient iterative scheme by intelligently choosing the best sampling and evaluation strategies. In this work, the MATLAB toolbox for SBO providedby Ghent University, Belgium [12] is used.

    III. MEASUREMENT WITH COPPER RING RESONATOR

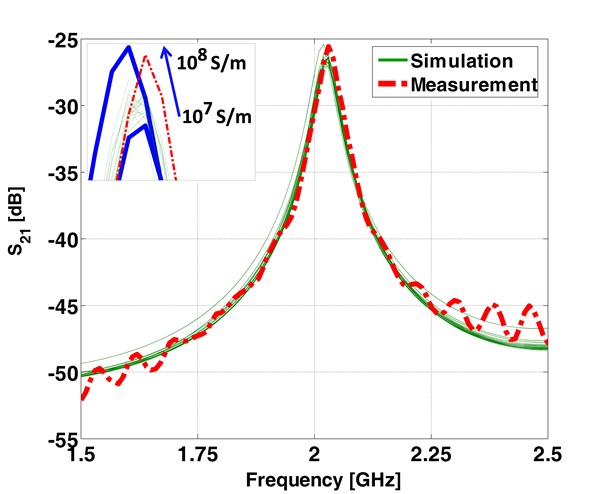
    The proposed measurement method is first tested with a ring made of copper. Fig. 3 shows the fabricated copper ring resonator and Fig. 4, the measured and simulated S21 magnitudes. For the simulation data, S21 is collected by varying s of the ring from 107 to 108 S/m with an interval of 100.0625 (i.e., 17 points are considered). As can be observed, the resonator is correctly designed to resonate around 2 GHz, and only a slight perturbation is observed in the simulation results as the copper conductivity is high enough.

    The set of simulated S21 values is compared with the measured S21 value using an error function in the SBO process. The error function should be formulated carefully to obtain an accurate result. Initially, we used an error function composed of only the magnitude of S21, namely,

    image

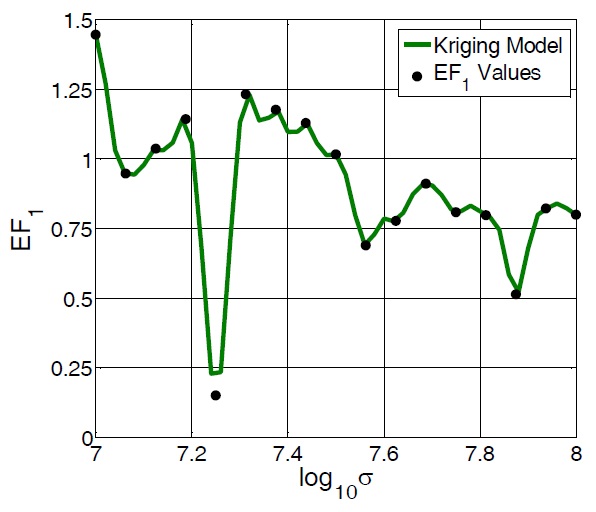
    where are the magnitudes of the simulation and measurement at the resonant frequency. Fig. 5 shows the error function values along the sampled conductivity points and the interpolated Kriging model after the SBO process. The error function is minimum at σ=107.24 (1.74×10⁷ S/m). This retrieved conductivity is lower than the DC conductivity of pure bulk copper (σ=5.7×10⁷ S/m) and is close to the conductivity of plated copper at microwave frequency [13,14]. It is also known that the conductivity becomes lower as the frequency increases owing to the skin effect and surface roughness.

    IV. MEASUREMENT OF ZELL FABRIC

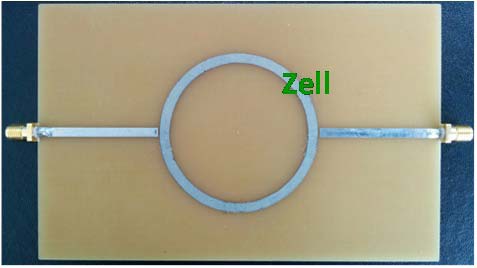
    After measuring the conductivity of copper using the proposed method, we measured the conductivity of the Zell fabric, a metalized nylon fabric. The Zell fabric under test has a thickness of 0.1 mm and DC surface resistance as low as 0.02 Ω/sq [5], corresponding to a DC conductivity of 5×10⁵ S/m.

    Fig. 6 shows the microstrip ring resonator with the ring made of Zell fabric. The Zell fabric ring is attached on the FR-4 substrate using fast-drying urethane glue. The glue has trivial influence on the resonator performance because its layer is very thin and its relative permittivity (3.2 at 23℃) is close to that of the FR-4 used. On the other hand, a ring resonator with the same dimension as that shown in Fig. 6 was modeled in the full-wave EM simulator, and S21 values were obtained by varying the conductivity of the ring from 103.75 to 106 S/m. pecifically, 37 values were collected with an interval of 100.0625 S/m. Fig. 7 shows the measured and simulated S21 magnitude data. The measurement is performed using Anritsu Vector Network Analyzer MS2038C, which as measurement uncertainty of 0.04 dB around 2 GHz.

    As shown in Fig. 7, the simulated S21 peak is broader and lower for the ring with lower conductivity, and the measured data falls somewhere within the simulated conductivity range.

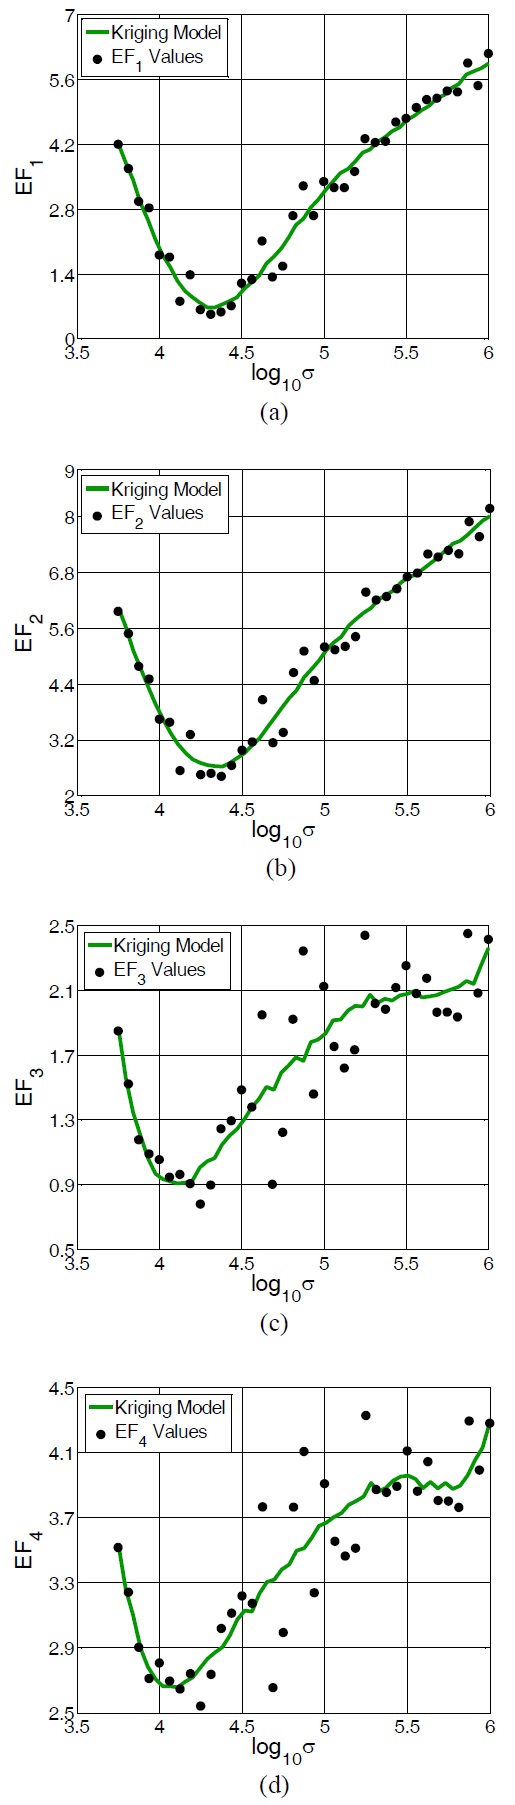
    For the conductivity retrieval process, we test four different error functions in addition to EF1 in the previous section. The other three are

    image

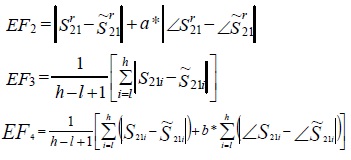
    where are the phase of the simulated and measured S21 at the resonant frequency, respectively. In EF3 and EF4, the arithmetic mean of S21 is used by averaging S21 data over a 300-MHz bandwidth (i.e., 31 frequency points). Here, h and l are index numbers of the frequencies that are 150 MHz higher and lower than the resonant frequency, respectively. The constants a and b in EF2 and EF4 are scaling factors to compensate for the difference of order between the magnitude and phase, respectively.

    The SBO toolbox compares the simulated and measured data using the abovementioned error functions to determine the conductivity of the Zell fabric. Fig. 8(a)–(d) show the resulting Kriging models when EF1 to EF4 are considered, respectively.

    The error function minima for EF1, EF2, EF3, and EF4 are located at σ=104.335 (2.16×10⁴ S/m), 104.38 (2.4×10⁴ S/m), 104.11 (1.29×10⁴ S/m), and 104.11 (1.29×10⁴ S/m), respectively. The consistency among these error functions demonstrates that including the phase (e.g., EF2) or averaging over a bandwidth (e.g., EF3 and EF4) does not alter the obtained conductivity value. This implies that formulating the error function using only the S21 magnitude (e.g., EF3) is sufficient to evaluate the conductivity using the proposed method. Furthermore, it should be noted that the measured conductivity of the Zell fabric at 2 GHz shows an order difference from the DC conductivity given by the manufacturer (5×10⁵ S/m) [5]. This may be due to the significant ohmic loss as well as the surface roughness seen at the microwave frequency.

    V. CONCLUSION

    In this paper, a new measurement technique for evaluating RF conductivity is described. The proposed method employs a microstrip ring resonator, full-wave simulation data, and SBO optimization technique to measure the conductivity of a conductive fabric at a microwave frequency. We first evaluated the conductivity of plated copper using the proposed method, and then, we applied it to measure the conductivity of a Zell fabric. For both cases, the conductivity values around 2 GHz were lower than the known DC conductivity. This is because high-frequency currents mostly flow along the surface owing to the skin effect and concurrent influence of the surface roughness of the conductor. Therefore, it is important to measure the high-frequency conductivity of newly introduced conductive materials to formulate an accurate model of antennas and RF components.

참고문헌
  • 1. Zhang L., Wang Z., Volakis J. L. 2012 "Textile antennas and sensors for body-worn applications," [IEEE Antennas and Wireless Propagation Letters] Vol.11 P.1690-1693 google cross ref
  • 2. Monti G., Corchia L., Tarricone L. 2013 "UHF wearable rectenna on textile materials," [IEEE Transactions on Antennas and Propagation] Vol.61 P.3869-3873 google cross ref
  • 3. Guillaume N. M., Cresswell M. W., Allen R. A., Everist S., Linholm L. W. 1999 "Comparison of sheet-resistance measurements obtained by standard and small-area four-point probing," [in Proceedings of the IEEE International Conference on Microelectronics Test Structures (ICMTS)] P.62-66 google
  • 4. Mian A., Suhling J. C., Jaeger R. C. 2006 "The van der Pauw stress sensor," [IEEE Sensors Journal] Vol.6 P.340-356 google cross ref
  • 5.
  • 6. Shimasaki H., Nakagawa T., Akiyama M. 2009 "Measurement of the surface resistance of conductive textiles at microwave frequency," [in Proceedings of IEEE Asia-Pacific Microwave Conference (APMC)] P.2580-583 google
  • 7. Rashidian A., Aligodarz M. T., Klymyshyn D. M. 2012 "Dielectric characterization of materials using a modified microstrip ring resonator technique," [IEEE Transactions on Dielectric and Electrical Insulation] Vol.19 P.1392-1399 google cross ref
  • 8. Declercq F., Couckuyt I., Rogier H., Dhaene T. 2013 "Environmental high frequency characterization of fabrics based on a novel surrogate modelling antenna technique," [IEEE Transactions on Antennas and Propagation] Vol.61 P.5200-5213 google cross ref
  • 9. Nguyen P. M., Chung J. Y. 2015 "Characterisation of antenna substrate properties using surrogate-based optimisation," [IET Microwave, Antennas and Propagation] Vol.9 P.867-871 google cross ref
  • 10. Couckuyt I., Declercq F., Dhaene T., Rogier H., Knockaert L. 2010 "Surrogate­based infill optimization applied to electromagnetic problems," [International Journal of RF and Microwave Computer­Aided Engineering] Vol.20 P.492-501 google cross ref
  • 11. Kapoor M. 2013 "Design fabrication and analysis of tunable planar microwave devices using EBG Structures," P.34-56 google
  • 12. SUMO: Surrogate Modeling Lab google
  • 13. Cruickshank D. 2011 Microwave Materials for Wireless Applications. google
  • 14. Fowler A. M. 1970 "Radio frequency performance of electroplated finishes," [in Proceedings of the Institution of Radio and Electronics Engineers (IREE)] P.148-164 google
OAK XML 통계
이미지 / 테이블
  • [ Fig. 1. ]  Geometry of microstrip ring resonators. The ring is made of the material under test.
    Geometry of microstrip ring resonators. The ring is made of the material under test.
  • [ Fig. 2. ]  Flow chart of the conductivity measurement process.
    Flow chart of the conductivity measurement process.
  • [ Fig. 3. ]  Fabricated copper ring resonator
    Fabricated copper ring resonator
  • [ Fig. 4. ]  Simulated and measured S21 of copper ring resonator (simulation from σ=107 to 108 S/m).
    Simulated and measured S21 of copper ring resonator (simulation from σ=107 to 108 S/m).
  • [ ] 
  • [ Fig. 5. ]  Error function values and corresponding Kriging model from surrogate-based optimization (SBO) process.
    Error function values and corresponding Kriging model from surrogate-based optimization (SBO) process.
  • [ Fig. 6. ]  Fabricated Zell ring resonator.
    Fabricated Zell ring resonator.
  • [ Fig. 7. ]  Simulated and measured S21 values of Zell ring resonator.
    Simulated and measured S21 values of Zell ring resonator.
  • [ ] 
  • [ Fig. 8. ]  (a?d) Error function values and corresponding Kriging models from surrogate-based optimization (SBO) process.
    (a?d) Error function values and corresponding Kriging models from surrogate-based optimization (SBO) process.
(우)06579 서울시 서초구 반포대로 201(반포동)
Tel. 02-537-6389 | Fax. 02-590-0571 | 문의 : oak2014@korea.kr
Copyright(c) National Library of Korea. All rights reserved.