A comparison of the antenna parameters for R-band (1.7–2.6 GHz) and S-band (2.6–3.95 GHz) standard gain horn antennas has been performed by the Korea Research Institute of Standards and Science (KRISS), together with seven domestic participants from private companies and public institutions. Its purpose, as a proficiency test program of the ‘Antenna Measurement Club’ of KRISS, was to check equivalences in antenna parameter measurements between KRISS and the participants, particularly in the R-/S-band, to support antenna manufacturers and end users in Korea. The measurement parameters of this comparison are the power gain, radiation pattern, and reflection coefficient of the traveling standards for R-/S-band pyramidal standard gain horn antennas. The comparison used a gain comparison method and an extrapolation method to measure the power gain of the two traveling standards; the radiation patterns were measured in the far-field region of the transmitting and receiving antennas.
The Korea Research Institute of Standards and Science (KRISS), as the national metrology institute of Korea, establishes and disseminates national measurement standards (traceable to international standards) and measurement technologies in Korea. The disseminations of the established measurement standards and technologies are accomplished through calibration and testing services, supply of certified reference materials, and education and training on measurement techniques for industry.
In 2008, the Center for Electromagnetic Wave of KRISS organized the ‘Antenna Measurement Club’ to provide a more effective and direct transfer of the established measurement standards and technologies. The main mission of this Measurement Club is to share technical knowledge of measurements and to establish networks among the club members who are interested in antenna measurements. At present, 39 organizations from academic, industrial, and research sectors have joined the club.
Since 2009, the Antenna Measurement Club has performed an annual antenna measurement comparison to support antenna manufacturers and end users in Korea as a proficiency test program of the club [1, 2]. In 2014, a comparison of power gains, radiation patterns, and reflection coefficients was performed for two R-/S-band standard gain horn antennas in a joint effort between KRISS and seven domestic participants from private companies and public institutions. Its purpose was to check the equivalences of the antenna parameter measurements determined by KRISS and the other participants for R-/S-band antennas.
A gain comparison method [3, 4] and an extrapolation method (the three-antenna method based on the extrapolation technique [5]) were used for measuring the power gains of the two traveling standards. The radiation patterns were measured in the far-field region of the transmitting and receiving antennas.
This paper describes the results of the comparison of antenna parameters of R-/S-band standard gain horn antennas by KRISS and seven domestic participants (henceforth, the participants) conducted in 2014.
II. DESCRIPTION OF THE COMPARISON
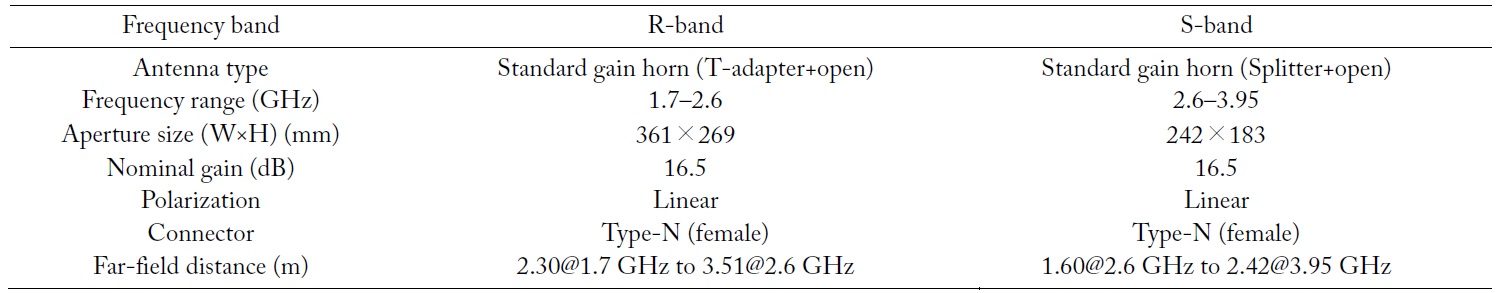
The traveling standards consist of two pyramidal standard gain horn antennas, one R-band (Narda 645) and one Sband (Narda 644), as shown in Table 1. These traveling standards are selected to check the consistency between measurements made by KRISS and by the participants for three antenna parameters (power gain, radiation pattern, and reflection coefficient) used to characterize general purpose antennas (e.g., standard gain horn and double ridged horn antennas). As shown in Table 1, the far-field distance, 2
[Table 1.] Specifications of traveling standards

Specifications of traveling standards
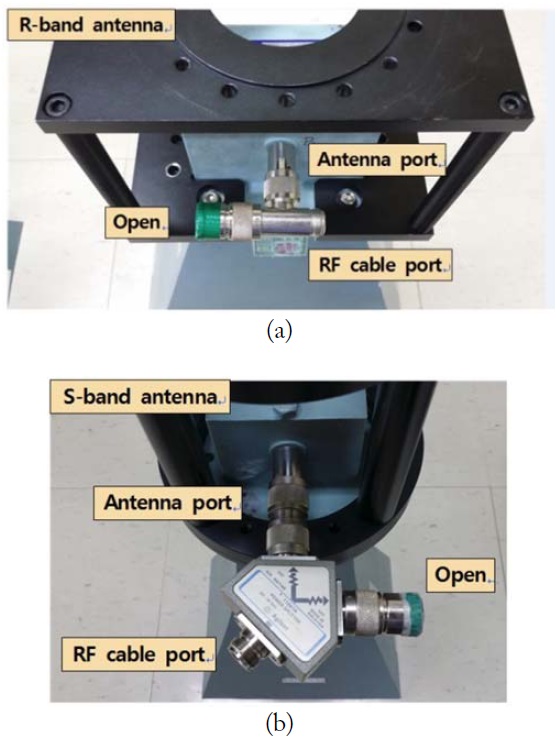
These traveling antennas have been used in comparisons conducted in previous years. The input port of the R-/Sband antennas is connected to an output port (#1) of a Tadapter and a splitter, an open is connected to the other output port (#2) of the three-port device, and the input port (#3) is used as the input port of the horn antenna, as shown in Fig. 1. These three-port devices with an open are selected to increase the reflection coefficient of the antennas, which worsens the impedance match at the input port.
The fixed-frequency power gain is measured at the lowest, mid, and highest frequencies of the operating frequency range of each traveling standard (i.e., 1.7, 2.1, 2.6 GHz for the R-band and 2.6, 3.3, 3.95 GHz for the S-band), and, as an option, the swept-frequency power gain is measured over the operating frequency range with a finite frequency step (usually 10 MHz). A gain margin of ±0.5 dB from the gain determined by KRISS is selected as a criterion of agreement between KRISS and the participants for the power gain measurements.
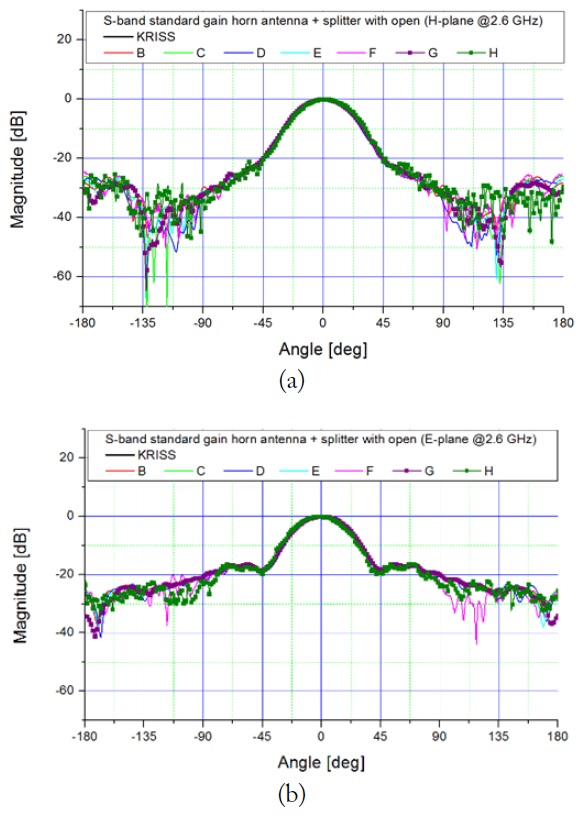
The co-polarized radiation pattern of the traveling standards is measured in the E-/H-planes at 2.6 GHz with a finite rotating angle step (usually 0.5 degree). The 3-dB beamwidth is also measured.
The complex reflection coefficients of the antennas—the traveling antennas, standard (or reference) antennas used in the gain comparison method, and additional antennas used in the extrapolation method—and the instruments used for the measurements are also measured over the operating frequency range with a finite frequency step (usually 10 MHz) to provide impedance mismatch correction.
An alignment mark is placed on the antenna surface to define the geometric coordinates of each antenna for the measurements.
The time allocated for each participant to perform the measurements and to transfer the traveling standards to the next participant is three days. A report containing the measurement description and result must be sent to KRISS within one week after performing the measurements.
III. MEASUREMENT TECHNIQUE AND SYSTEM
Conventional antenna measurements are typically conducted in an anechoic chamber, with the far-field power gain of the antenna under test (AUT) obtained using the gain comparison method and the AUT radiation pattern determined by measuring the received power of the AUT while rotating it in azimuth direction, with the AUT placed in the far-field region of the transmitting and receiving antennas. The extrapolation method is used at the National Metrology Institutes to obtain the best measurement accuracy of the antenna power gain and polarization measurements.
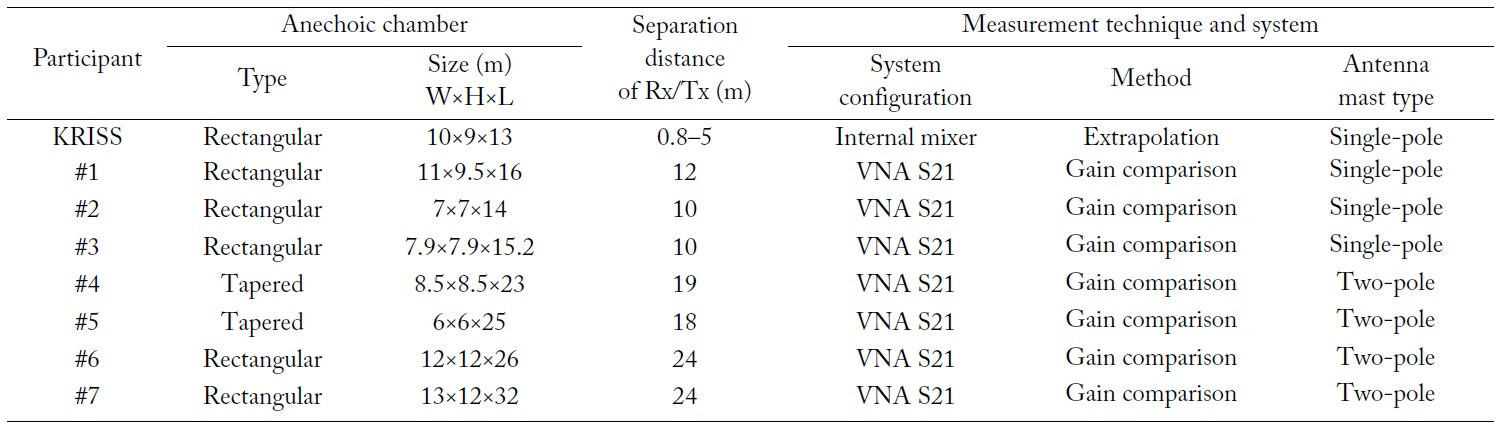
The measurement of the power gain of the two traveling standards was conducted by all the participants using the gain comparison method, which provided gain measurements only at a finite distance between the transmitting and receiving antennas. The KRISS measurements, by contrast, were obtained using the extrapolation method, which is capable of providing gain data at an infinite distance (i.e., in the far-field region) as well as at a finite distance, as summarized in Table 2.
[Table 2.] Summary of measurement technique and system of participants
Summary of measurement technique and system of participants
All participants measured the radiation pattern of the traveling standards in the far-field region, where the separation distance between the transmitting and receiving antennas is larger than the sum, of the far-field distance of each antenna, where
The complex reflection coefficients needed for impedance mismatch correction were measured with commercial vector network analyzers (VNA).
For the power gain, KRISS used the extrapolation method for all the traveling standards. Extrapolation measurements were performed in an antenna test range, which is installed in a shielded room with dimensions of 10 m (
KRISS used a microwave measurement system, which consists of a microwave receiver and a distributed frequency converter; the latter is based on an internal mixer and is used to down-convert the received microwave signal to an IF signal that can be measured by the receiver.
Additional horn antennas were used for the three-antenna method. The initial and final separations between the transmitting and receiving antennas were 0.8 m and 5 m, respectively. A three-term polynomial, in terms of the normalized reciprocal distance, was used for curve fitting in the gain analysis for the extrapolation method.
The measurement techniques and systems for the gain comparison method used by all the participants are summarized in Table 2. For example, participant #7 performed the power gain and pattern measurements with a vector network analyzer at a separation distance of 24 m between transmitting and receiving antennas, in a rectangular anechoic chamber with dimensions of 13 m (
All the participants used a commercial vector network analyzer as a measuring instrument. In the gain comparison measurements, participants used data provided by the manu-facturer or data calibrated by KRISS as their standard antenna’s calibration data.
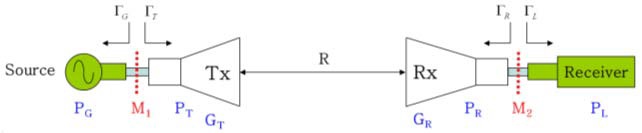
The gain comparison method [3, 4, 6] used by all the participants is briefly described. The transmitting and receiving antennas, whose main-beams are aligned with the line of measurement, are assumed to be polarization matched in the far-field region of both antennas.
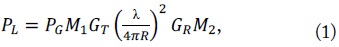
According to the Friis transmission formula, when a signal of power

where
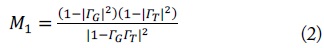
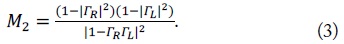
In (2) and (3),
In the gain comparison method, comparison of the power received with an AUT and with a known standard antenna gives the gain of the AUT as
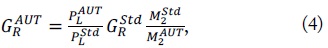
where is the ratio of the power received with the AUT and standard antenna, is gain of the standard antenna, and is the ratio of the mismatch factors with the standard antenna and AUT at connection with the receiver.
In (4), the mismatch factor ratio may be a measure of performance of the gain comparison measurement system because the ratio is equal to one if the AUT, standard antenna, and receiver are impedance matched. A correct compensation of the mismatch effect requires that the reflection coefficients of the antennas and receiver used in the gain comparison measurement are accurately measured with an impedance measuring instrument such as a vector network analyzer.
In Table 3, the fixed-frequency power gain values printed in bold italic font indicate that the participant’s gain is out of the gain margin of ±0.5 dB, where the minimum and maximum deviations from KRISS’s value are 0.01 dB at 2.1 GHz and 1.97 dB at 2.6 GHz, respectively, for the R-band and 0.06 dB at 3.3 GHz and 1.09 dB at 2.6 GHz, respectively, for the S-band. This means that some of the participants are not sufficiently competent to have equivalence with KRISS in their power gain measurements. The averages and standard deviations in Table 3 are calculated from the measured data only from the participants, and do not include those of KRISS.
[Table 3.] Fixed-frequency power gain of R-/S-band antennas (unit: dB)
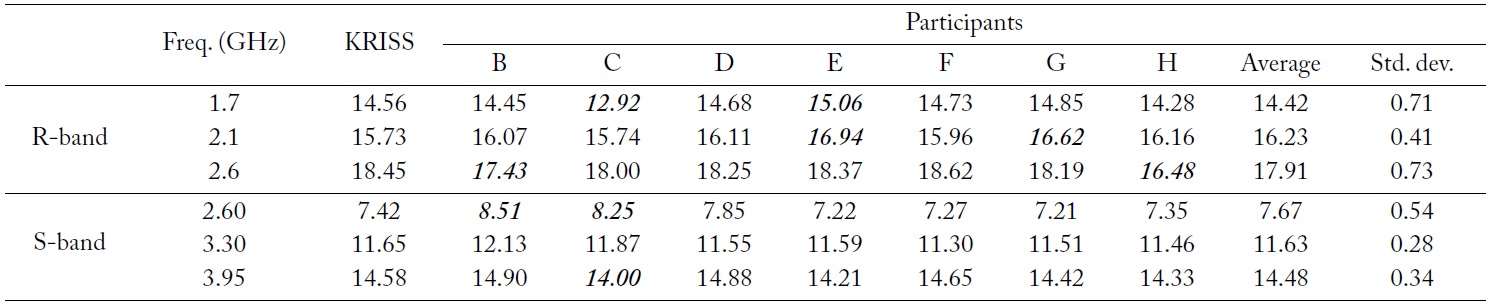
Fixed-frequency power gain of R-/S-band antennas (unit: dB)
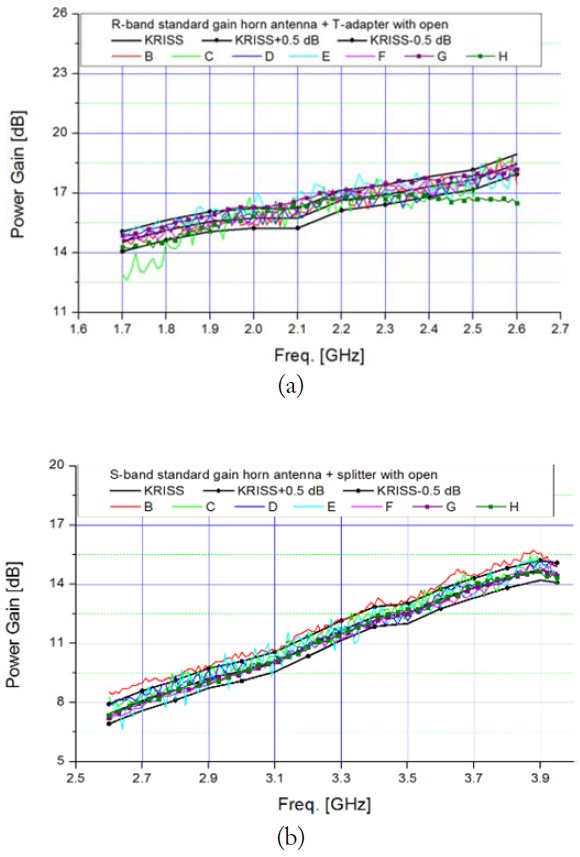
Fig. 3 shows that swept-frequency power gains of most of the participants, measured at the finite distances, are roughly within ±0.5 dB from the far-field ones obtained by KRISS at an infinite distance, while some of the participants show gain fluctuations and deviations that presumably are due to the lack of correct compensation for the impedance mismatch at the receiving part of the gain measurement system.
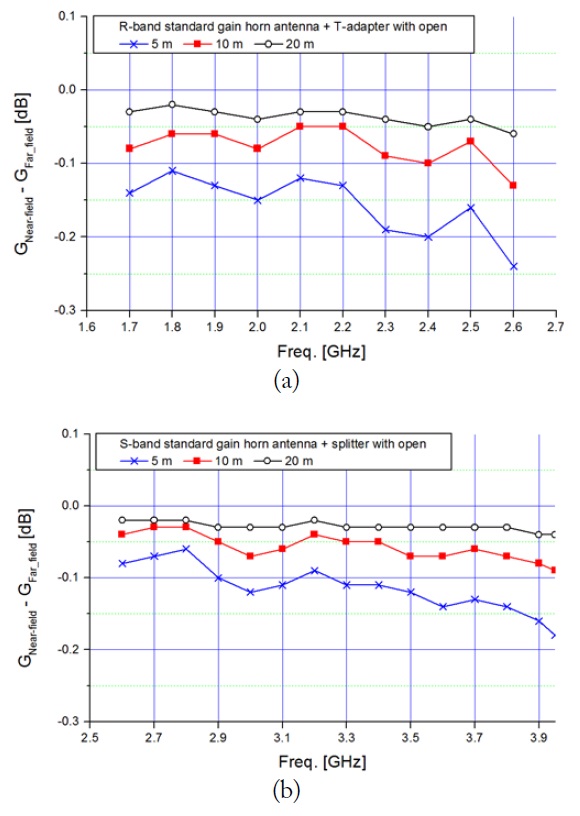
The finite-distance power gain of aperture antennas, such as horn antennas, decreases with the distance from the antenna due to the near-field gain reduction effect. This phenomenon becomes significant as the antenna gain increases, so this effect must be checked because all the participants used the gain comparison method that gives a power gain only at a finite distance, not at an infinite distance, from the antenna.
Fig. 4 shows the differences between the infinite-distance and finite-distance gains calculated at the separation distances of 5 m, 10 m, and 20 m for R-/S-band antennas. These differences increase with frequency and inversely with the separation distance and this phenomenon becomes significant for high gain antennas with a long far-field distancein this case, the R-band antenna. Fig. 4 shows that the maximum difference at the finite distance of 10 m is -0.13 dB at 2.6 GHz for the R-band and -0.09 dB at 3.95 GHz for the S-band. In this comparison, the near-field gain reduction effect of the R-/S-band antennas can be ignored because the maximum difference between the infinite-distance and finite-distance gains, calculated at the separation distances of 10 m, is smaller than the gain margin of ±0.5 dB.
The minimum separation distance required for radiation pattern measurements may be defined as the sum of the farfield distances of transmitting and receiving antennas. If the traveling antennas with the far-field distance, as in Table 1, are used as the receiving antennas and the far-field distance of the transmitting antenna for each participant is the same as shown in Table 4, then Table 2 shows that the separation distance of the transmitting antenna and AUT at each participant is larger than the sum of far-field distance of the two antennas. For example, participant #2, with the shortest separation distance among the participants, measured the radiation pattern of the R-band antenna at a separation distance of 10 m at 2.6 GHz, where the transmitting antenna and AUT have the far-field distances of 4.83 m and 3.51 m, respectively. This means that all the participants satisfy the far-field criterion for radiation pattern measurements.
[Table 4.] Far-field distance of transmitting antenna of participants (unit: m)
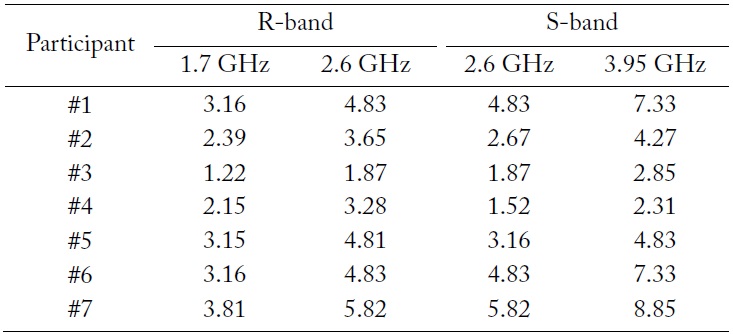
Far-field distance of transmitting antenna of participants (unit: m)
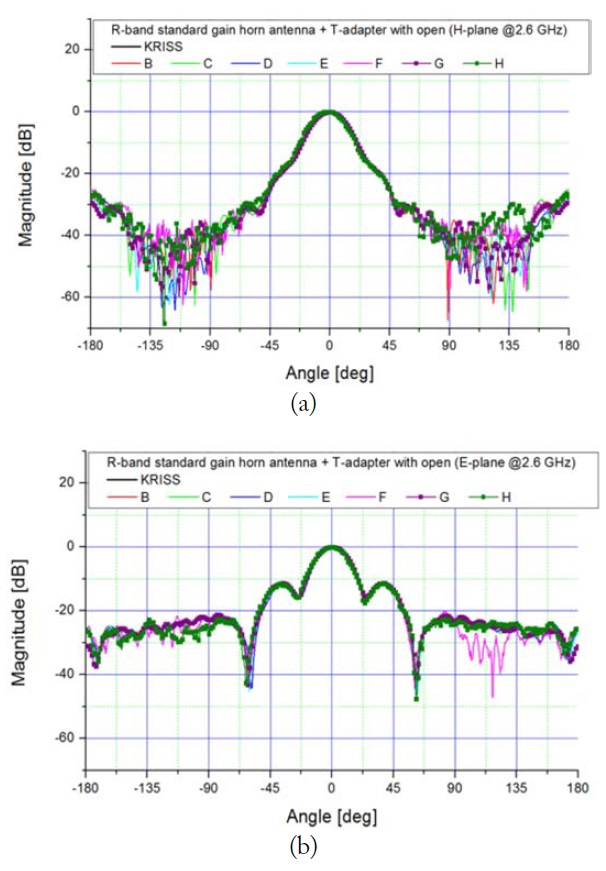
For the radiation pattern comparison, participants used two kinds of antenna masts: single- and two-pole types. The single-pole antenna mast, conventionally used in the radiation pattern measurements of horn antennas, has the AUT mounted at the top of a pole vertically installed in an anechoic chamber. The two-pole type antenna mast, which is suitable for radiation pattern measurements of squinted beam antennas such as base station antennas, has the AUT mounted at the center of a horizontal boom connecting the tops of each of the two poles, which are vertically installed in the anechoic chamber. If a two-pole antenna mast is used for the radiation pattern measurement of horn antennas, the poles can scatter and block the incident wave radiated from the transmitting antenna in the angular region far away from the bore-sight direction of the receiving antenna. The result is co-polarized H-/E-plane radiation patterns that roughly agree with each other in the angular region smaller than 45 degrees from the bore-sight direction, as shown in Figs. 5 and 6.
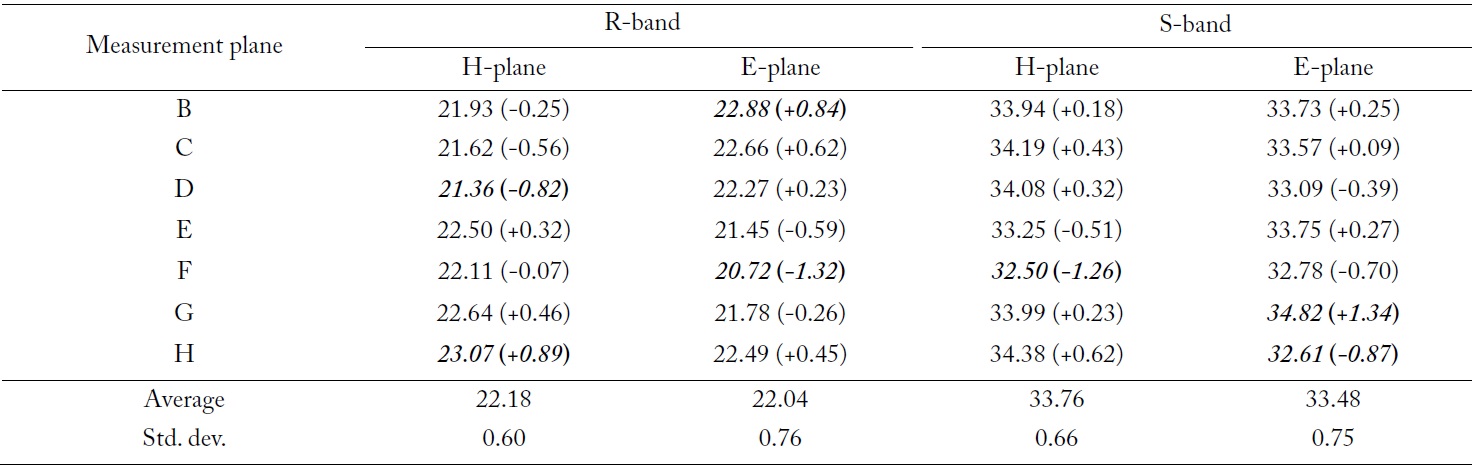
Table 5 shows that the 3-dB beamwidth of the co-polarized radiation pattern of R-/S-band antennas at 2.6 GHz roughly agree with each other, where the averages and standard deviations are calculated from the measurement data of all the participants. In Table 5, the beamwidth values in bold italic font indicate that those values are out of the range of the average ± its standard deviation; the values in parentheses indicate their differences from the average.
[Table 5.] The 3-dB beamwidth of co-polarized radiation pattern at 2.6 GHz (unit: degree)

The 3-dB beamwidth of co-polarized radiation pattern at 2.6 GHz (unit: degree)
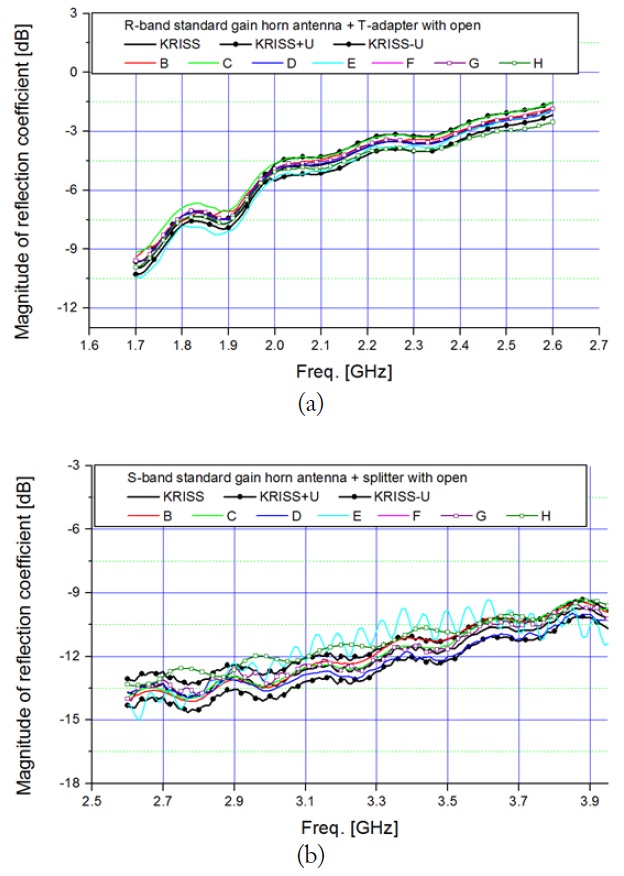
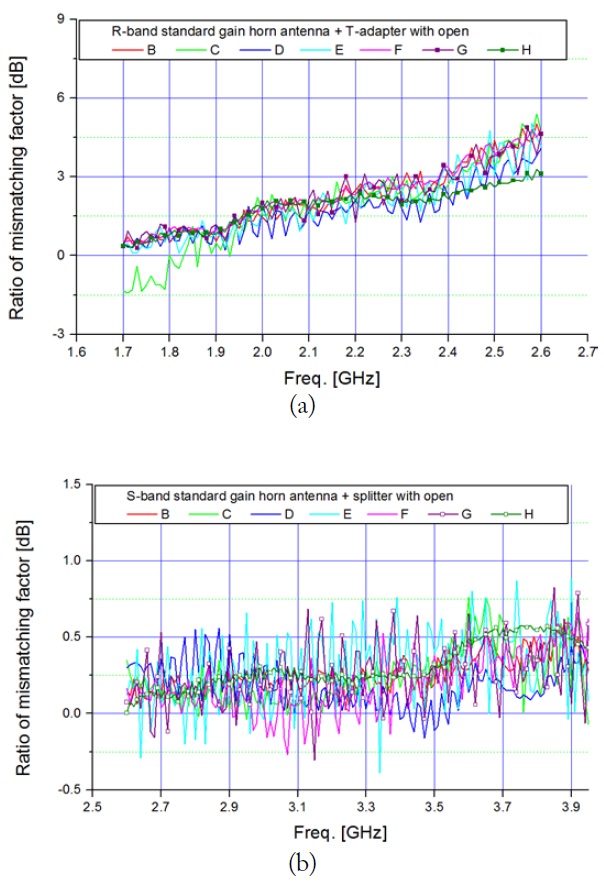
Fig. 7 shows that the results generated by most of the participants for R-band antenna are roughly within the measurement uncertainty of KRISS, while some of those for S-band antenna show discrepancy. Fig. 7 also shows that the reflection coefficient is larger for the R-band than for the Sband. The mismatch factor ratio, in (4), is much lager for the R-band than for the S-band, as shown in Fig. 8.
The mismatch effect can theoretically be compensated for, regardless of the magnitude of the mismatching factor ratio. However, in real situations, the effect cannot be correctly compensated for due to the inherent inaccuracy in impedance measurements. In general, the measurement uncertainty of vector network analyzers increases with the magnitude of the reflection coefficient; consequently, the discrepancies in the gain results are greater for the R-band than for the S-band, as shown in Fig. 3.
A comparison of power gains, radiation patterns, and reflection coefficients for two R-/S-band standard gain horn antennas was performed by KRISS and seven domestic members (participants) of the Antenna Measurement Club in 2014.
In this comparison, antenna gain was measured by all the participants using the gain comparison method, whereas the extrapolation method was used at KRISS. Each of the participants used a commercial vector network analyzer and a conventional pattern measurement method in the far-field region of the transmitting and receiving antennas.
The measurements show that the results for the power gain, radiation pattern, and reflection coefficient of the R-/S-band antennas roughly agree with each other. Greater accuracy is required for the impedance measurements of the antennas—traveling antennas, standard (or reference) antennas used in the gain comparison method, and additional antennas used in the extrapolation method—and the measuring instruments for better impedance mismatch correction at the connection between the antennas and the measuring instruments, which will provide better agreement in the gain results.